. 2017 Jan 5;541(7635):102-106.
doi: 10.1038/nature20789. Epub 2016 Dec 5.

Splicing factor 1 modulates dietary restriction and TORC1 pathway longevity in C. elegans

Affiliations

Splicing factor 1 modulates dietary restriction and TORC1 pathway longevity in C. elegans

Caroline Heintz et al. Nature. .

Erratum in

Abstract

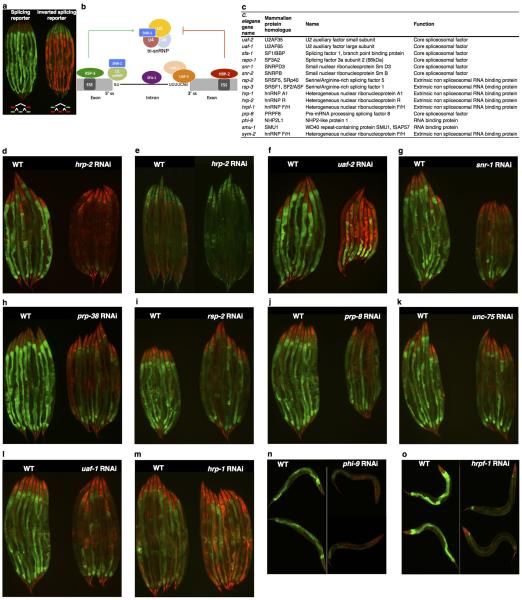
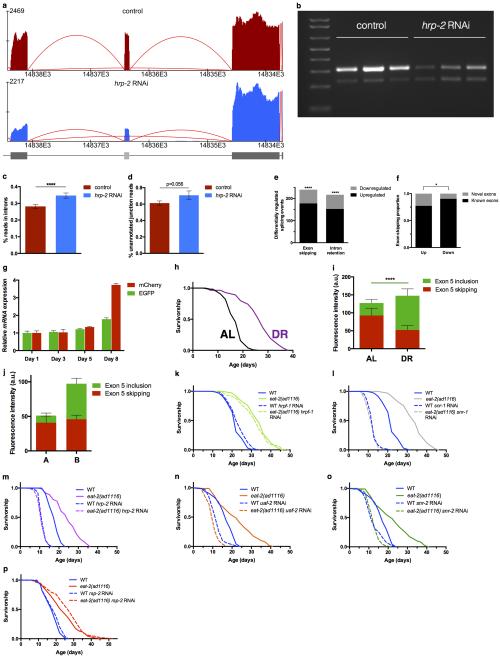
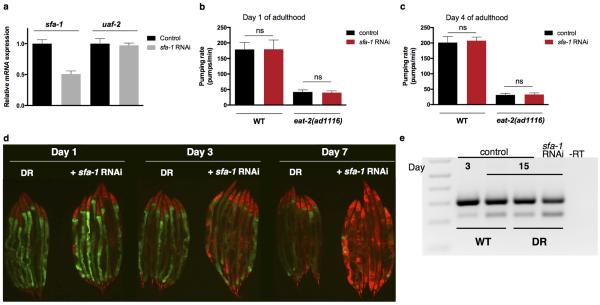
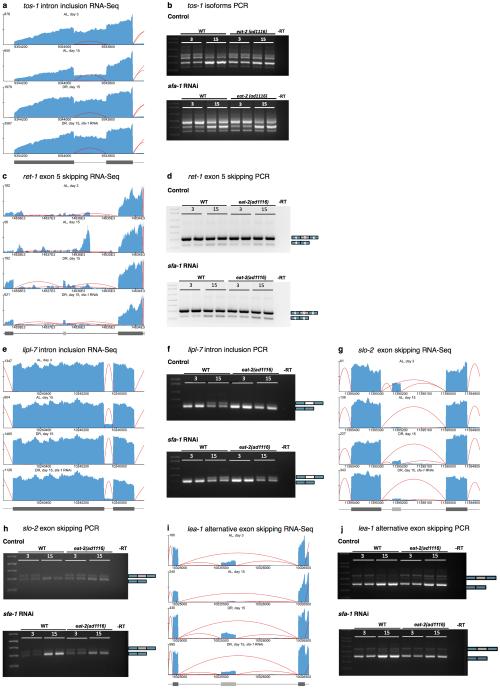
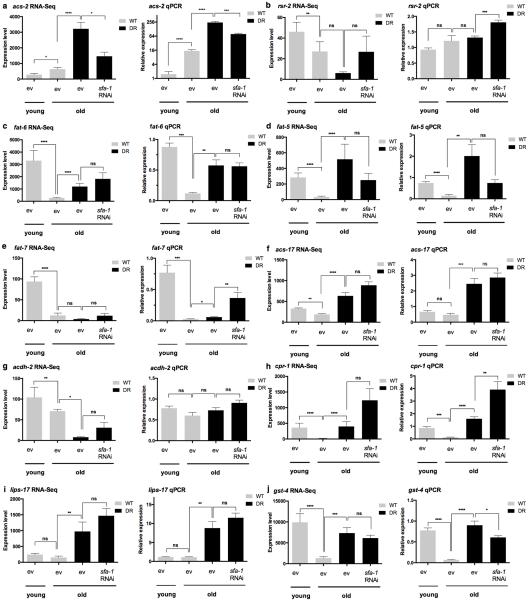
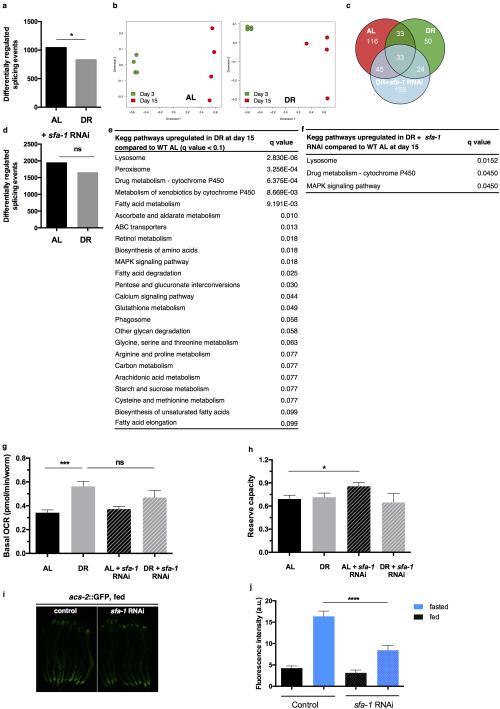
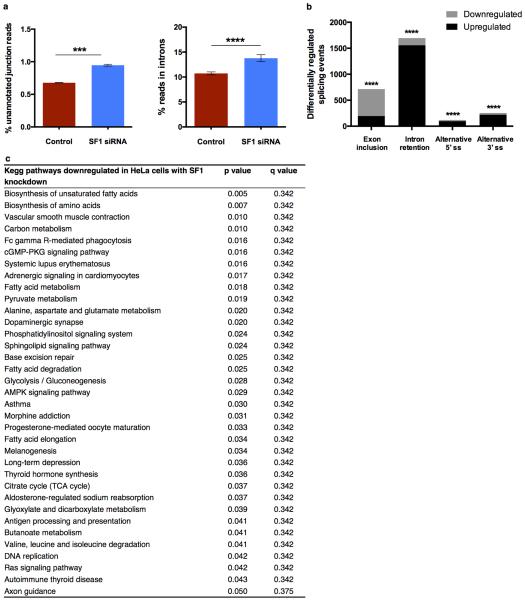
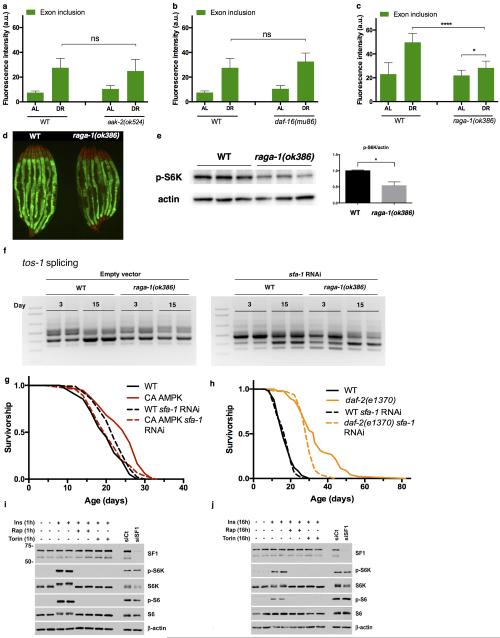
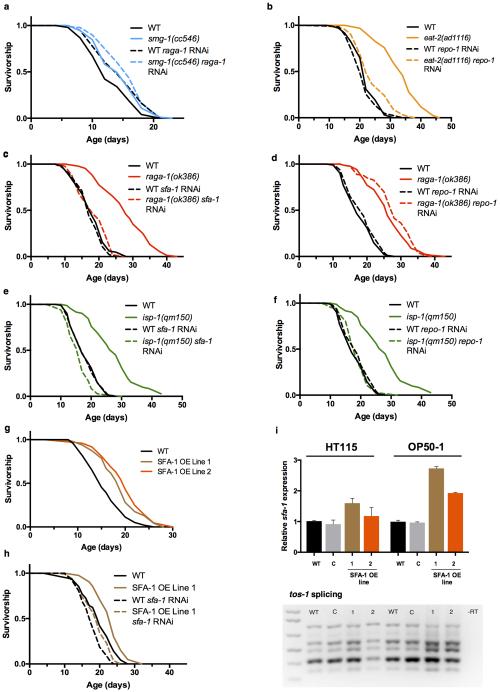
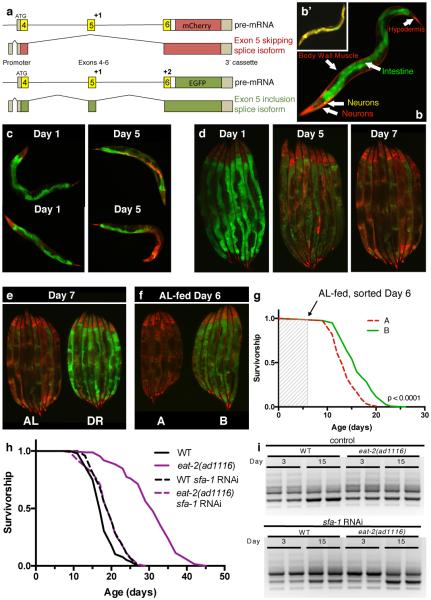
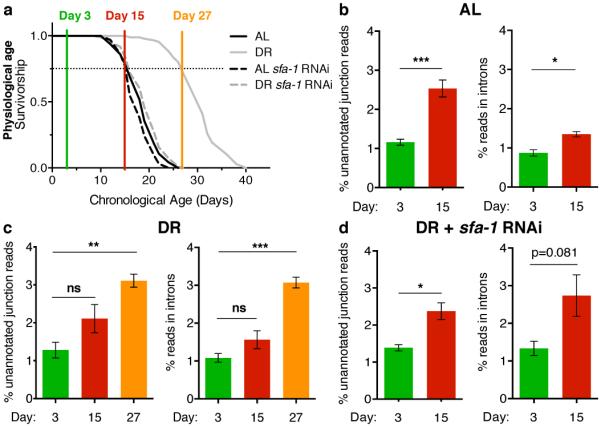
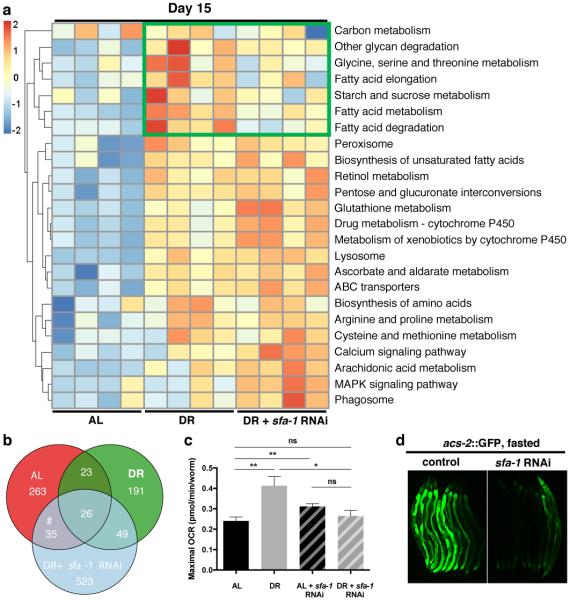
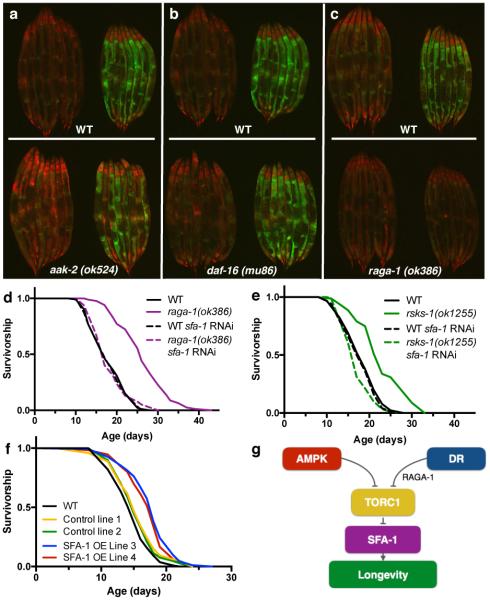
Ageing is driven by a loss of transcriptional and protein homeostasis and is the key risk factor for multiple chronic diseases. Interventions that attenuate or reverse systemic dysfunction associated with age therefore have the potential to reduce overall disease risk in the elderly. Precursor mRNA (pre-mRNA) splicing is a fundamental link between gene expression and the proteome, and deregulation of the splicing machinery is linked to several age-related chronic illnesses. However, the role of splicing homeostasis in healthy ageing remains unclear. Here we demonstrate that pre-mRNA splicing homeostasis is a biomarker and predictor of life expectancy in Caenorhabditis elegans. Using transcriptomics and in-depth splicing analysis in young and old animals fed ad libitum or subjected to dietary restriction, we find defects in global pre-mRNA splicing with age that are reduced by dietary restriction via splicing factor 1 (SFA-1; the C. elegans homologue of SF1, also known as branchpoint binding protein, BBP). We show that SFA-1 is specifically required for lifespan extension by dietary restriction and by modulation of the TORC1 pathway components AMPK, RAGA-1 and RSKS-1/S6 kinase. We also demonstrate that overexpression of SFA-1 is sufficient to extend lifespan. Together, these data demonstrate a role for RNA splicing homeostasis in dietary restriction longevity and suggest that modulation of specific spliceosome components may prolong healthy ageing.


Figures

Extended Data Figure 1
Extended Data Figure 1. Heterogeneous splicing patterns in response to knockdown of conserved splicing factors
a, Inverted fluorophore splicing reporter b, Simplified diagram of C. elegans intron splicing showing representative splicing factors investigated herein c, C. elegans splicing factors and their mammalian homologues. Knockdown of hrp-2 in splicing reporter (d) and hrp-2 in inverted reporter (e), uaf-2 (f), snr-1 (g), prp-38 (h), rsp-2 (i), prp-8 (j), unc-75 (k) and uaf-1 (l) by RNAi at day 1 of adulthood. m, hrp-1 depletion at day 4 of adulthood. n and o, Representative images of worms with hrpf-1 and phi-9 knockdown in day 1 adults with reduced exon inclusion.
Extended Data Figure 2
Extended Data Figure 2. Effects of splicing factor knockdown on splicing homeostasis and DR-mediated longevity
a, RNA-Seq coverage tracks for endogenous ret-1 splicing in hrp-2 knockdown samples. b, Endogenous ret-1 splicing exon 5 skipping in WT and hrp-2 RNAi worms by RT-PCR (3 biological replicates). Intronic reads (c, p=0.0042), and unannotated junctions reads (d, p=0.056) as hallmarks of deregulated splicing with hrp-2 knockdown. p values: unpaired, two-tailed t-test after probit transformation. e, Differentially regulated alternative splicing events induced by hrp-2 depletion (**** exon inclusion: p<0.0001, intron retention p<0.0001, Pearson chi-squared test). f, Proportion plot of all exon skipping events with proportions of novel and known exons up- or downregulated in hrp-2 knockdown samples (p=0.0157, differences in proportions of novel exons in up- and downregulated events were tested with Pearson’s chi-squared test, deviations from an even proportion of up- and downregulated splicing events were tested with binomial test). g, EGFP and mCherry mRNA levels up to day 8 of adulthood by qRT-PCR (mean ± SD, technical replicates shown). h, sDR robustly extends C. elegans AL lifespan (p<0.0001). i, Fluorescence quantification of splice isoforms in day 7 old AL and sDR animals (**** p<0.0001, unpaired two-tailed t-test, mean ± SD, n=8). j, Age-matched, AL-fed worm populations separated at day 6 according to group A (increased exon 5 skipping) and group B (increased exon 5 inclusion) (mean ± SD, n=6, 1 of 3 biological replicates shown). k, Effect of hrpf-1 RNAi on WT and eat-2(ad1116) lifespan (WT vs. eat-2(ad1116) on hrpf-1 RNAi, p<0.0001). l, Comparison of survival rates of WT and eat-2(ad1116) with snr-1 RNAi (p=0.5147). Survival analysis of hrp-2 (m) and uaf-2 (n) downregulation by RNAi. o, Effect of snr-2 knockdown on WT and DR lifespan. p, WT and DR lifespan curves with rsp-2 knockdown. Lifespans done with FUDR as indicated in Extended Data Table 1 and Supplementary Table 10. p values survival analysis: log-rank (Mantel-Cox) test. Sequencing reads tracks generated by Splicing Java Coverage Viewer as part of SAJR. Height of red lines represent RNA coverage of splice junctions, dark gray boxes represent exonic sequence, light gray box denotes alternative exon sequence.
Extended Data Figure 3
Extended Data Figure 3. Effects of sfa-1 downregulation on splicing
a, uaf-2 gene expression is not affected by reduced sfa-1 levels in WT worms at day 1 of adulthood (mean ±SD, technical replicates shown). Effect of reduced sfa-1 expression on pumping rates in WT and genetic DR model eat-2(ad1116) at day 1 (b) and 4 of adulthood (c) (mean ±SD, ns p > 0.05, unpaired, two-tailed t-test, n=10 worms per condition). d, Splicing reporter pattern with sfa-1 knockdown from egg hatch, day 1, 3 and 7 old adults. e, Endogenous ret-1 exon 5 splicing pattern with age and sfa-1 RNAi in WT and DR worms by RT-PCR (day 3 vs.15, independent replicate sample set).
Extended Data Figure 4
Extended Data Figure 4. RT-PCR validation of alternative splicing events in ageing and with sfa-1 knockdown
a, Sequencing reads coverage for tos-1 b, Age-associated isoform ratio change of a target of SFA-1, target of splicing (tos-1) in WT worms at day 3 and 15 of adulthood ± sfa-1 RNAi by RT-PCR (biological replicates 3 and 4 shown). c, Sequencing read coverage map for ret-1 shows increased exon 5 skipping with age and with sfa-1 RNAi. d, Endogenous ret-1 exon 5 splicing pattern with age and sfa-1 RNAi in WT and DR worms by RT-PCR (day 3 vs. 15, 2 biological replicates shown). e, Sequencing tracks for lipl-7 pre-mRNA. f, Monitoring of intron retention between exons 4 and 5 at day 15 vs. day 3 of adulthood in WT and DR worms, +/− sfa-1 RNAi. g, Sequencing reads tracks for slo-2 pre-mRNA. h, slo-2 alternative exon skipping in day 3 and day 15 old WT and DR worms, +/− sfa-1 RNAi. i, Sequencing reads tracks for lea-1 pre-mRNA j, Alternative exon skipping in lea-1 with age and sfa-1 knockdown in WT and DR animals. Sequencing reads tracks generated by Splicing Java Coverage Viewer as part of SAJR; height of red lines represent RNA coverage of splice junctions, dark gray boxes represent exonic sequence, light gray boxes are alternative exon sequence.
Extended Data Figure 5
Extended Data Figure 5. RNA-Seq expression data validation by quantitative RT-PCR
Monitoring of gene expression levels by quantitative RT-PCR for RNA-Seq data validation of acs-2 (a), rsr-2 (b), fat-6 (c), fat-5 (d), fat-7 (e), acs-17 (f), acdh-2 (g), cpr-1 (h), lips-17 (i) and gst-4 (j) in 6 biological replicates for day 3 old WT worms and 5 biological replicates for all other samples at day 15 (**** p ≤ 0.0001, ***p ≤ 0.001, ** p ≤ 0.01, *p ≤ 0.05, ns > 0.05, error bars RNA-Seq Benjamini Hochberg, qRT-PCR: unpaired, two-tailed t-test)
Extended Data Figure 6
Extended Data Figure 6. Genome-wide effects of DR and SFA-1 depletion on pre-mRNA splicing and metabolism
a, Differentially regulated splicing events (exons, introns, alternative 5’ and 3’ splice sites) in DR at day 15 compared to AL (p=0.0156, Wilcoxon signed rank test). b, Multidimensional scaling plot of significantly different splicing patterns using inclusion-ratio estimates between day 3 and day 15 old worms (changes in all significant pre-mRNA segments e.g. exons, introns, alternative splice sites considered). c, Venn diagram representing significantly up- or downregulated novel splicing events at day 15 in AL, DR and DR+sfa-1 RNAi (subset of unannotated splice junctions). d, Differentially regulated splicing events (exons, introns, alternative 5’ and 3’ splice sites) with sfa-1 knockdown (AL+ sfa-1 vs. DR+ sfa-1 p=0.7999, Wilcoxon signed rank test). e, KEGG pathways significantly upregulated in DR worm populations at day 15 compared to WT worm populations of the same chronological age with false discovery rate (FDR) of 10%. f, KEGG pathways significantly upregulated in DR worm populations with sfa-1 knockdown at day 15 compared to AL fed worm populations with FDR 10%. Basal respiration (g) and reserve capacity (h) in WT and DR animals (mean ± SEM, *** p ≤ 0.001, *p ≤ 0.05, unpaired two-tailed t-test. Results shown are oxygen consumption rates of day 15 old worms normalized to day 4 old populations, n=100 worms/condition). i, Transcriptional induction of acs-2p::GFP in fed control and sfa-1 knockdown worms (representative image of 2 repeat experiments shown, # worms: ev fed n=83, ev fasted n=77, sfa-1 RNAi fed n=76, 3 sfa-1 RNAi fasted n=84). j, Quantification of acs-2p::GFP after 23 hours of fasting sfa-1 knockdown (mean ± SEM of 2 replicate experiments, p < 0.0001, unpaired two-tailed t-test).
Extended Data Figure 7
Extended Data Figure 7. Effects of SF1 knockdown in HeLa cells
a, Effect of splicing factor 1 (SF1) in knockdown HeLa cells on unannotated junction reads (mean ± SEM, p=0.0006) and reads in introns (mean ± SEM, p=0.0242), unpaired, two-tailed t-test after probit transformation. b, Differentially regulated alternative splicing events (exon skipping, intron retention, alternative 5’ and 3’ splice sites) with SF1 knockdown with exons primarily downregulated whereas introns are significantly upregulated (**** p<0.0001, Pearson chi-squared test). c, KEGG pathway analysis of gene expression changes upon SF1 knockdown. Pathways with p ≤ 0.05 considered, p values derived by gage.
Extended Data Figure 8
Extended Data Figure 8. SFA-1 and the mTORC1 Pathway
Quantification of ret-1 minigene exon inclusion (GFP intensity) in aak-2(524) (a, AL vs. DR p=0.5488, ns, unpaired two-tailed t-test, mean ± SD, n=8), and b, in daf-16(mu86) (AL vs. DR p=0.1835, ns, unpaired t-test, mean ± SD, n=8) c, Quantification of GFP in raga-1(ok386) mutants at day 8 on AL and DR (p<0.0001, unpaired two-tailed t-test, mean ± SD) (1 of 3 replicate imaging experiments shown). d, Splicing reporter expression in day 1 old WT and raga-1(ok386) animals. e, Immunoblot of proteins from WT and raga-1(ok386) animals assaying S6K phosphorylation state. f, tos-1 isoform ratios in raga-1(ok386) mutants at day 3 and 15 of adulthood with sfa-1 RNAi (biological replicates shown). g, Survival analysis of sfa-1 RNAi in CA AMPK mutant (p=0.4844, WT + sfa-1 RNAi vs. CA AMPK + sfa-1 RNAi). h, Survival analysis of SFA-1 knockdown in insulin/IGF signalling-mediated longevity (daf-2(e1370), p<0.0001 compared to WT + sfa-1 RNAi). i, Immunoblots of proteins from WT MEFs. p-S6K T389 and p-S6 S240/S244 (markers of mTORC1 activation), total S6K, total S6, non-targeting control siRNAs (siCt), SF1 siRNA, and β-actin (loading control) are shown. j, Immunoblots of proteins from WT MEFs treated for 16h. Biological duplicates are shown except for the siRNA treated lanes. p values survival analysis by log-rank test.
Extended Data Figure 9
Extended Data Figure 9. Differential effects of sfa-1 and repo-1 knockdown in multiple longevity pathways
a, Effect of raga-1 RNAi in nonsense mediated decay defective smg-1(cc546) mutant worms (p=0.041 RNAi treatments, lifespan at 24°C). b, Survival of WT and (eat-2(ad1116)) on repo-1 RNAi (p<0.0001, vs. WT+repo-1 RNAi). c, sfa-1 RNAi blocks RAGA-1 mediated longevity (p=0.2181, Gehan-Breslow-Wilcoxon test). d, repo-1 RNAi has no effect on raga-1(ok386) longevity (p<0.0001). e, Effect of sfa-1 RNAi on mitochondrial ETC mutant isp-1(qm150) mediated longevity (p=0.004). f, repo-1 RNAi shortens isp-1(qm150)-mediated longevity to WT levels (p=0.4951). g, Effect of SFA-1 overexpression on WT lifespan on OP50-1 bacteria (p<0.0001 both lines). h, Survival analysis of WT and SFA-1 overexpression lines on sfa-1 RNAi (p=0.0042). i, Top: Monitoring of sfa-1 levels by qRT-PCR (C: injection marker control line; 1, 2: SFA-1 overexpression lines, error bars mean ± SD of 2 biological replicates for strains grown on HT115 bacteria (left), error bars are mean ± SD of 2 technical replicates for strains grown on OP50-1 bacteria (right)) Bottom: tos-1 isoform ratios with SFA-1 overexpression in day 1 adults. p values survival analysis by log-rank test.
Figure 1
Figure 1. The role of RNA splicing in DR longevity
a, ret-1 splicing reporter schematic. b, Tissue-specific ret-1 splicing in day 1 C. elegans. b’, Control reporter without frameshifts. c, Representative reporter splicing at days 1 and 5, and d, days 1, 5, and 7. e, Splicing reporter worms on AL or DR at day 7. f, Representative images of age-matched animals in group A (increased exon 5 skipping) and group B (increased exon 5 inclusion). g, Survival of groups A and B. Arrow denotes sorting day (1 of 2 replicates). h, Survival of WT and eat-2(ad1116) animals +/− sfa-1 RNAi (7 replicates). i, tos-1 isoforms in WT worms and eat-2(ad1116) +/− sfa-1 RNAi (day 3 vs. 15, n=2 biological replicates). Lifespans: n=100 worms/condition; p values: log-rank test.
Figure 2
Figure 2. DR promotes genome-wide splicing efficiency
a, Survival of AL and DR (eat-2(ad1116)) populations +/− sfa-1 RNAi collected for RNA-Seq. b, By day 15, AL significantly increases unannotated junction reads (*** p=0.0006) and intron retention (* p=0.0106) compared to day 3. c, No significant increase in unannotated junction reads or intron retention between day 3 and 15 DR-fed animals (p>0.05 in each case). By day 27, DR-fed worms have significantly increased unannotated junction reads (** p=0.0036) and intron retention (*** p= 0.0004) compared to day 3. d, Unannotated junction reads and intron reads in DR with sfa-1 RNAi (day 15 vs. 3, ** p=0.0065, ns p>0.05). Mean ± SEM, % of total reads shown, p values panels b-d: unpaired, two-tailed t-test after probit transformation.
Figure 3
Figure 3. SFA-1 regulates metabolic effects of DR
a, Heatmap of KEGG analysis in WT AL, DR and DR+sfa-1 RNAi at day 15. b, Venn diagram representing intron inclusion events at day 15 in AL, DR and DR+sfa-1 RNAi (#GO analysis in Supplementary Table 8). c, Maximal respiratory capacity (day 15 normalized to day 4, ** p<0.01, * p<0.05, unpaired, mean ± SEM, two-tailed t-test, n=100 animals/condition). d, Transcriptional induction of acs-2P::GFP in control and sfa-1 knockdown worms after 23 hours of fasting (representative image of 2 experiments shown).
Figure 4
Figure 4. SFA-1 promotes longevity
AL and DR-fed splicing reporter at day 8 in a, aak-2(ok524), b, daf-16(mu86), and c, (raga-1(ok386) mutant backgrounds. Images are representative of at least 2 independent experiments. d, Effect of sfa-1 RNAi on raga-1(ok386) mutant lifespan (p=0.6733 vs. WT+sfa-1 RNAi). e, Lifespan analysis of sfa-1 RNAi in long-lived rsks-1(ok1255) (p=0.0944 vs. WT+sfa-1 RNAi). f, Overexpression of SFA-1 affects WT lifespan (p<0.0001). g, Model for role of SFA-1 in DR and mTORC1 pathway longevity. p values: log-rank test, n=100 worms/condition.

Comment in

  • Making a splash with splicing.
    Branicky R, Hekimi S. Branicky R, et al. Cell Res. 2017 Apr;27(4):457-458. doi: 10.1038/cr.2017.24. Epub 2017 Feb 24. Cell Res. 2017. PMID: 28233771 Free PMC article.

References

    1. Kenyon C. The genetics of ageing. Nature. 2010;464:504–12. - PubMed
    1. Taylor R, Dillin A. Aging as an Event of Proteostasis Collapse. Cold Spring Harb Perspectives Biology. 2011;3:a004440. - PMC - PubMed
    1. Vermulst M, et al. Transcription errors induce proteotoxic stress and shorten cellular lifespan. Nature Communications. 2015;6 - PMC - PubMed
    1. Wang G-S, Cooper T. Splicing in disease: disruption of the splicing code and the decoding machinery. Nat Rev Genet. 2007;8:749–761. - PubMed
    1. Singh R, Cooper T. Pre-mRNA splicing in disease and therapeutics. Trends Mol Med. 2012;18:472–82. - PMC - PubMed

MeSH terms

Substances