. 2016 Dec 15;540(7633):423-427.
doi: 10.1038/nature20612. Epub 2016 Dec 5.

Genome-wide changes in lncRNA, splicing, and regional gene expression patterns in autism

Affiliations

Genome-wide changes in lncRNA, splicing, and regional gene expression patterns in autism

Neelroop N Parikshak et al. Nature. .

Erratum in

Abstract

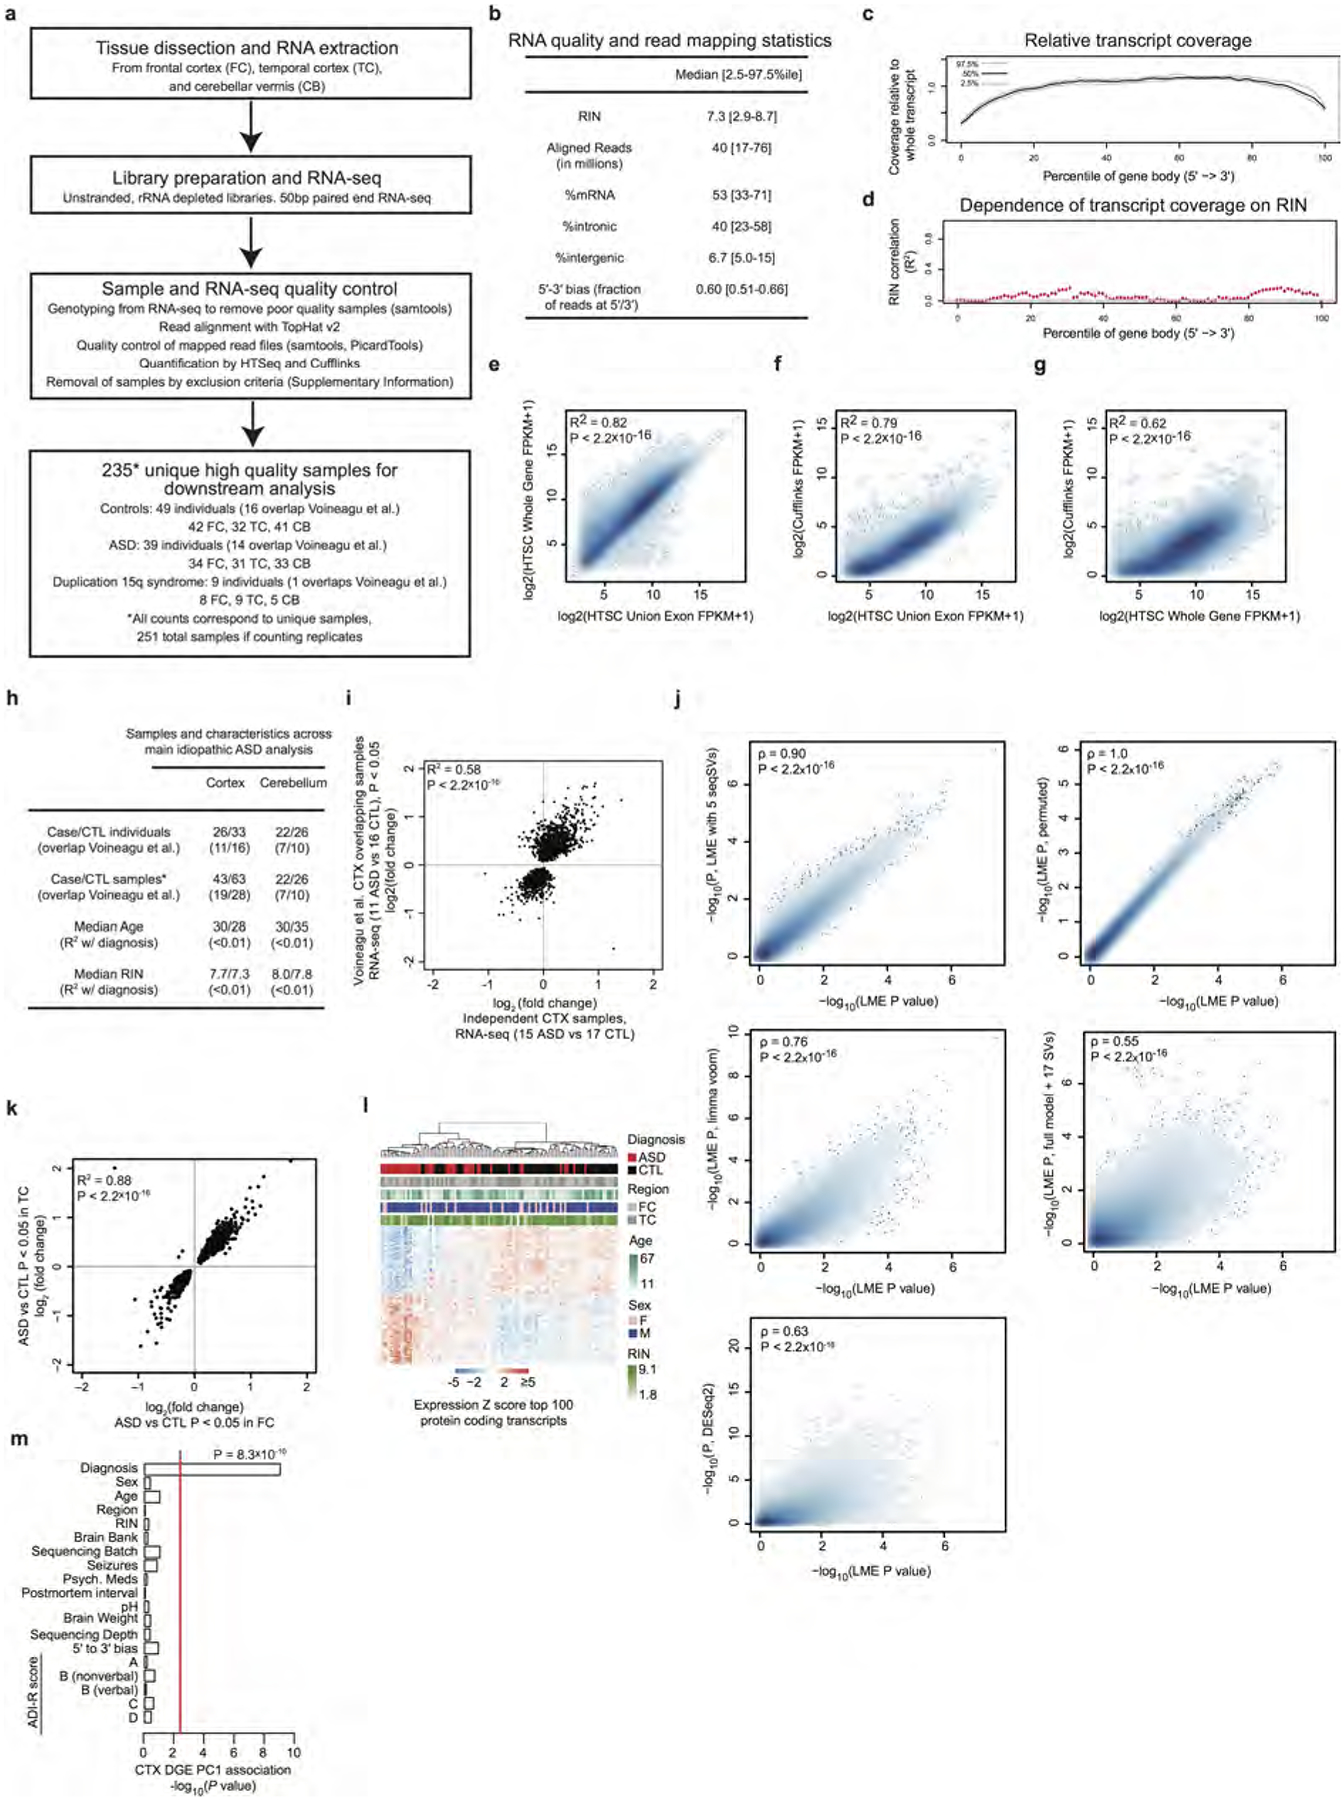
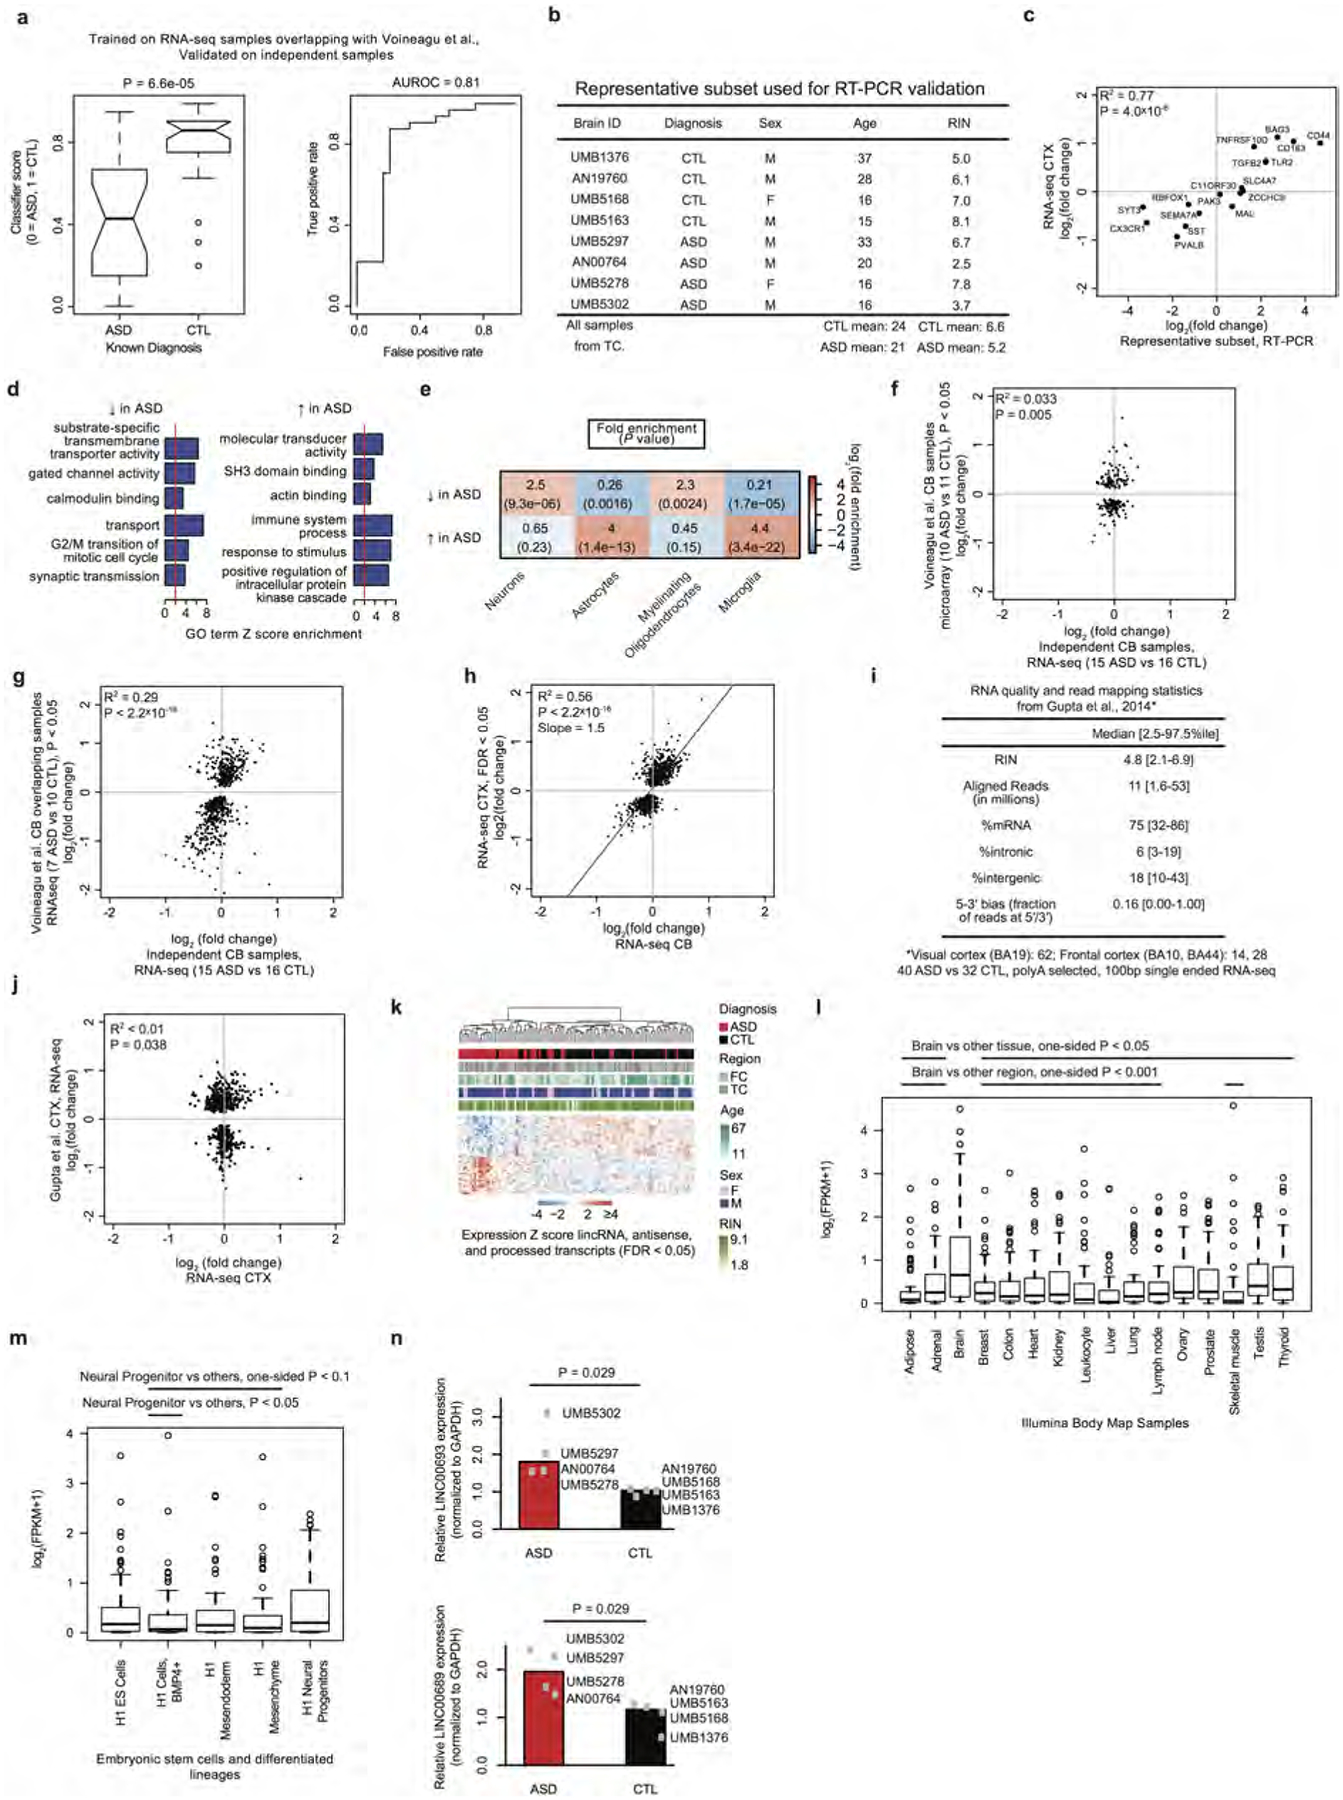
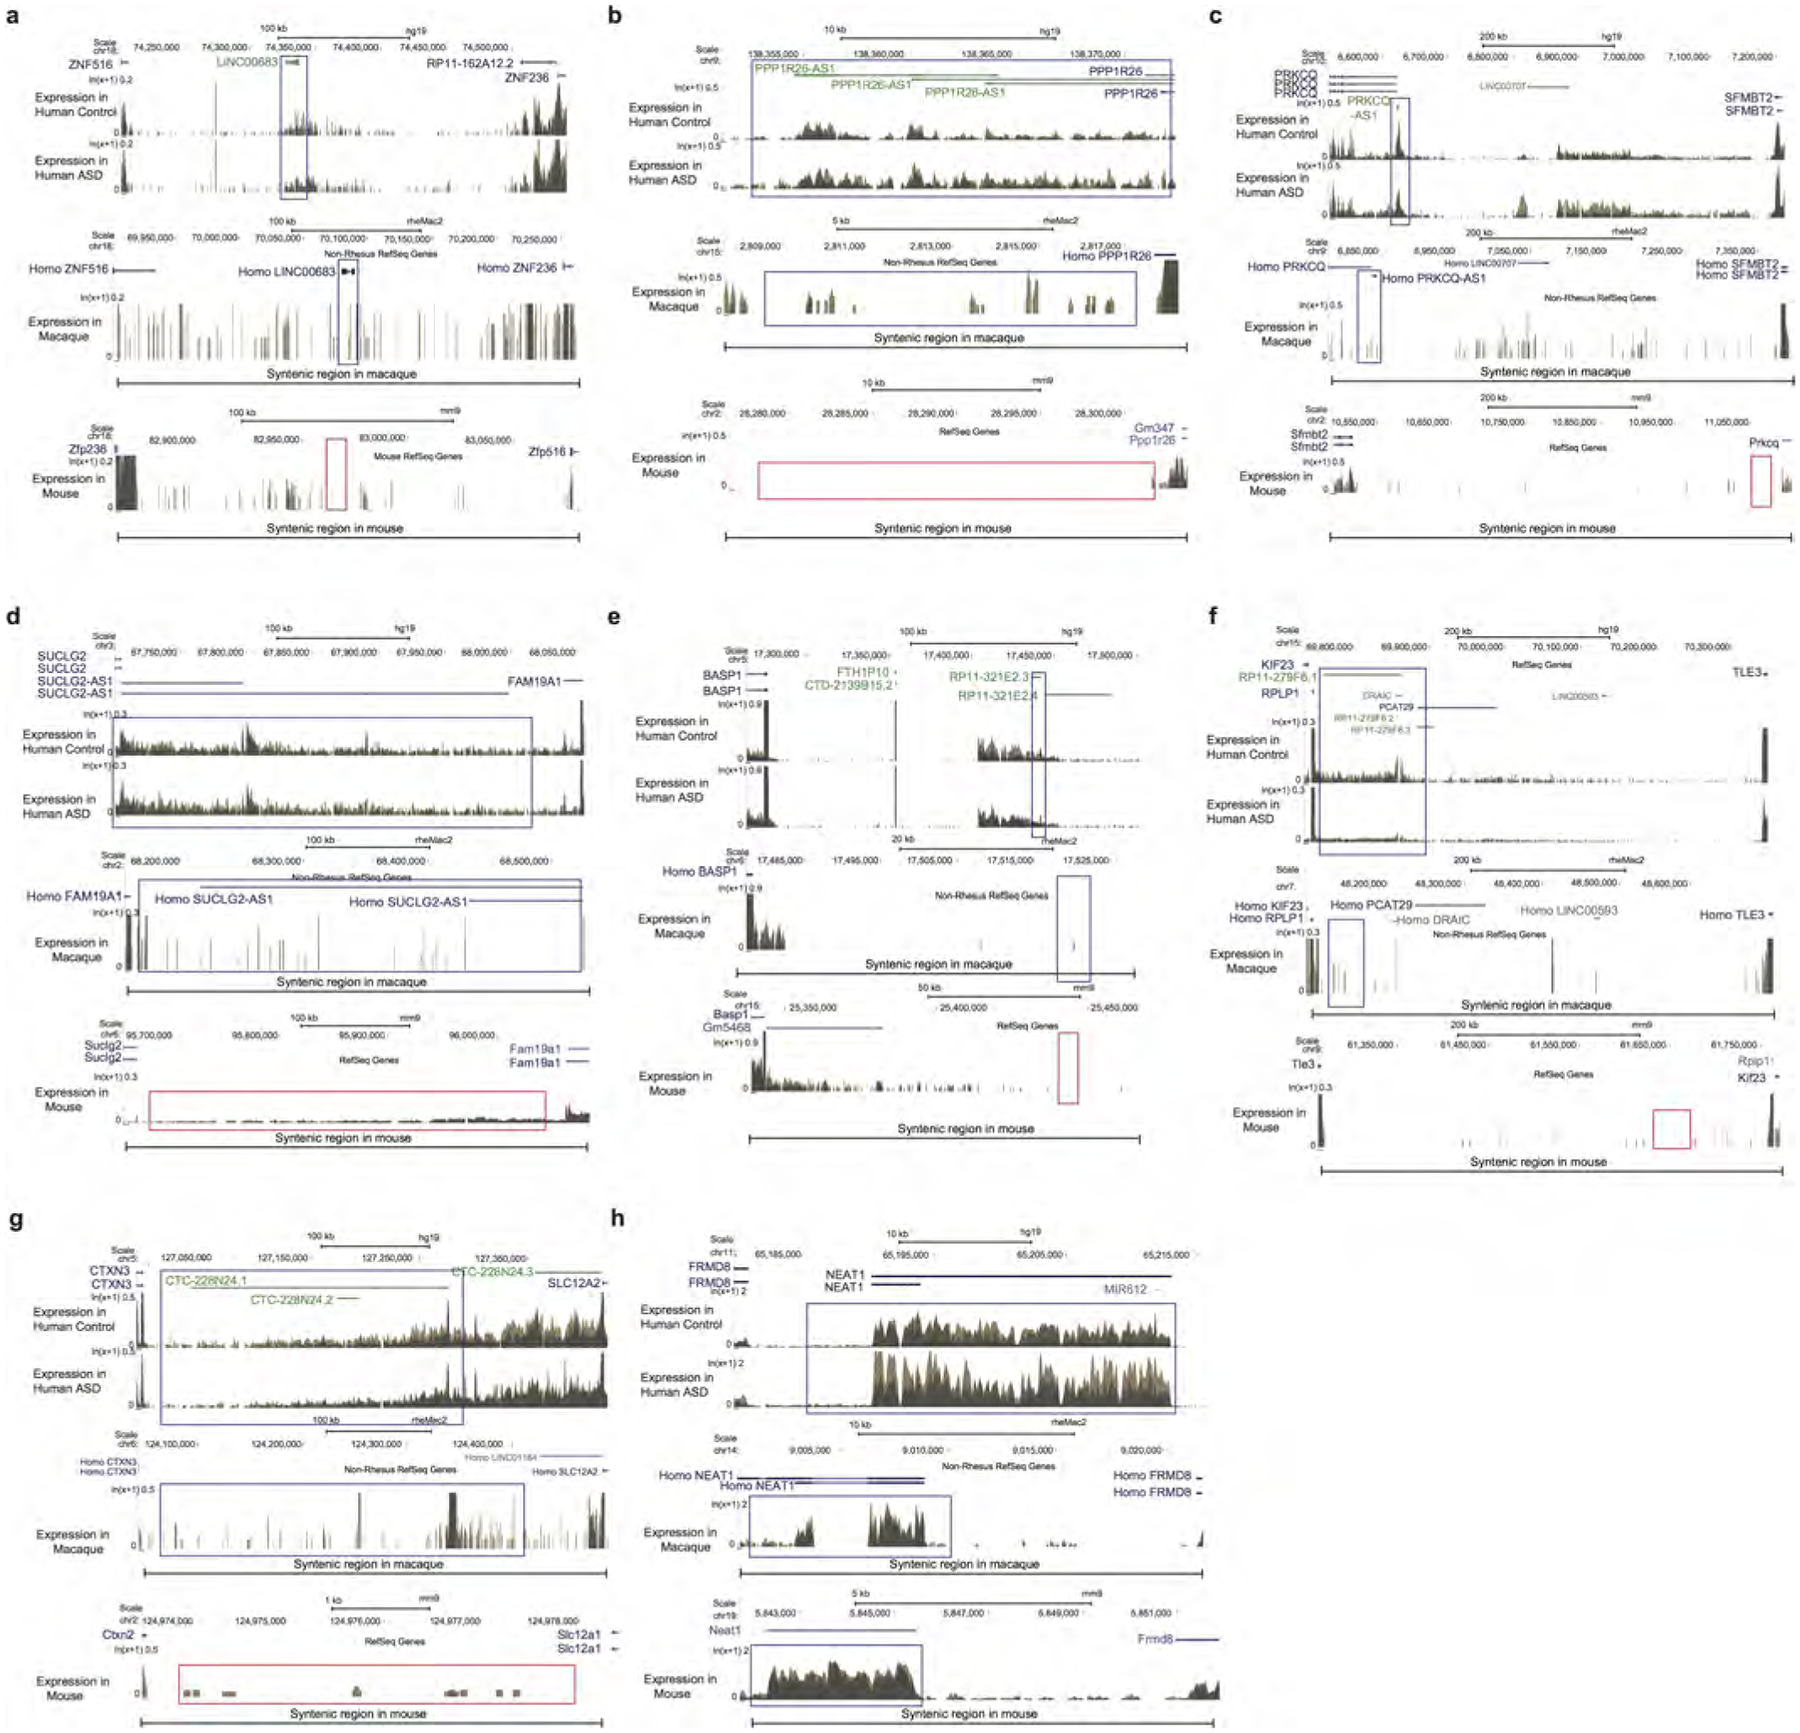
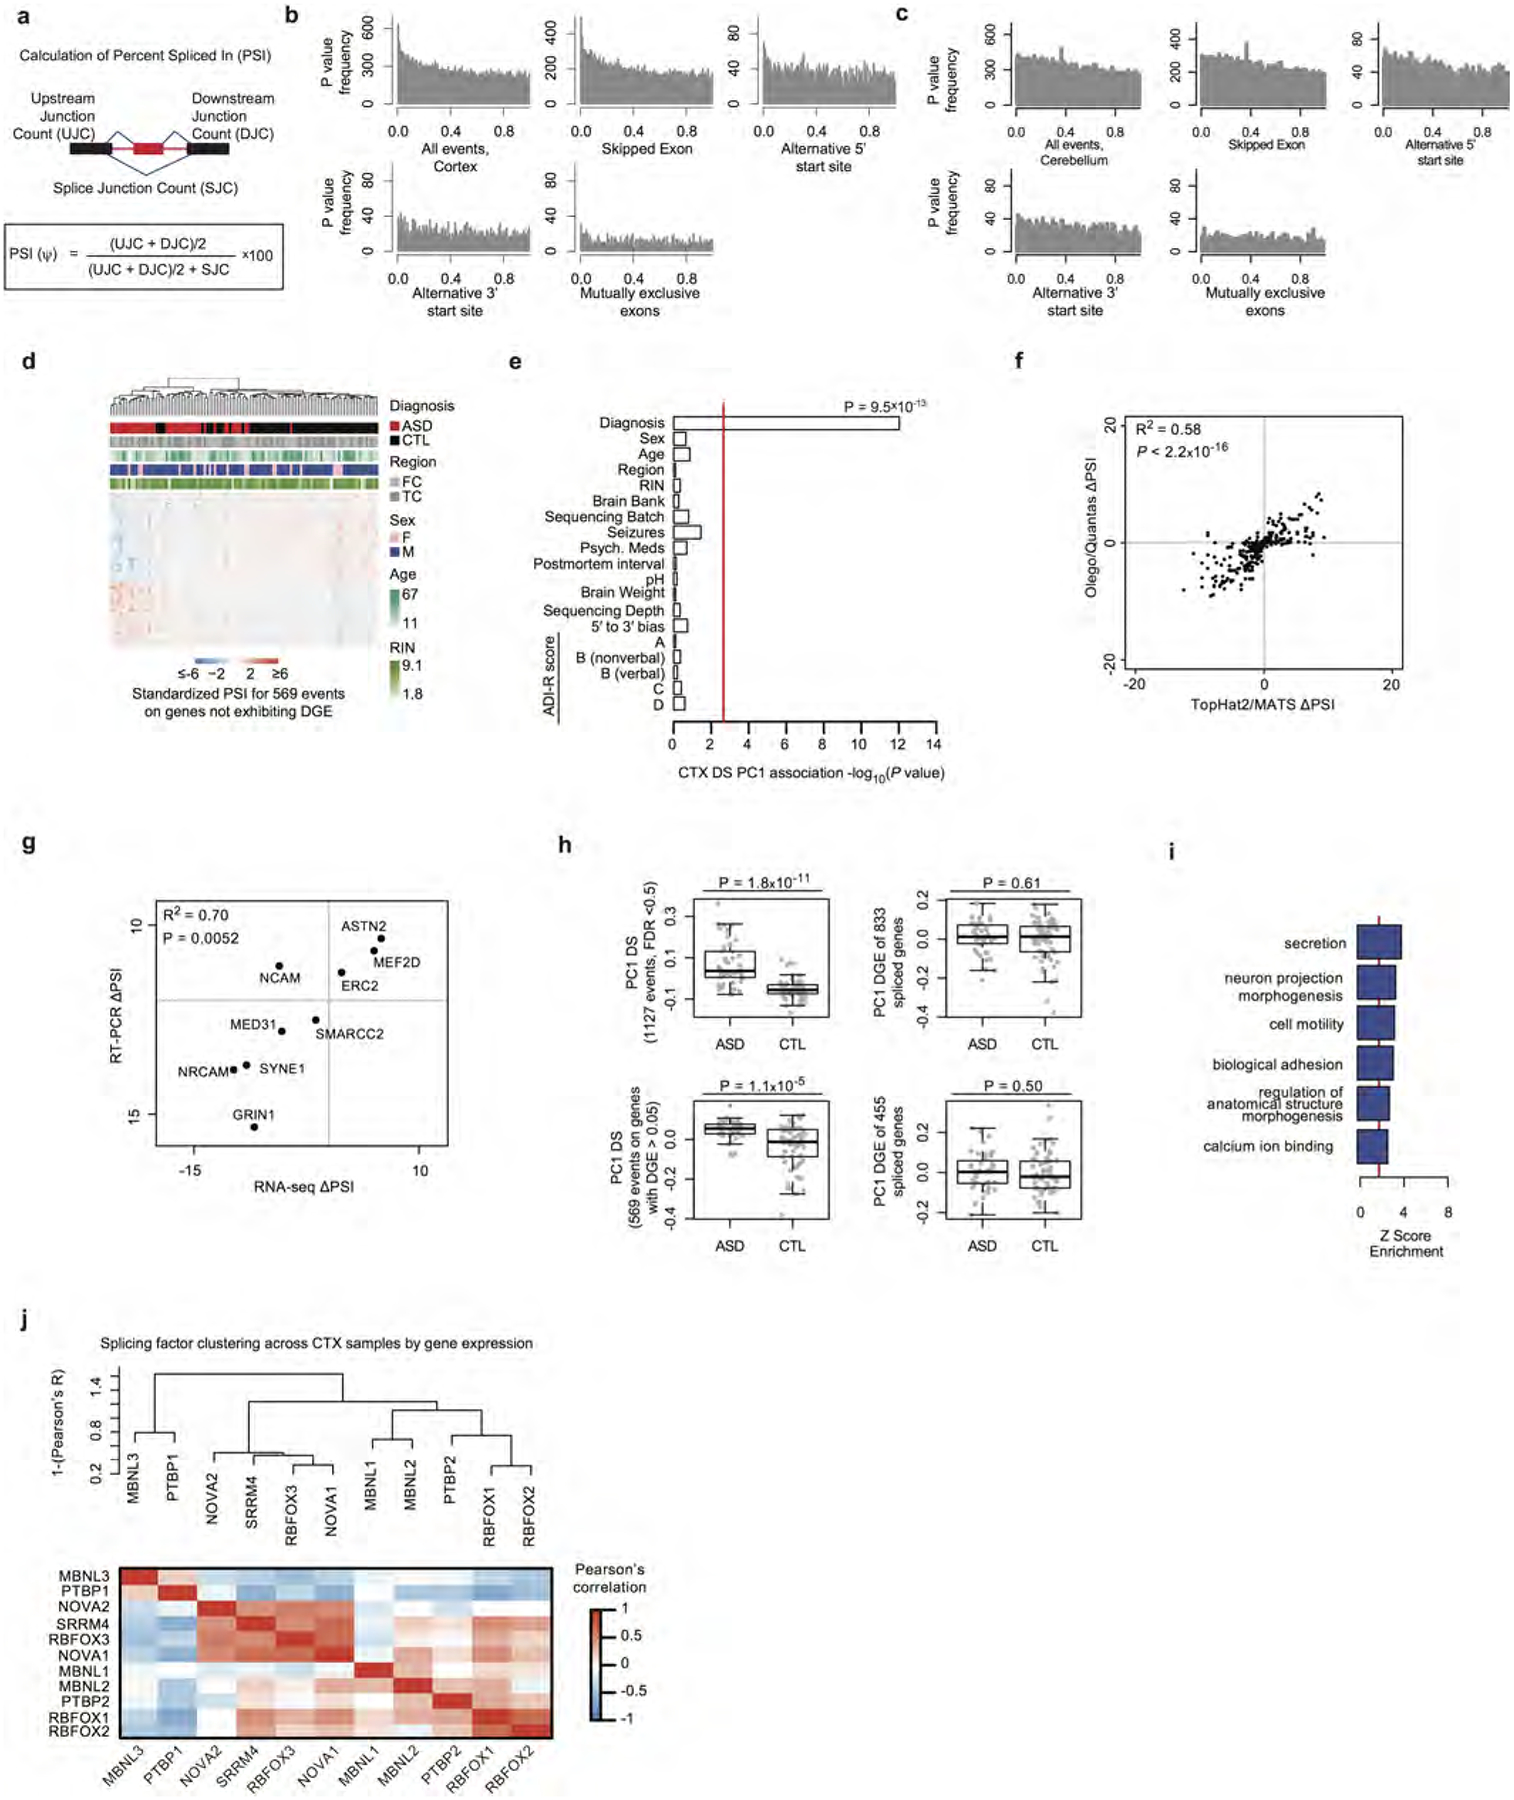
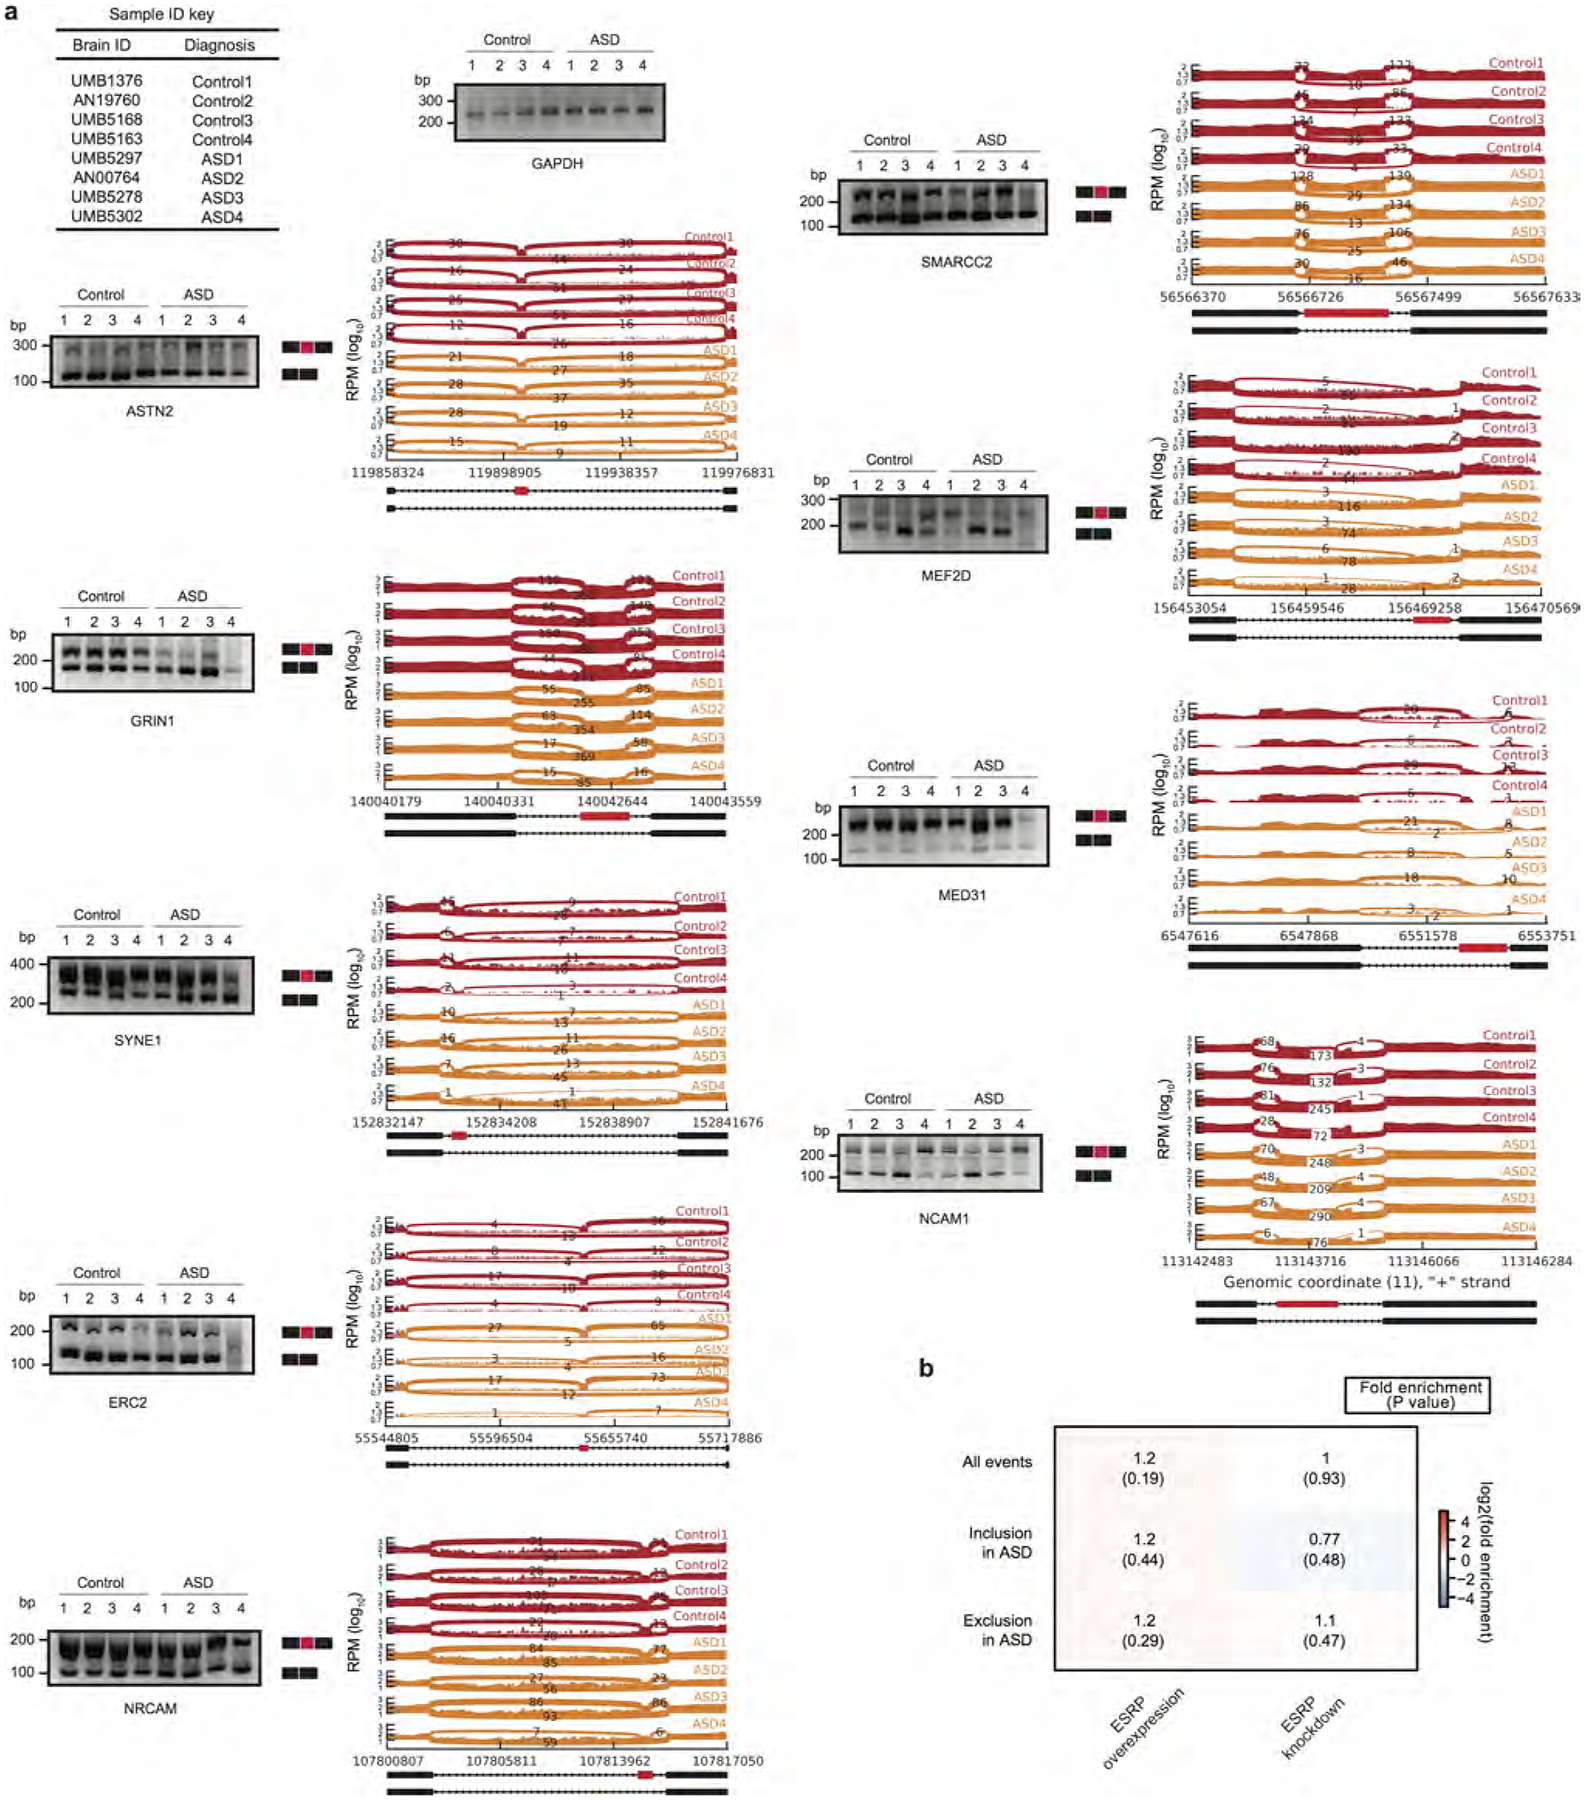
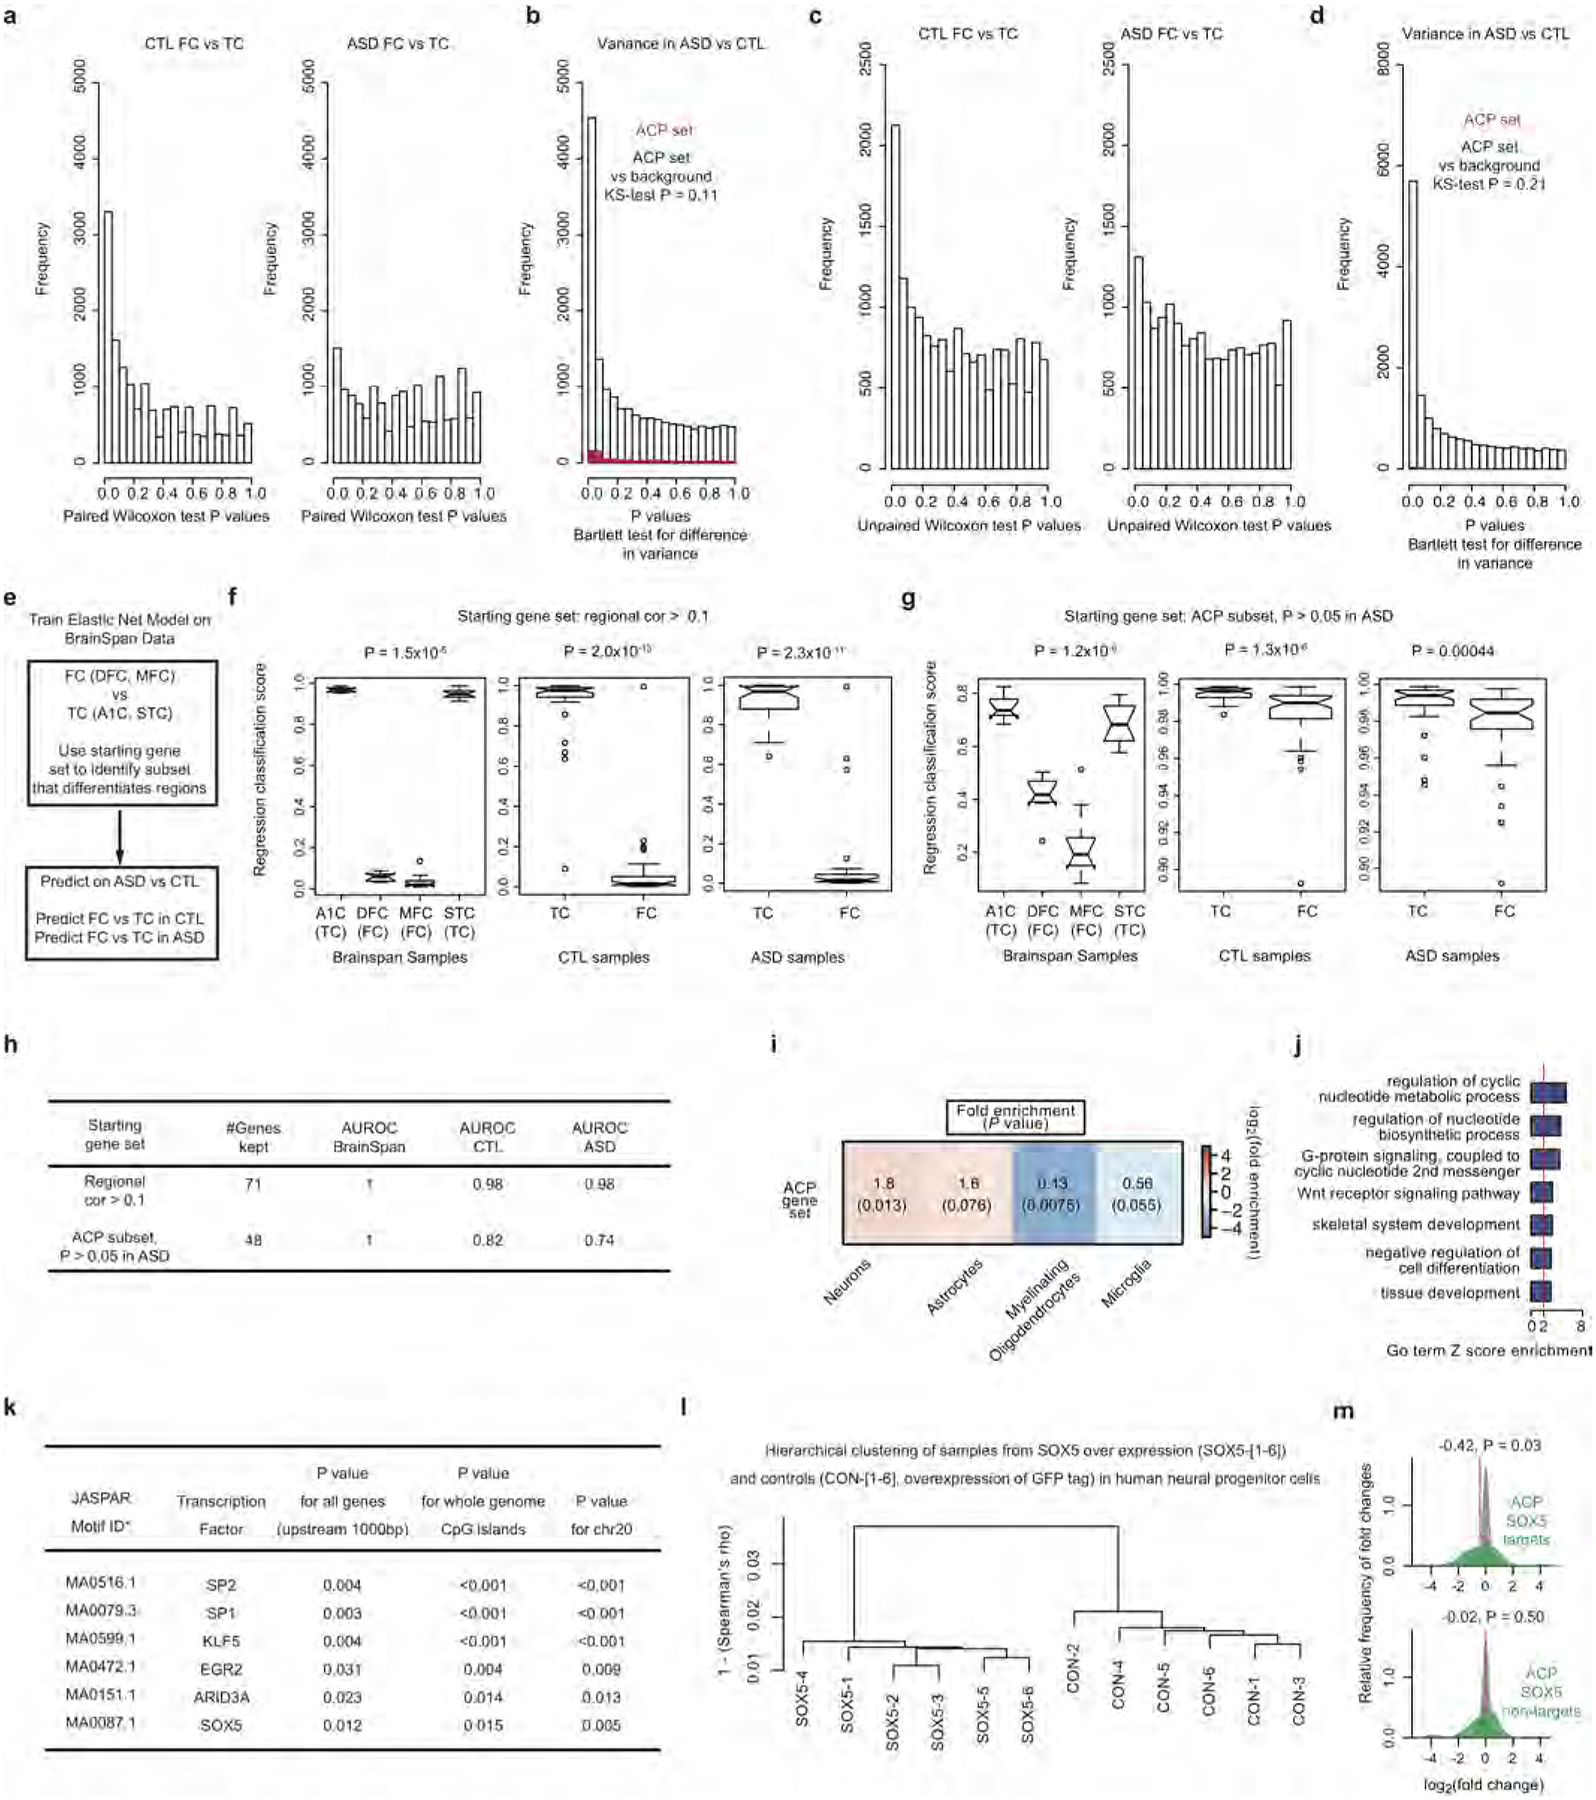
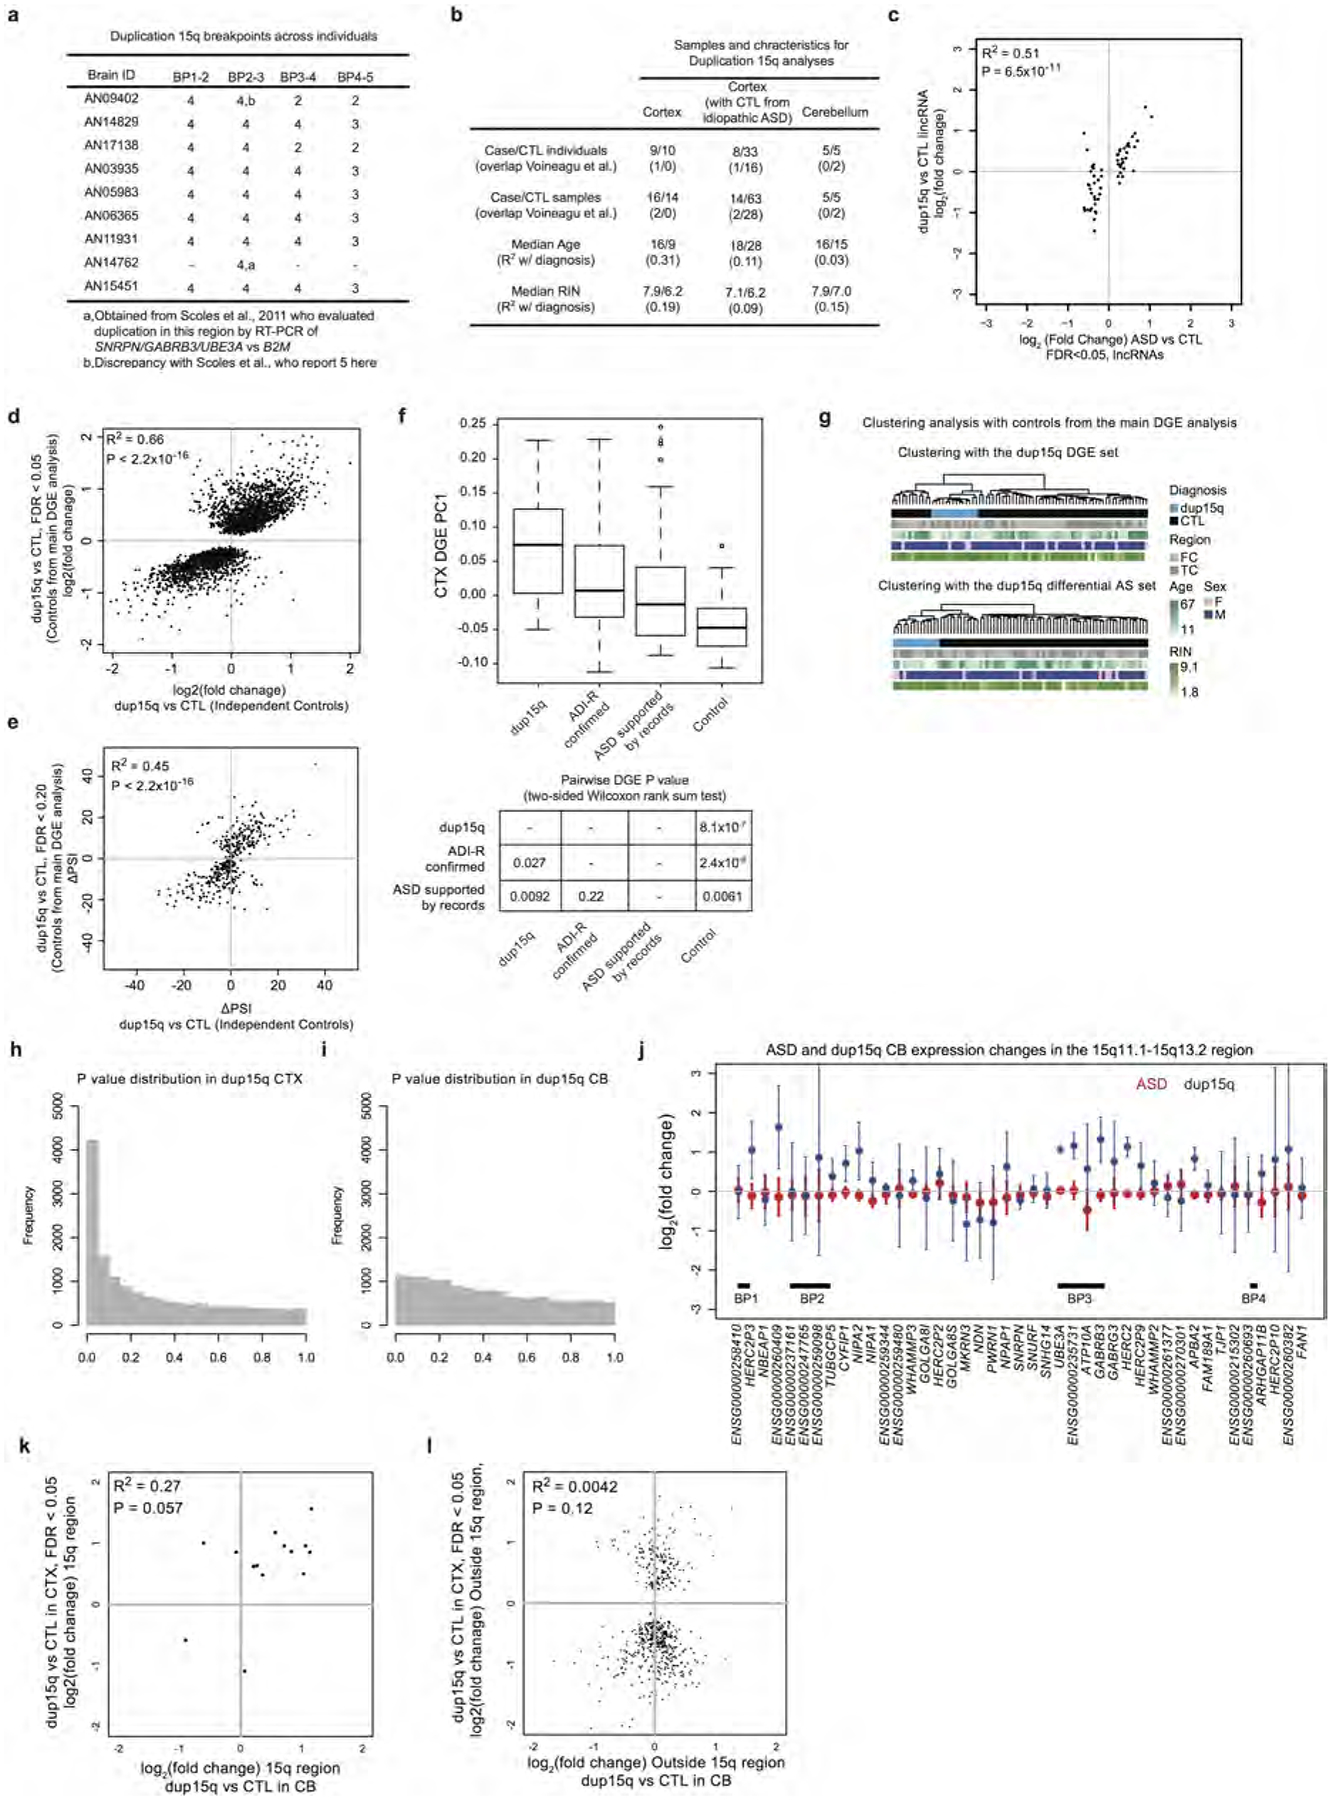
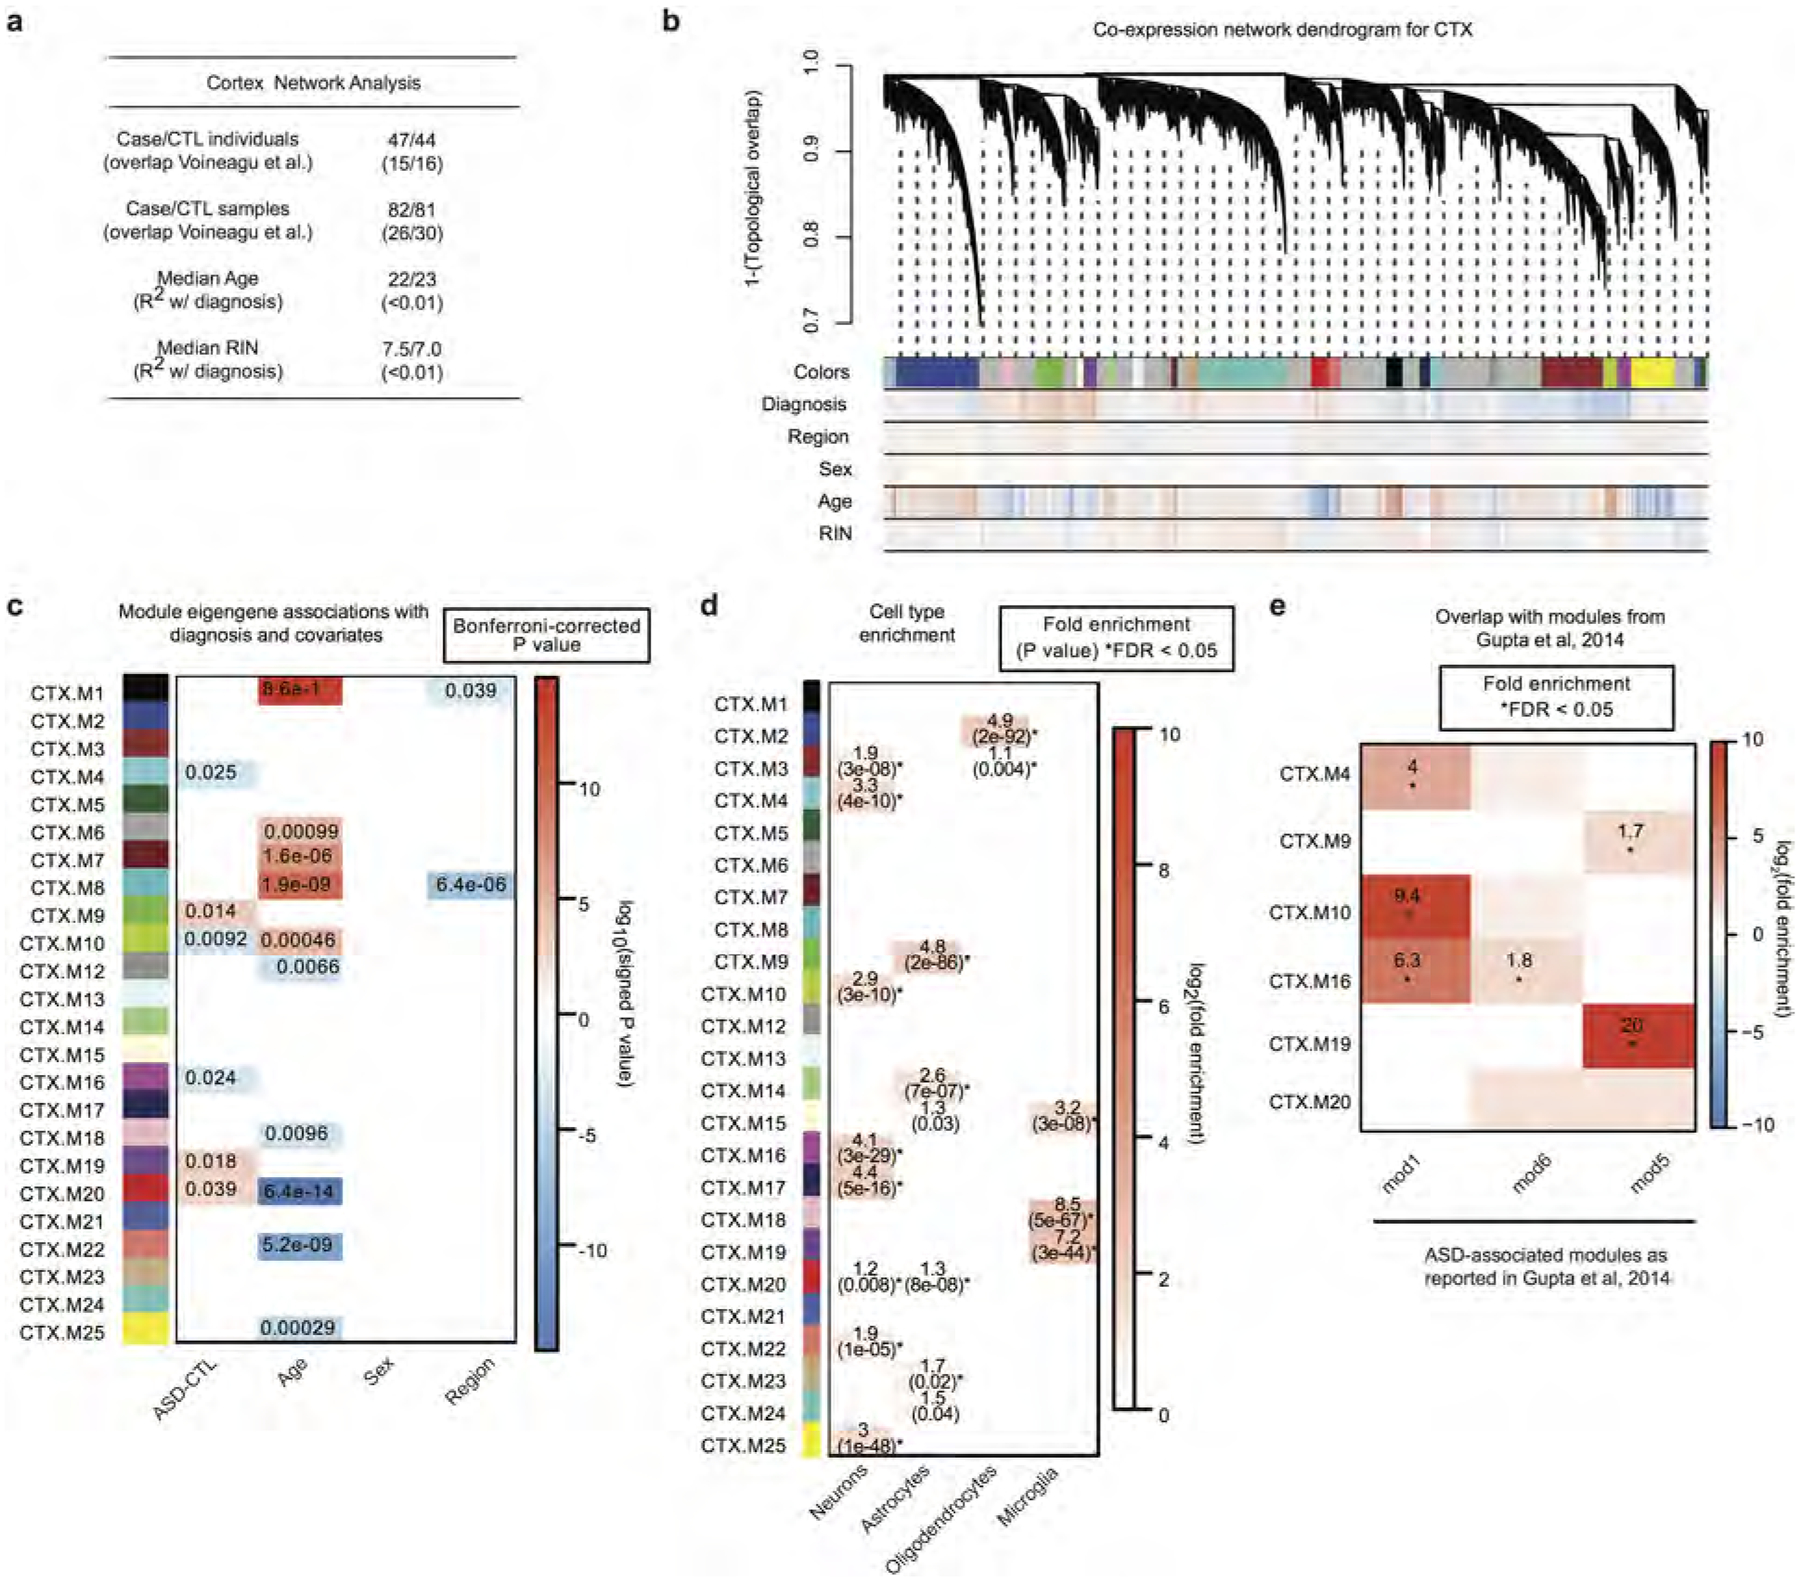
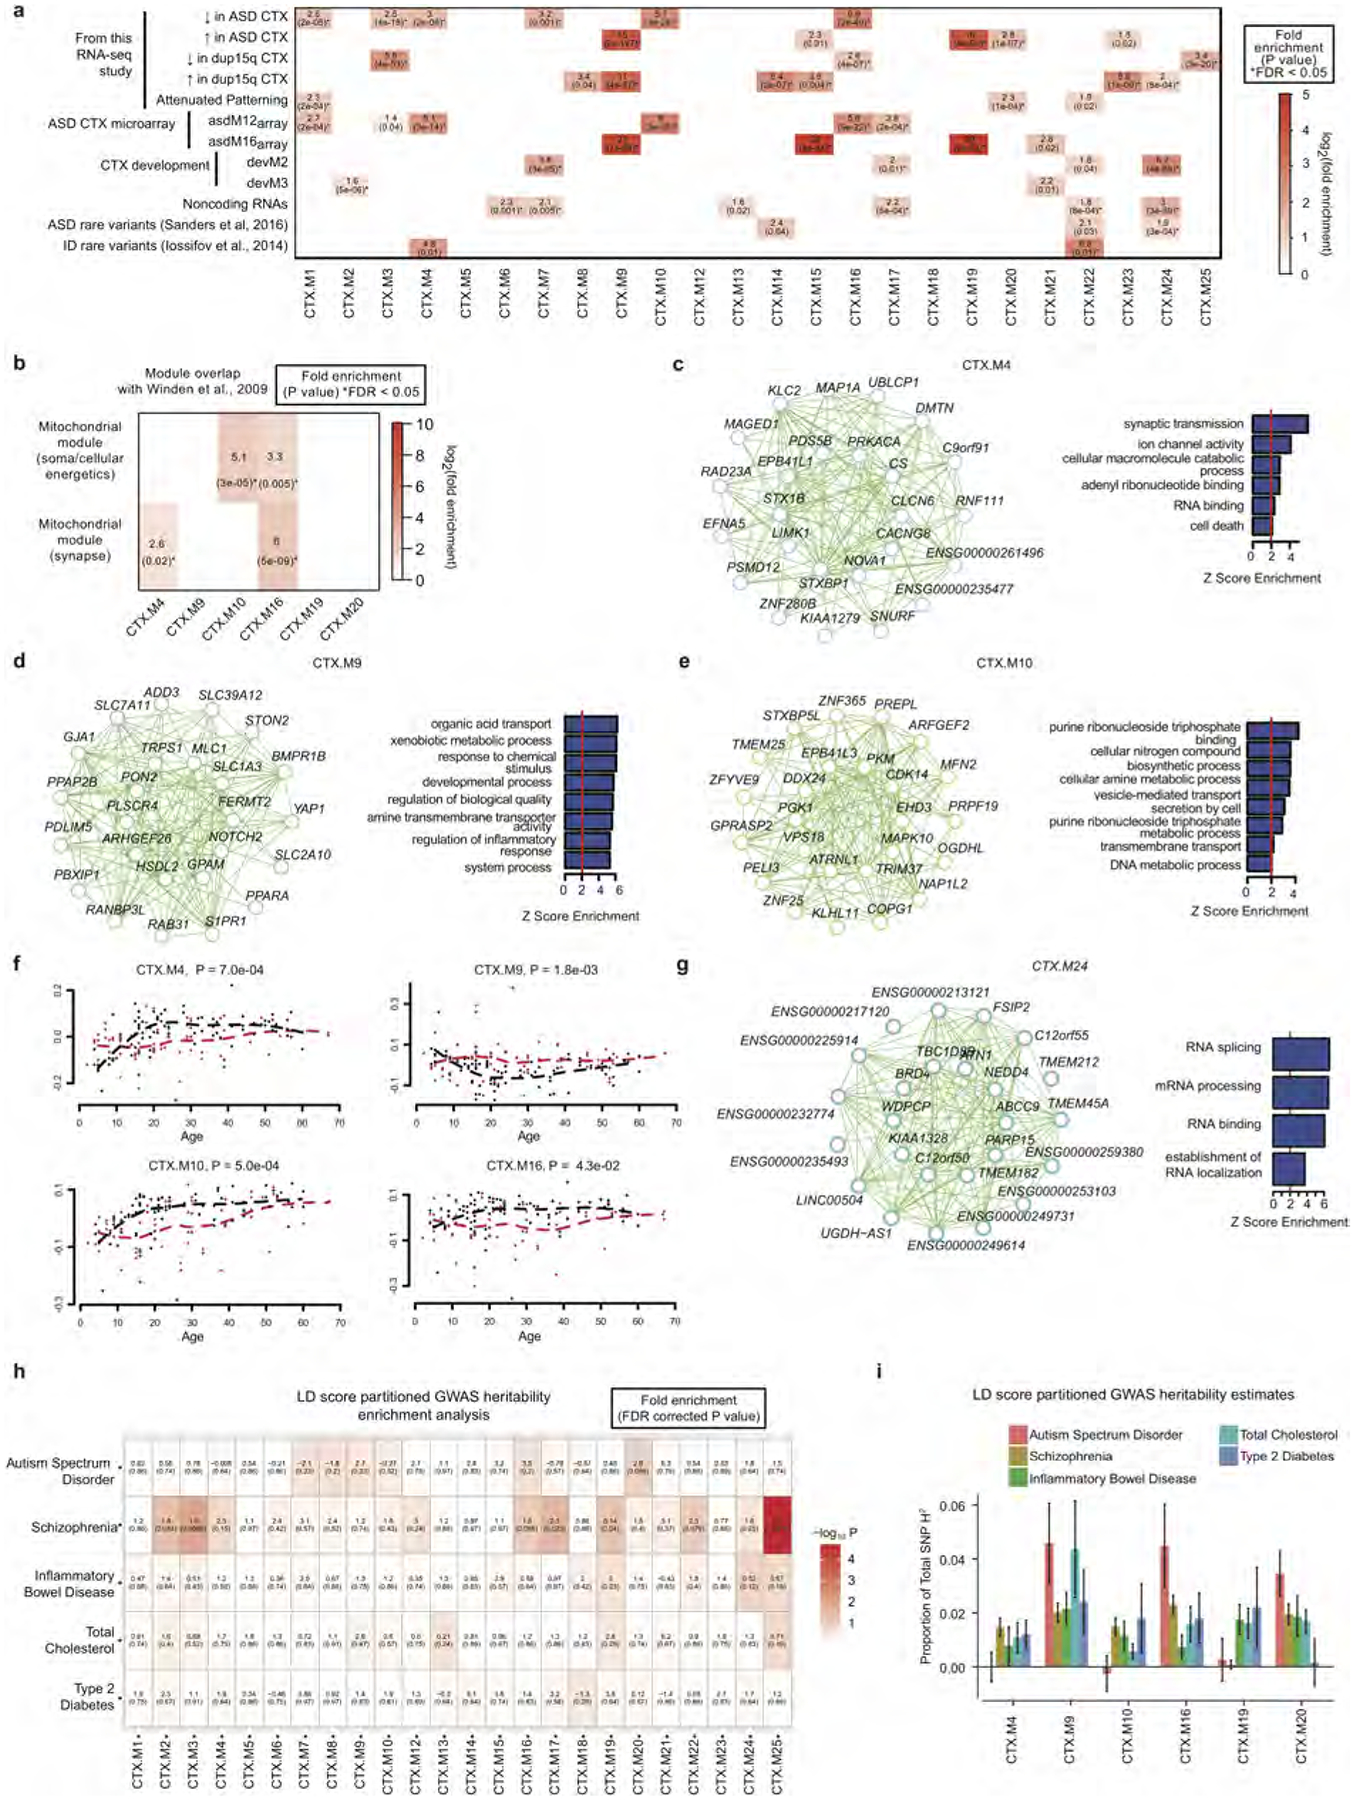
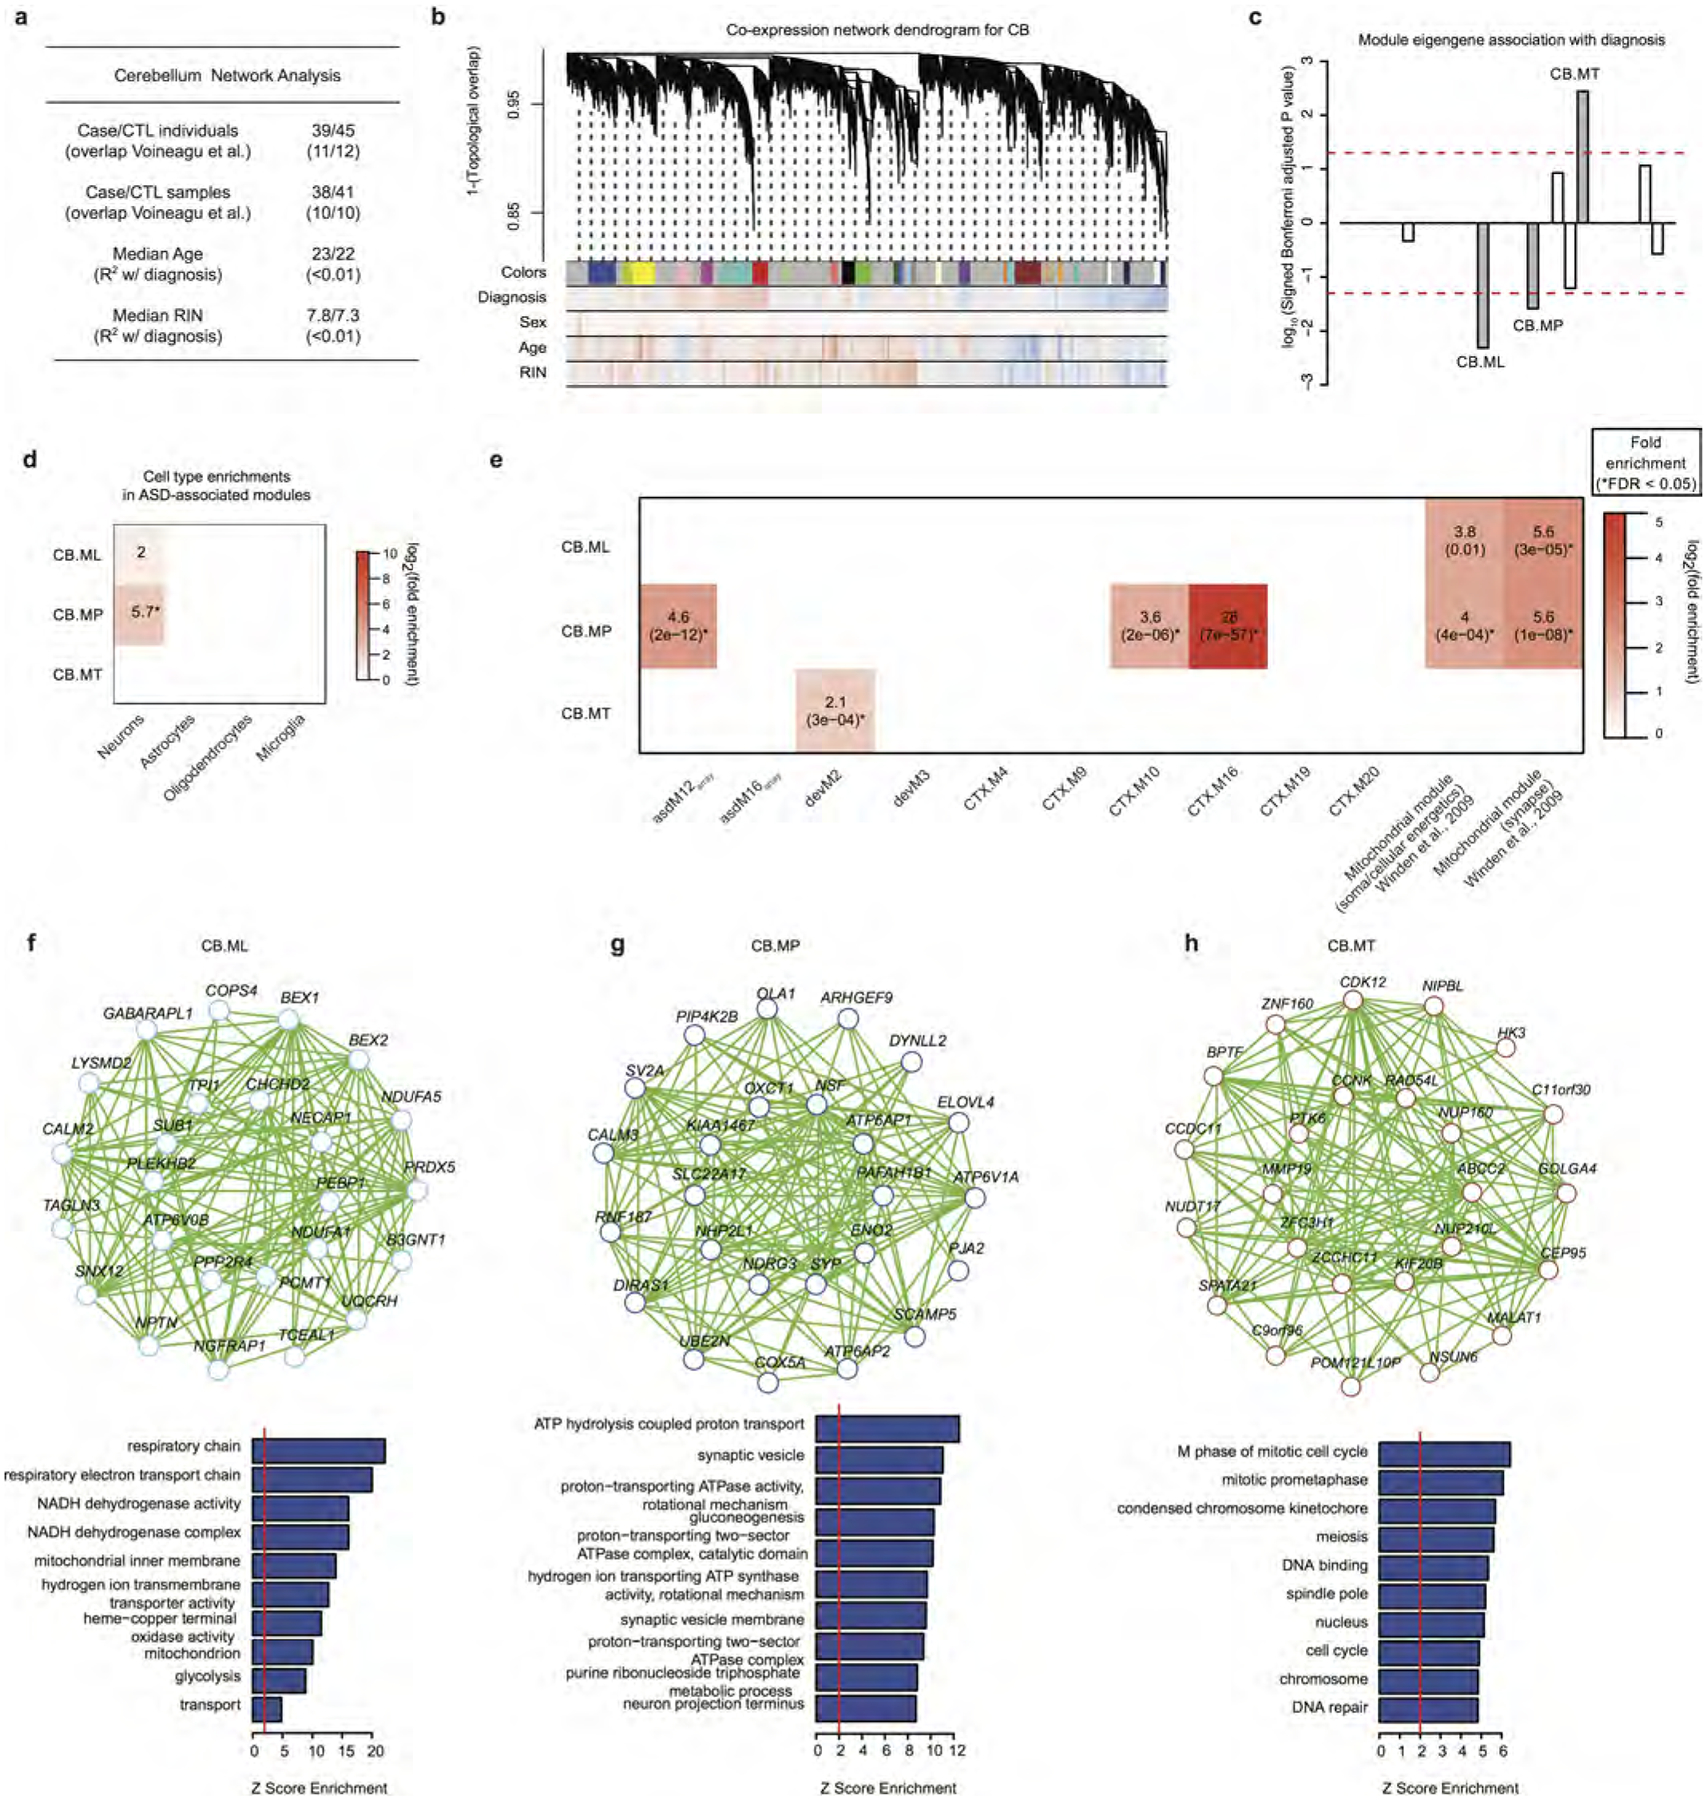
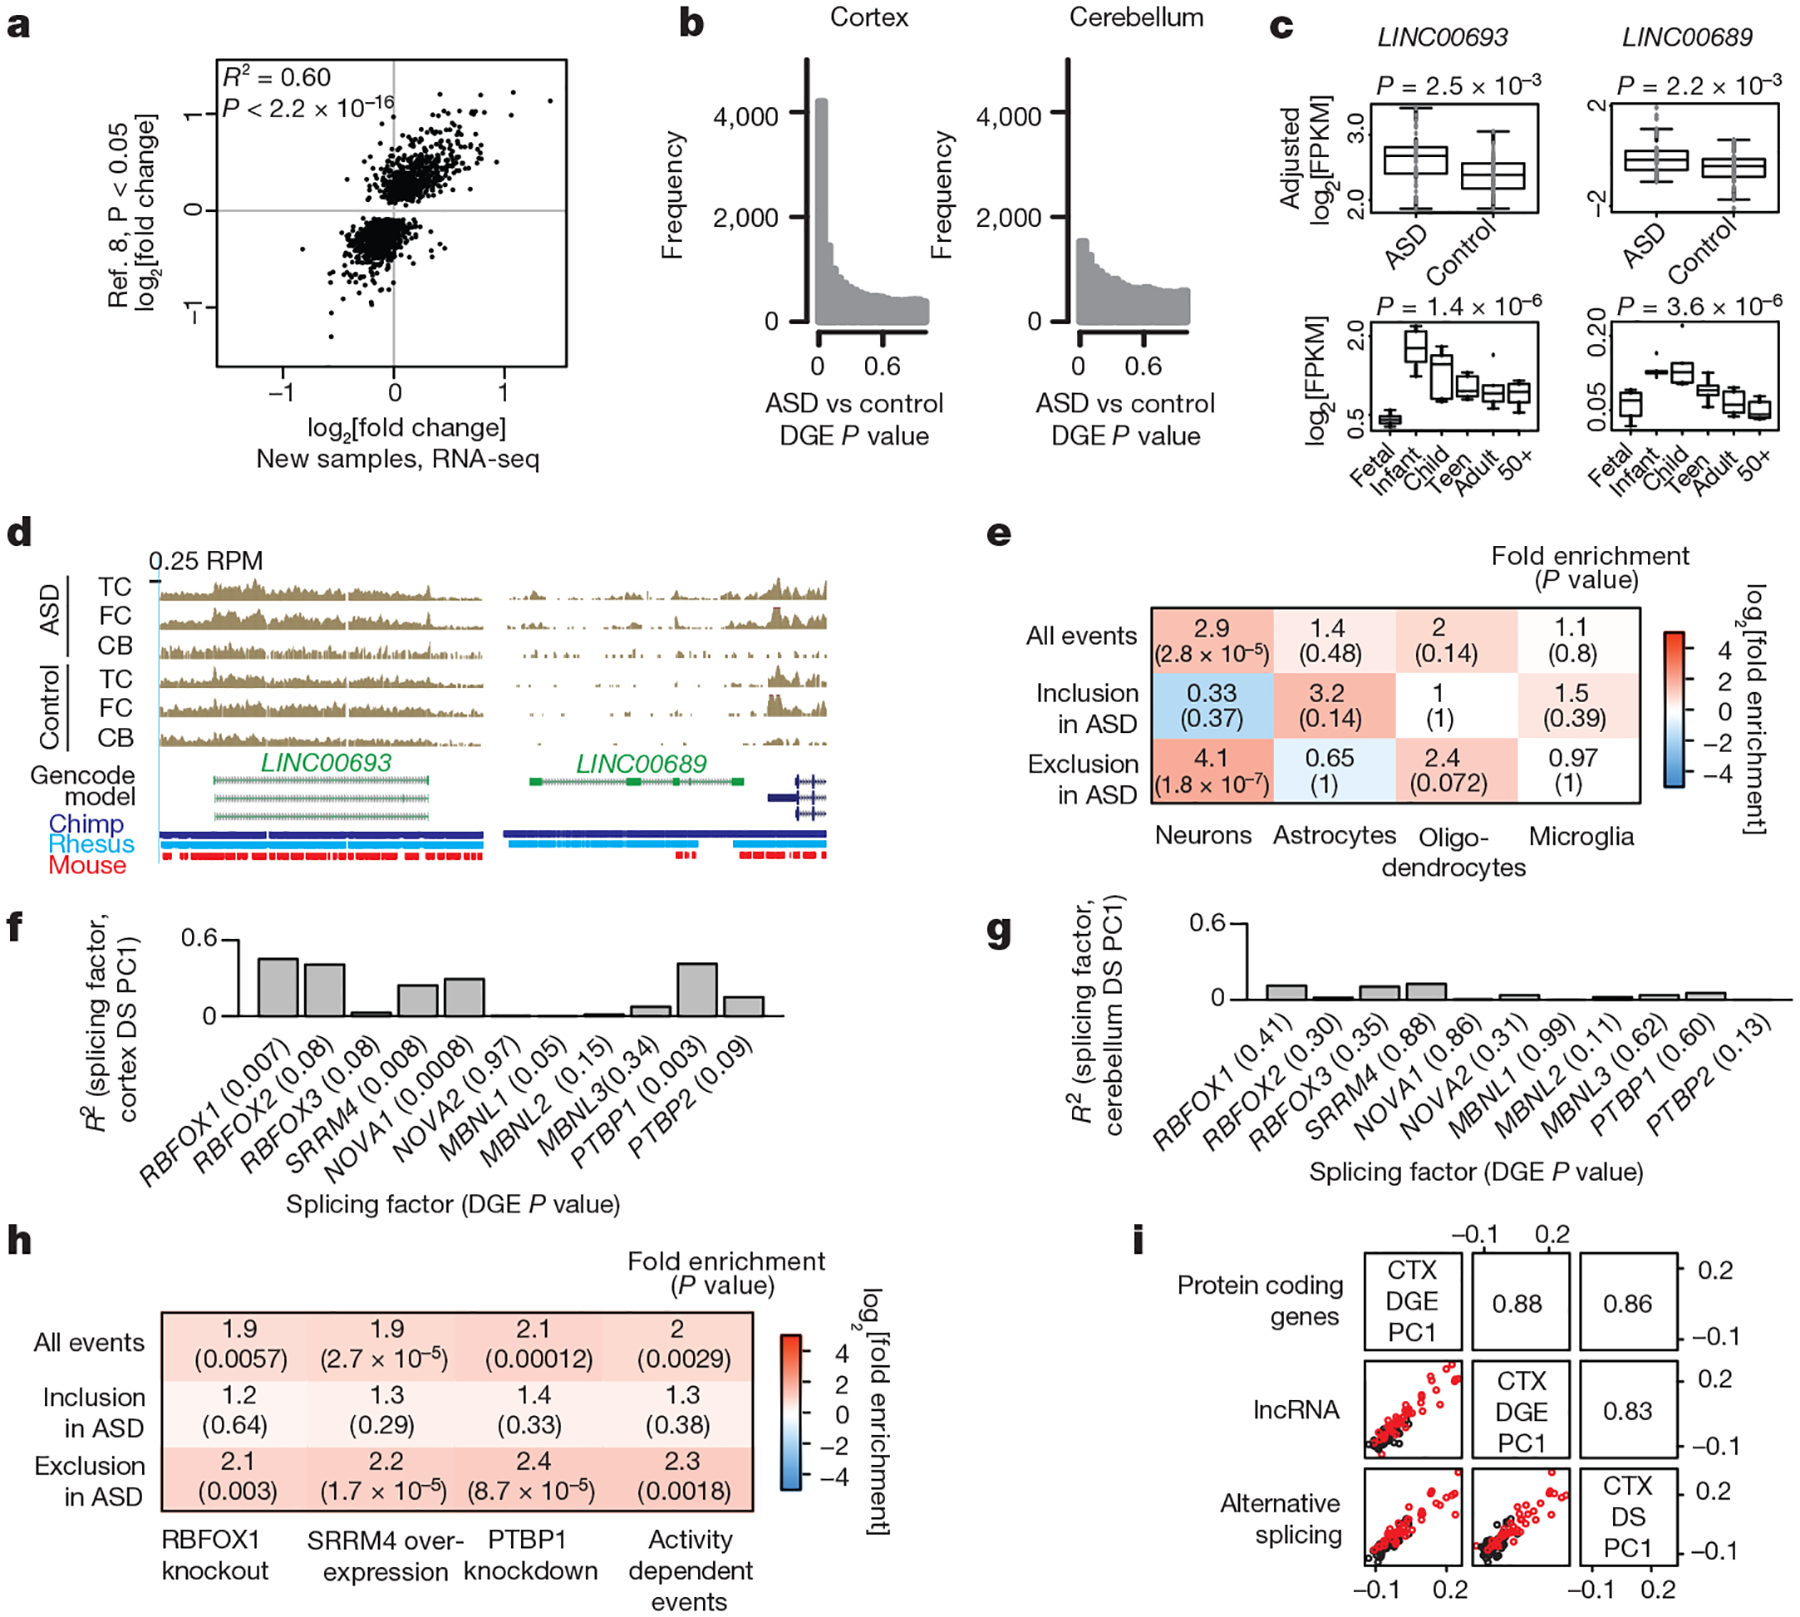
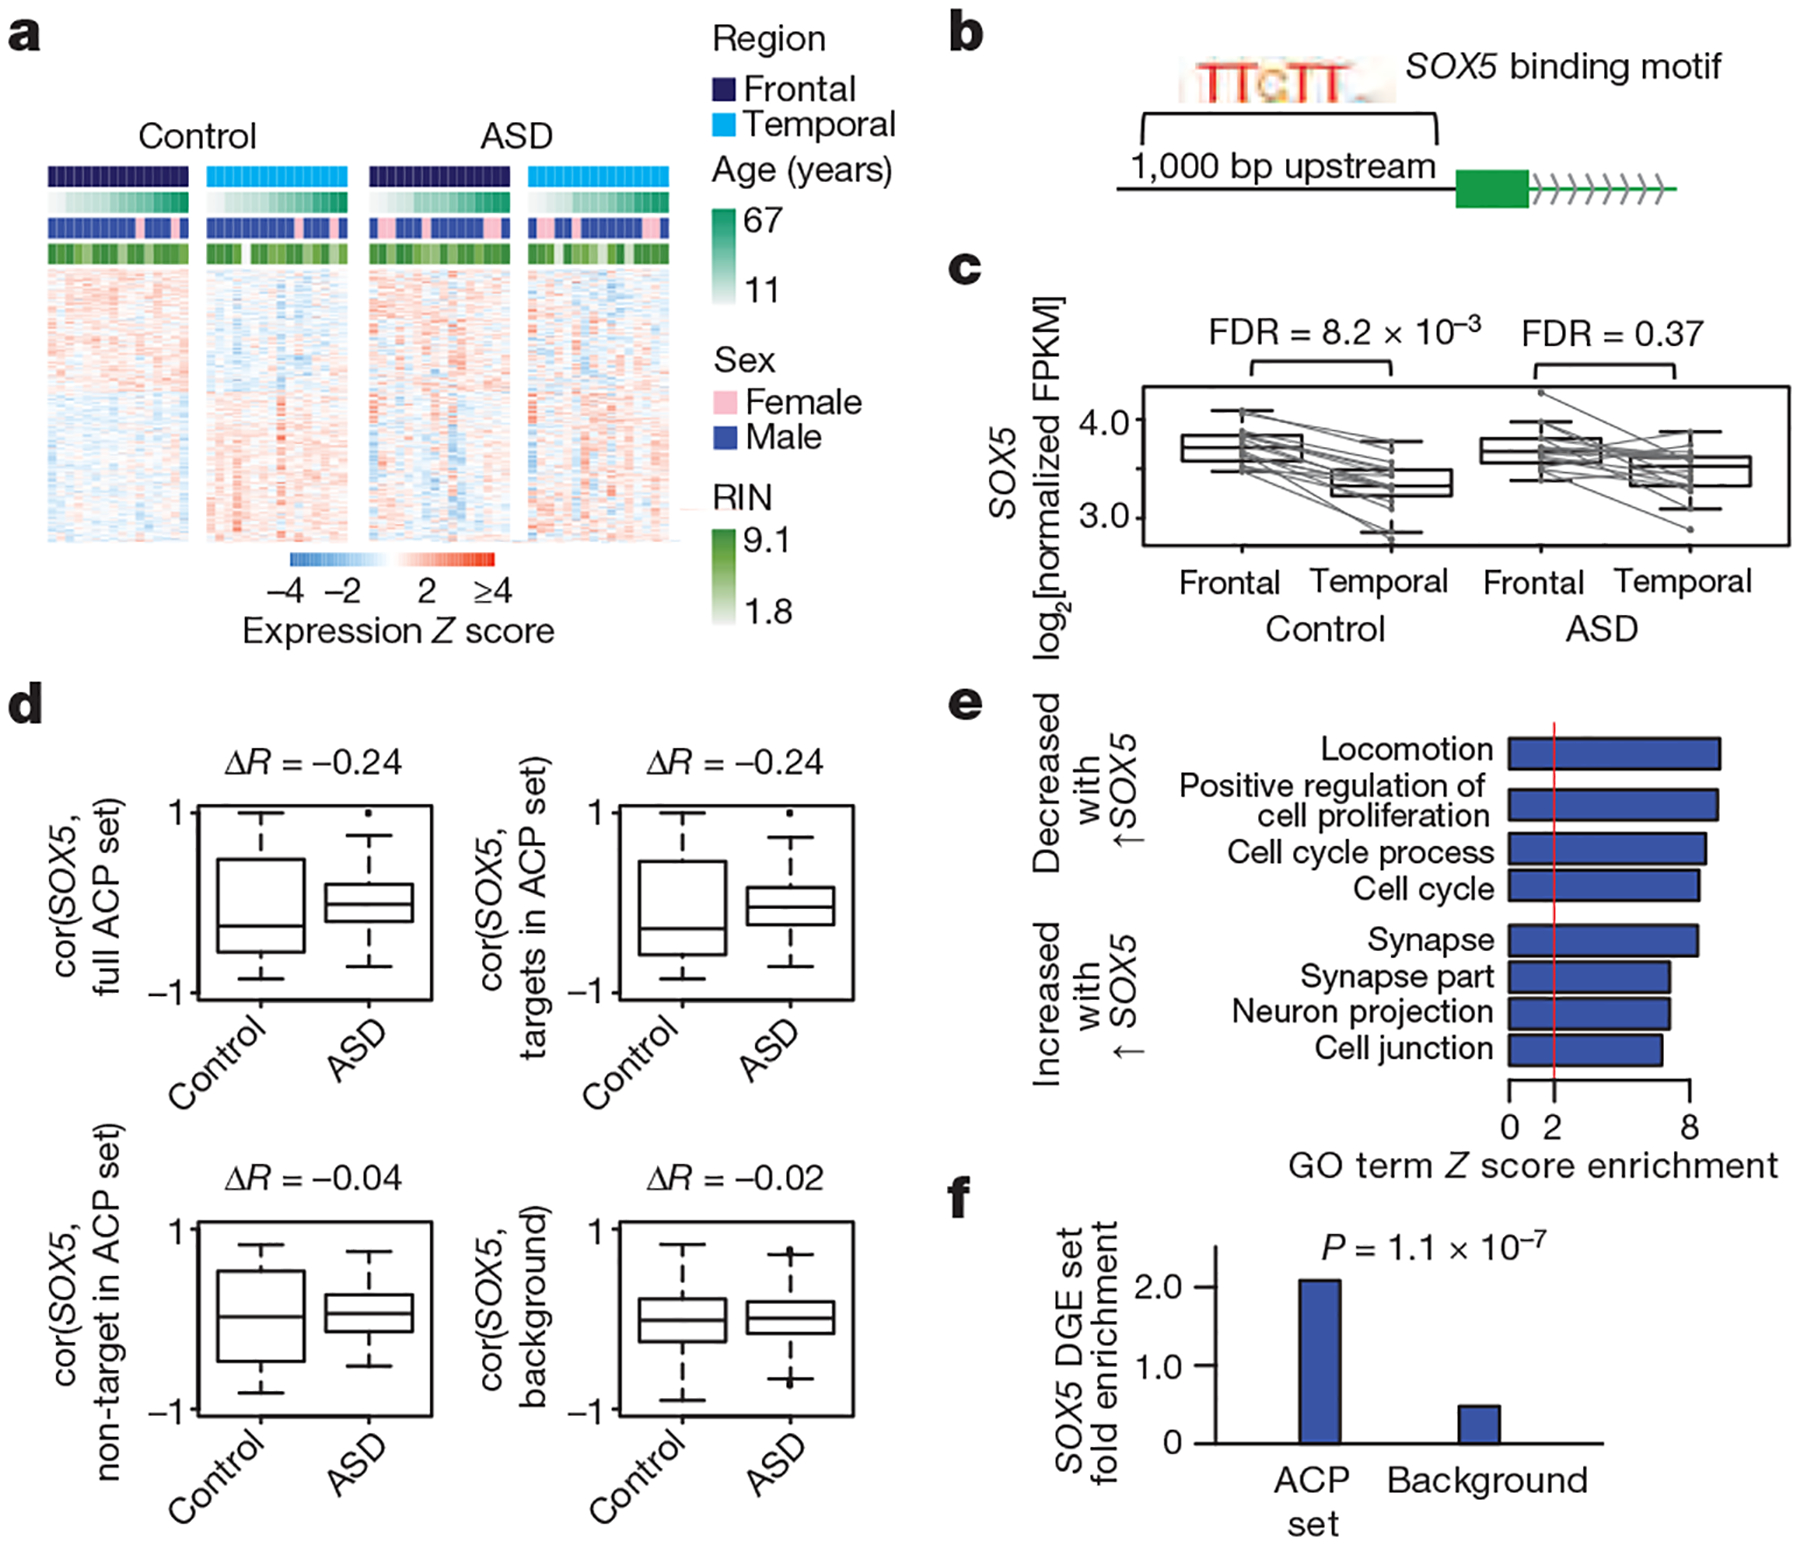
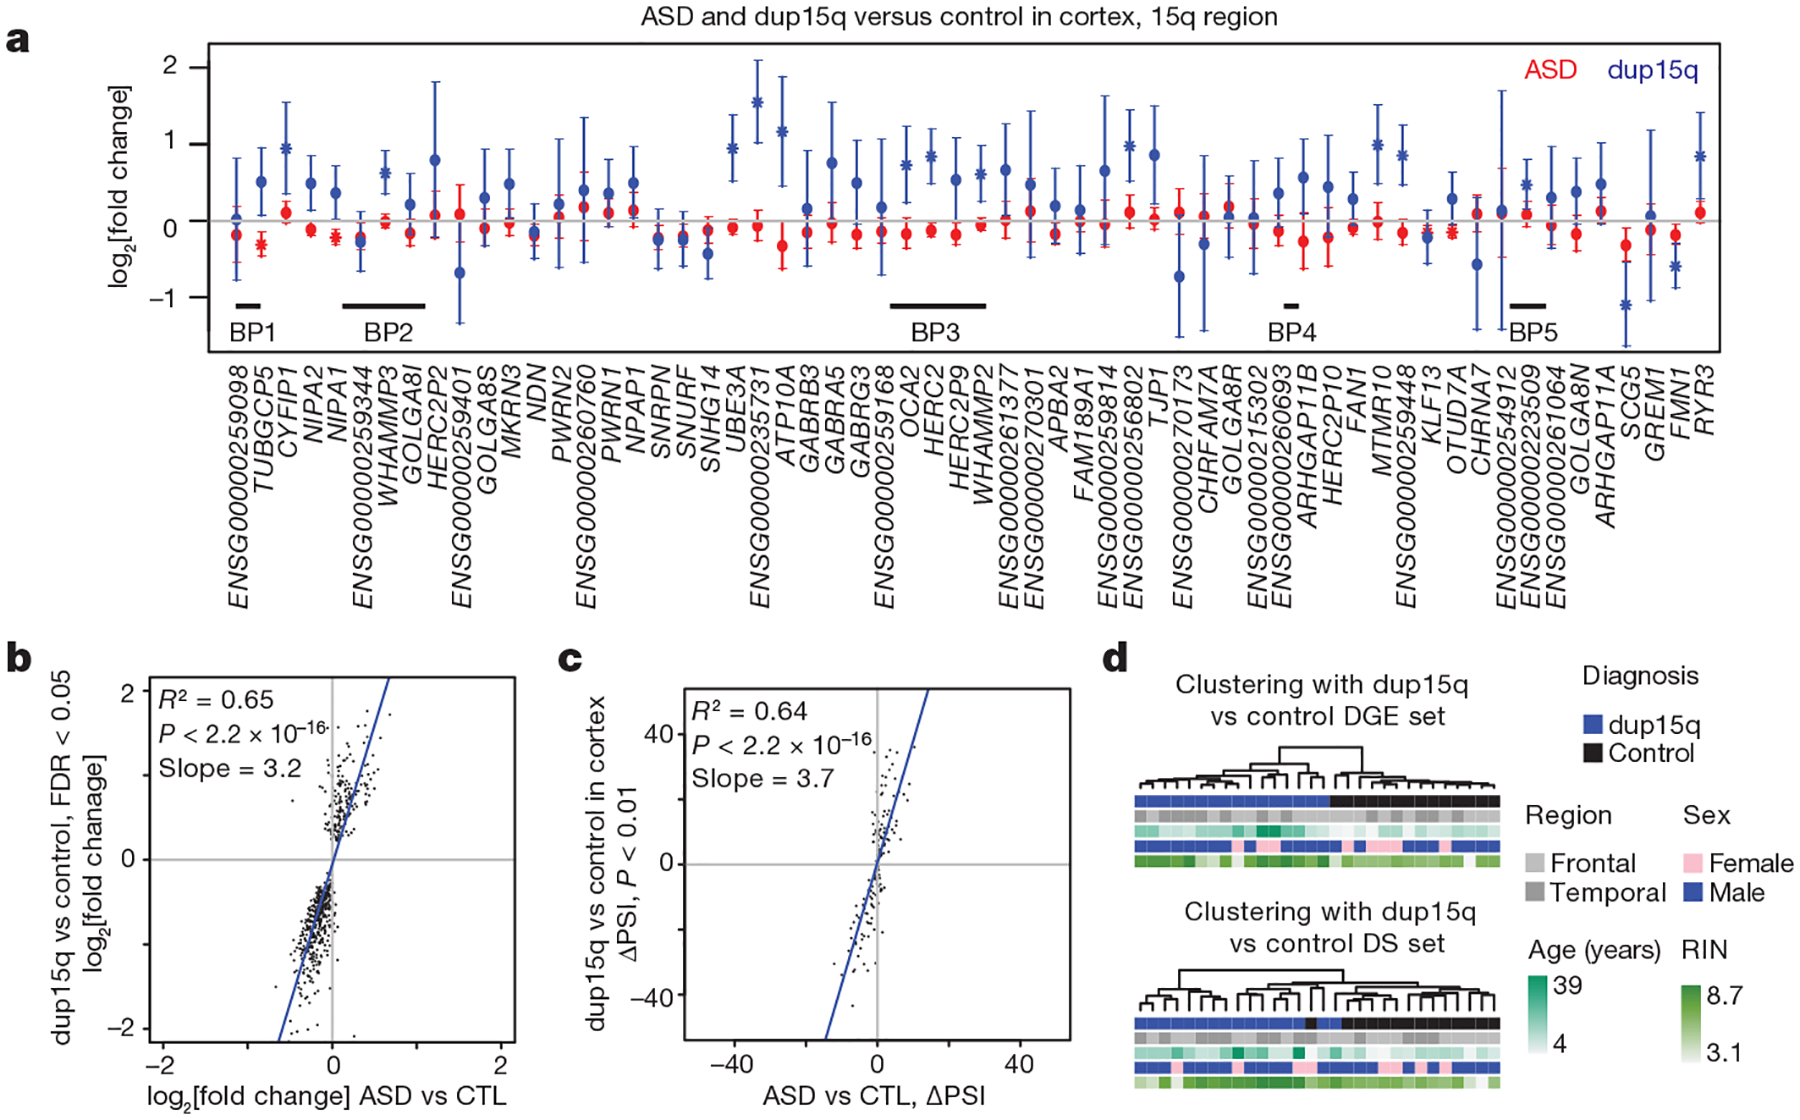
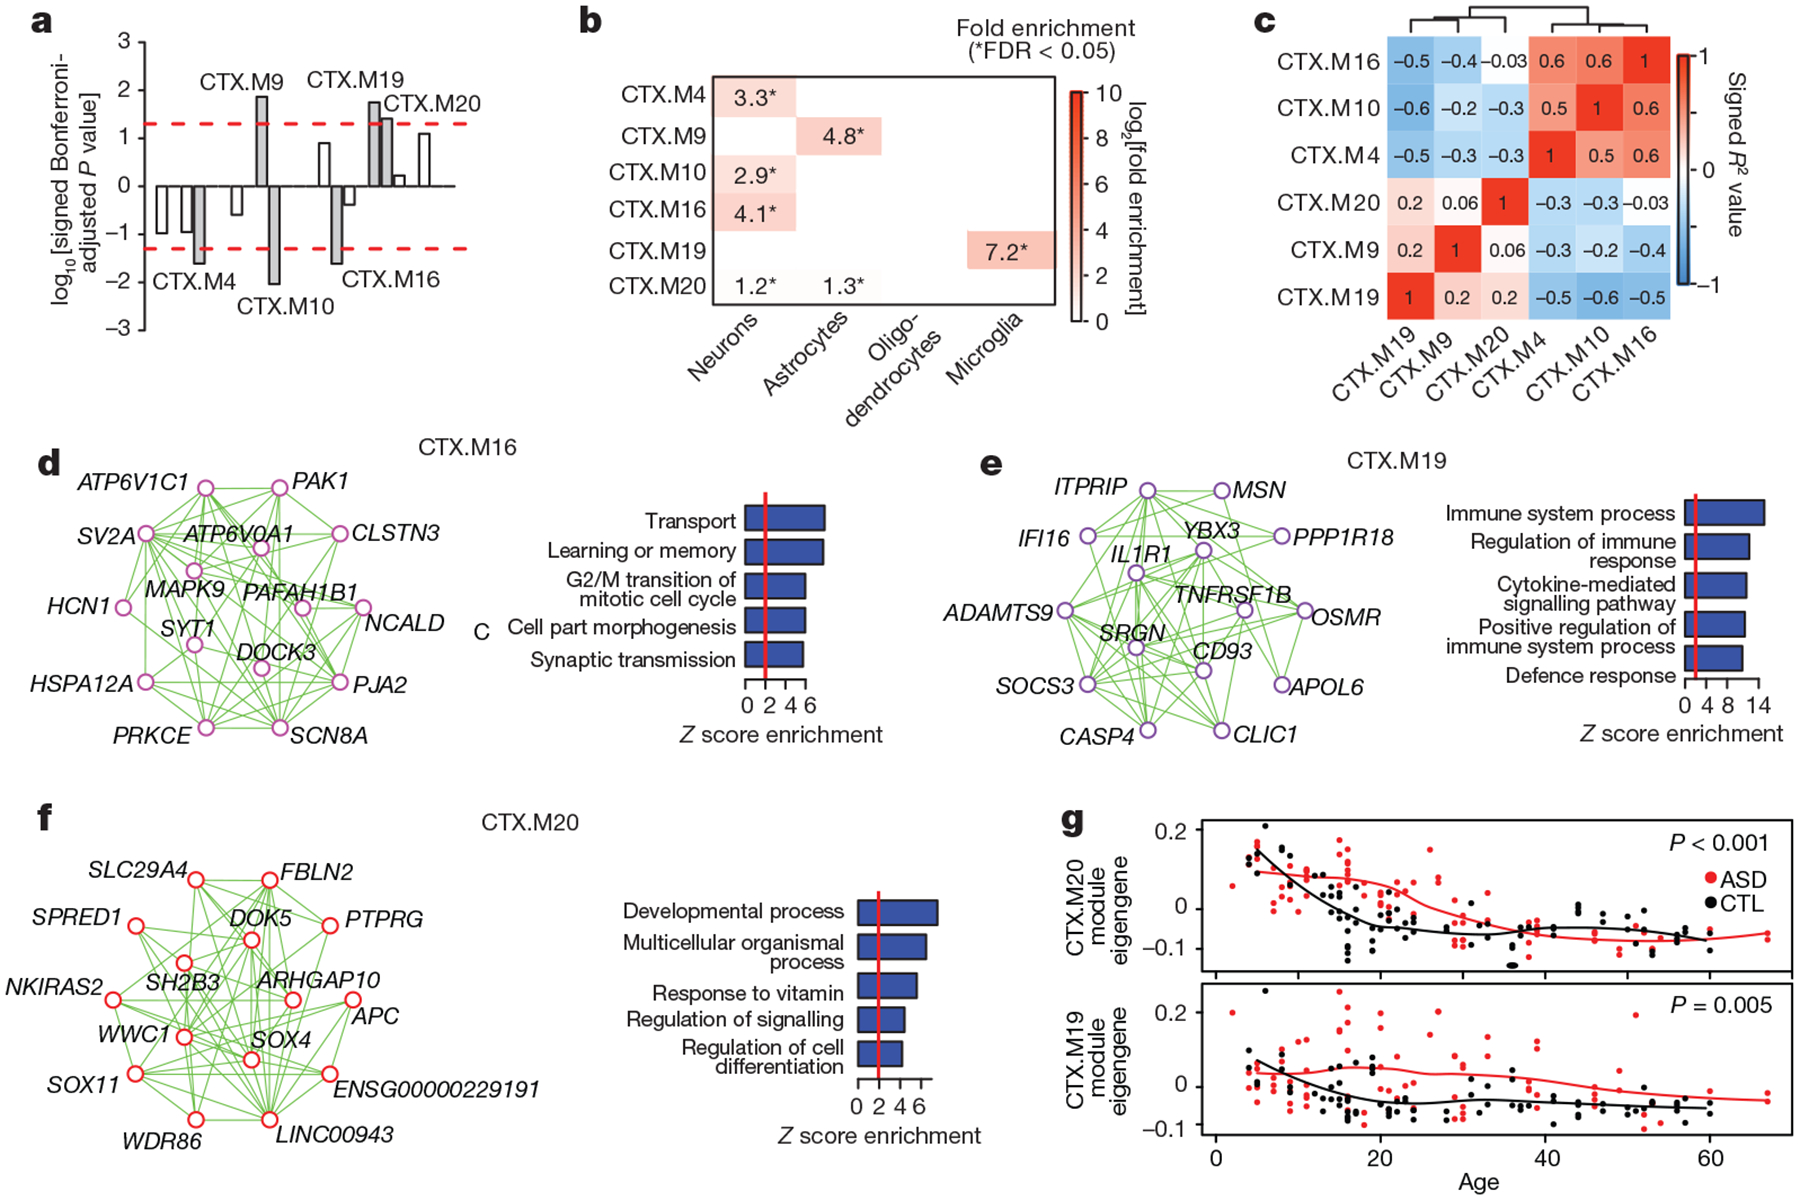
Autism spectrum disorder (ASD) involves substantial genetic contributions. These contributions are profoundly heterogeneous but may converge on common pathways that are not yet well understood. Here, through post-mortem genome-wide transcriptome analysis of the largest cohort of samples analysed so far, to our knowledge, we interrogate the noncoding transcriptome, alternative splicing, and upstream molecular regulators to broaden our understanding of molecular convergence in ASD. Our analysis reveals ASD-associated dysregulation of primate-specific long noncoding RNAs (lncRNAs), downregulation of the alternative splicing of activity-dependent neuron-specific exons, and attenuation of normal differences in gene expression between the frontal and temporal lobes. Our data suggest that SOX5, a transcription factor involved in neuron fate specification, contributes to this reduction in regional differences. We further demonstrate that a genetically defined subtype of ASD, chromosome 15q11.2-13.1 duplication syndrome (dup15q), shares the core transcriptomic signature observed in idiopathic ASD. Co-expression network analysis reveals that individuals with ASD show age-related changes in the trajectory of microglial and synaptic function over the first two decades, and suggests that genetic risk for ASD may influence changes in regional cortical gene expression. Our findings illustrate how diverse genetic perturbations can lead to phenotypic convergence at multiple biological levels in a complex neuropsychiatric disorder.


Conflict of interest statement

The authors declare competing financial interests: details are available in the online version of the paper. Readers are welcome to comment on the online version of the paper.

Figures

Extended Data Figure 1 |
Extended Data Figure 1 |. Methodology, quality control, and differential expression replication analysis.
a, RNA-seq workflow (see Supplementary Information for details). b, RNA-seq quality and alignment statistics from this study, including RNA integrity number (RIN), sequencing depth (aligned reads), proportion of reads mapping to different genomic regions, and bias in coverage from the 5′ to the 3′ ends of transcripts.c, RNA-seq read coverage relative to normalized gene length across transcript length across samples. d, Dependence between coverage and RIN across gene body. eg, Correlation of transcript model quantifications comparing the union exon model (used throughout this study), the whole gene model (which includes introns), and the Cufflinks approach to estimating FPKM. h, Summary table describing the characteristics of the matched covariate data used in the DGE and differential alternative splicing (DS) analysis of ASD in cortex and cerebellum. This includes the number of samples overlapping with our previous work, the age and RIN distributions, and the dependence between diagnosis and age and RIN (summarized from Supplementary Table 1). i, Independent replication of ASD versus control DGE fold changes between previously evaluated and new ASD samples in cortex by RNA-seq using samples from ref. (similar to Fig. 1a, but with RNA-seq in all samples). j, Correlation of P value rankings with Spearman’s correlation across different DGE methods for DGE analysis in cortex, comparing the ‘full model’ (LME P value) described in the Supplementary Information with other methods. Methods include removal of three additional principal components of sequencing surrogate variables(SVs) (LME with 5 SVs, top left), application of a permutation analysis for DGE P value computation (LME P, permuted, top right), application of variance-weighted linear regression for DGE (limma voom, middle left), application of surrogate variable analysis for DGE (full model + 17 SVs, middle right), and application of DESeq2 with the full model, which uses a negative binomial distribution (bottom left). k. Comparison of fold changes between frontal cortex (FC) and temporal cortex (TC) for all samples, demonstrating similar changes in both regions. l, Average linkage hierarchical clustering of samples in ASD cortex using the top 100 upregulated and top 100 downregulated protein coding genes, demonstrating that confounders do not drive clustering of about two-thirds of samples. m, The first principal component of the cortex DGE set is primarily associated with diagnosis, and not with other factors. The red line marks a Bonferroni-corrected P = 0.05.
Extended Data Figure 2 |
Extended Data Figure 2 |. Transcriptome-wide DGE analysis.
a, We applied a classification method robust to overfitting (elastic net model) by training on the RNA-seq data from samples previously analysed in ref. (Extended Data Fig. 1h, similar to the comparison in Extended Data Fig. 1i) and classifying ASD versus control status in independent samples. Results are shown as a comparison of classification scores (left) and area under the receiver operator characteristic curve (AUROC, right). Approximately 85% of ASD samples are classified successfully around a false positive rate of 20%. b, Summary table describing the subset of representative, covariate matched samples used for qRT–PCR validations. Supplementary Table 2 contains the underlying values. c, Fold changes from RNA-seq compared against fold changes from qRT–PCR (see Supplementary Table 2 for data). d, GO term enrichment analysis of genes that are upregulated or downregulated in individuals with ASD. e, Enrichment analysis of cell-type specific gene sets (defined as genes with fivefold higher expression in the cell type than in other cell types) with genes that are decreased or increased in ASD. f, g, Independent replication analysis of ASD versus control DGE fold changes between previously evaluated and new ASD samples from cerebellum by microarray and RNA-seq using samples from ref. (similar to Fig. 1a and Extended Data Fig. 1i). The RNA-seq data show a replication signal between previously evaluated and new samples from this study. h, Comparison of fold changes that were significant at FDR < 0.05 in the ASD versus control DGE analysis from cortex compared with fold changes observed in cerebellum, revealing strong concordance but a lower average fold change in the cerebellum. i, Sample summary and quality control (QC) statistics for ref. . Compare to Extended Data Fig. 1b and see Supplementary Information for additional discussion. Compared to this study, samples from ref. were prepared by poly(A) selection RNA-seq, exhibit lower RNA integrity number (RIN, median 4.8 versus 7.3), have lower median sequencing depth (11 million versus 40 million), exhibit greater 5′−3′ bias, and have generally greater variability across all QC metrics. j, Comparison of fold-changes for the top significant genes from ref. (P < 0.01 as provided in their Supplementary Information) with the fold changes for the same genes in this study. Co-expression network analysis demonstrated that the moderate agreement is largely driven by concordance in upregulation of microglial genes in both studies (Extended Data Fig. 8e). k, Average linkage hierarchical clustering of lncRNAs in the DGE set. l, Boxplots of expression values of DGE lncRNAs across multiple tissue types from the Illumina Body Map (expression data from ref. 12). Lines above the plot indicate pairwise significance with a one-sided Wilcoxon rank-sum test between brain and the other tissues. m, Similar to l, except for embryonic stem cells and stem-cell-derived cell types. n, RT–PCR validation of the two lncRNAs shown in Fig. 1c, d; P values computed by two-sided Wilcoxon rank-sum test.
Extended Data Figure 3 |
Extended Data Figure 3 |. RNA-seq gene expression on genome browser tracks for selected primate-specific lncRNAs in human, macaque and mouse.
For each lncRNA, expression for representative samples for ASD versus control (top) in human, macaque (middle), and mouse (bottom) are shown. The genome location for macaque and mouse displayed is syntenic to the human region, with the expected location of the lncRNA highlighted. ag, Examples of specific lncRNA transcripts that show primate-specific (in human and macaque, or only in human, but not in mouse) expression. h, Example of a strongly conserved lncRNA, which shows robust expression in all three species.
Extended Data Figure 4 |
Extended Data Figure 4 |. Splicing analyses and validation in ASD.
a, Schematic of the PSI metric used for differential alternative splicing. b, Distribution of LME model P values for changes in the PSI between ASD and control in cortex for all events and event subtypes. c, Distribution of LME model P values for changes in the PSI between ASD and control in cerebellum. d, Average linkage hierarchical clustering in ASD and control cortex samples using top 100 differentially included and top 100 differentially excluded exons from the differential splicing set. e, The first principal component of the cortex differential splicing set is strongly associated with diagnosis, but not other factors. Red line marks Bonferroni-corrected P = 0.05. f, Comparison of the cortex differential splicing with the pipeline used here (TopHat2 (ref. 43) followed by multivariate analysis of transcript splicing, MATS) with PSI values obtained via another method (read alignment by OLego followed by PSI quantification with Quantas). g, Comparison of ΔPSI values between RT–PCR and RNA-seq for nine splicing events (Supplementary Table 3). h, Differential splicing analysis identifies events independent of DGE signal. Top,difference between ASD and control in the differential splicing set based on PC1 of the differential splicing set at the PSI level, and PC1 of the gene expression levels of genes in the differential splicing set. Bottom, same comparison after removing nominally differentially expressed genes (P < 0.05). P values computed by two-sided Wilcoxon rank-sum test. i, GO term enrichment analysis of genes with differential splicing events in ASD. j, Clustering dendrogram and heat map for neuronal splicing factor gene expression levels across samples demonstrating three major clusters and the known positive correlation between SRRM4 and RBFOX1 and anticorrelation between PTBP1 and SRRM4 (refs 14,19).
Extended Data Figure 5 |
Extended Data Figure 5 |. Additional splicing analyses in ASD.
a, PCR validation and sashimi plots for nine splicing events delineated in Extended Data Fig. 4d, from the indicated samples (see Extended Data Fig. 2b for details of these samples). Notably, these genes are not in the DGE set, but are detected in the differential alternative splicing set owing to altered transcript structure. b, Heat map as in Fig. 1h for the splicing regulator ESRP. ESRP is not known to be involved in neuronal function, ESRP1 is not expressed in cortex, and ESRP2 is expressed but not significantly different between ASD and control cortex. Therefore, we show ESRP enrichment analysis in differential splicing events as a control for Fig. 1h. Enrichment P values are computed as described in Methods.
Extended Data Figure 6 |
Extended Data Figure 6 |. Attenuation of cortical patterning in ASD.
a, Histograms of P values from paired Wilcoxon rank-sum test differential gene expression between 16 frontal cortex (FC) and 16 temporal cortex (TC) samples from control and ASD individuals. b, Histogram of Bartlett’s test P values for differences in gene expression variance between ASD and control samples for all genes (white) and genes in the ACP set (red). The Kolmogorov–Smirnov (K–S) test P value for a difference between these two distributions is shown. c, Histograms of P values from unpaired Wilcoxon rank-sum test DGE between 21 frontal cortex and 22 temporal cortex samples after removing those used in ref. . d, Histogram of Bartlett’s test P values for differences in gene expression variance between ASD and control samples for all genes (white) and genes in the ACP set (red). The Kolmogorov–Smirnov test P value for a difference between these two distributions is reported. e, Approach to training the elastic net model on BrainSpan, frontal cortex and temporal cortex samples and application of the model to 123 cortical samples in this study. fh, Results of learned cortical region classifications with different starting gene sets, with the BrainSpan training set (left), control samples (middle) and ASD samples (right) in each panel and the Wilcoxon rank-sum test P value of frontal versus temporal cortex difference for each comparison. A1C, primary auditory cortex; DFC, dorsolateral prefrontal cortex; MFC, medial prefrontal cortex; STC, superior temporal cortex. i, Cell-type enrichment analysis for genes in the ACP set. j, GO term enrichment analysis of the ACP set. Enrichment P values are computed as described in Methods. k, Enrichment statistics for transcription factor motifs found to be significantly enriched in the ACP set (see Supplementary Information for details of P value computation). l, Average linkage hierarchical clustering of the global gene expression profiles for samples with overexpression of SOX5 and green fluorescent protein (GFP) tag overexpression (controls). m, Density plots of fold changes for the subset of ACP genes that are predicted SOX5 targets (top, green) and non-targets (bottom, green) against background (grey). The median log2[fold change] is marked (red line) and P values are from a one-sided Wilcoxon rank-sum test.
Extended Data Figure 7 |
Extended Data Figure 7 |. Duplication 15q syndrome analyses.
a, Copy number between breakpoints in the 15q region. Genome-wide copy number analysis allowed evaluation of copy number in additional regions from previous studies. b, Sample characteristics for the dup15q analyses (additional details available in Supplementary Table 1). c, Similar to Fig. 3b, but focusing on the lncRNAs found to be significantly differentially expressed in idiopathic ASD compared to control subjects. d, Comparison of DGE fold changes demonstrating that using different control samples (control samples used in the idiopathic analysis, column 2 of Extended Data Fig. 7b) for the dup15q cortex analysis yields similar findings. e, Similar to d except for the differential alternative splicing analysis. f, Comparison of heterogeneity in the DGE signal using the first principal component of the ASD cortex DGE set across all cortical samples used in DGE analyses. Samples from individuals with diagnoses confirmed by dup15q mutations, confirmed by Autism Diagnostic Interview-Revised (ADI-R), and supported by clinical records are all significantly different from controls by two-sided pairwise Wilcoxon rank sum tests. g, Similar to Fig. 3d, but with the larger set of controls from the idiopathic ASD versus control analysis in Fig. 1. h, i, P value distributions for DGE changes outside the 15q region for cortex and cerebellum. j, Similar to Fig. 3a, but for the cerebellum analysis. k, Comparison of significant DGE changes in the duplicated region from cortex with changes in cerebellum. l, Comparison of significant DGE changes outside of the dup15q region in cortex with changes in cerebellum. Scatter plot P values correspond to the statistical significance of the Pearson correlation coefficient between fold changes (see Methods).
Extended Data Figure 8 |
Extended Data Figure 8 |. Cortex co-expression network analyses.
a, Sample characteristics for the cortex network analyses; additional details available in Supplementary Table 1. b, Average linkage hierarchical clustering using the topological overlap metric for co-expression dissimilarity. Modules are identified from this dendrogram, which was constructed from a consensus of 100 bootstrapped datasets, (see Methods). Correlations for each gene to covariates are delineated below the dendrogram (blue, negative; red, positive). Modules are labelled with colours and numerical labels (see Supplementary Table 4 for additional details). CTX.M11 is a module of genes that are not co-expressed (grey module) and was not evaluated in further comparisons. c, Module-trait associations as computed by an LME model with all factors on the x axis used as covariates. Technical covariates were removed as part of adjusting the FPKM values. All P values are displayed where the association passed Bonferroni-corrected P < 0.05. d, Module enrichments for cell-type specific gene expression patterns. Asterisks indicate FDR < 0.05 across all comparisons. e, Enrichment of ASD-associated modules with that from ref. . * FDR < 0.05 (see Supplementary Table 4 for details).
Extended Data Figure 9 |
Extended Data Figure 9 |. Additional figures for cortex co-expression network analyses.
a, Gene set enrichment analyses comparing the 24 cortex co-expression modules with multiple gene sets from this RNA-seq study, post-mortem ASD cortex microarray, human cortical development, the set of all brain-expressed lncRNAs, genes enriched for ASD-associated rare variants, and genes with de novo variants associated with intellectual disability (ID). Boxes are filled if the odds ratio is greater than 0 and the enrichment P < 0.05. * FDR < 0.05 across all comparisons, controlling for gene length and expression level with logistic regression (Supplementary Information). b, Overlap of gene sets between firing-rate and mitochondrial associated modules from ref. with ASD-associated modules in cortex. ce, Module plot of ASD-associated modules not shown in Fig. 4 (CTX.M4, CTX.M9, CTX.M10) displaying the top hub genes along with the module’s GO term enrichment. f, Temporal trajectories for four module eigengenes (CTX.M4, CTX.M9, CTX.M10, CTX.M16) associated with ASD, similar to Fig. 4g. ASD samples are represented by red points and lines, control samples by black. g, Module plot and GO term enrichment for CTX.M24, which is enriched in ASD-associated rare variants and lncRNAs. h, Common variant enrichment across modules as calculated by GWAS enrichment with LD score regression, (see Methods). Disease GWAS studies evaluated include ASD, schizophrenia, inflammatory bowel disease, type 2 diabetes mellitus and serum lipid levels. P values are FDR corrected across all GWAS studies and modules. i, Plot of the proportion of SNP heritability across diseases for ASD-associated modules. Error bars represent s.e.
Extended Data Figure 10 |
Extended Data Figure 10 |. Cerebellum co-expression network analyses.
a, Sample characteristics for the cerebellum network analyses; additional details available in Supplementary Table 1. b, Modules identified from a dendrogram constructed from a consensus of 100 bootstrapped networks (see Methods). Correlations for each gene to each measured factor are delineated below the dendrogram (blue, negative; red, positive). Modules are labelled alphabetically instead of numerically to distinguish them from the cortex modules. Additional information is available in Supplementary Table 4. c, Signed association of module eigengenes with diagnosis; positive values indicate modules with increased expression in ASD samples. Grey bars with labels signify three ASD-associated modules. d, Cell-type enrichments for the three ASD-associated modules. e, Gene set enrichment analyses comparing the three ASD-associated cerebellum modules with post-mortem ASD cortex microarray, human brain development, six cortex ASD-associated modules from this RNA-seq study, and firing rate and mitochondrial associated modules from ref. . Boxes are filled if the odds ratio is greater than 0 and the enrichment P < 0.05. * FDR < 0.05 across all comparisons. fh, Module plots of CB.ML, CB.MP, and CB.MT displaying the top hub genes along with the GO term enrichment. Additional details, including module preservation statistics for cerebellum in cortex and vice versa, are available in Supplementary Table 4.
Figure 1 |
Figure 1 |. Transcriptome-wide differential gene expression and alternative splicing in ASD.
a, Replication of DGE between ASD and control cortex from previously analysed samples (16 ASD and 16 control on microarray) with new age- and sex-matched cortex samples (15 ASD and 17 control). b, P value distribution of the linear mixed effect (LME) model DGE results for cortex and cerebellum. c, LINC00693 and LINC00689 are upregulated in ASD and downregulated during cortical development (developmental expression data from ref. 12). Two-sided ASD–control P values are computed by the LME model, developmental P values are computed by analysis of variance (ANOVA). FPKM, fragments per kilobase million mapped reads. d, UCSC genome browser track displaying reads per million (RPM) in ASD and control samples along with sequence conservation for LINC00693 and LINC00689. e, Cell-type enrichment analysis of differential alternative splicing events from cortex using exons with ΔPSI (per cent spliced in) > 50% in each cell type compared to the others. f, g, Correlation between the first principal component (PC1) of the cortex differential splicing (DS) set and gene expression of neuronal splicing factors in cortex (f) and cerebellum (g) (DGE P value in parentheses). h, Enrichment among ASD differential splicing events and events regulated by splicing factors and neuronal activity (see Methods). i, Correlations between the PC1 across the ASD versus control analyses for different transcriptome subcategories. Bottom left: scatterplots of the principal components for ASD (red) and control (black) individuals. Top right: pairwise correlation values between principal components.
Figure 2 |
Figure 2 |. Attenuation of cortical patterning in ASD.
a, Heat map of genes exhibiting DGE between frontal and temporal cortex at FDR < 0.05. In control cortex and ASD cortex, 551 genes and 51 genes, respectively, show DGE in in frontal versus temporal cortex. The ACP set is defined as the 523 genes that show DGE between regions in control but not ASD samples. RIN, RNA integrity number. b, Schematic of transcription factor motif enrichment upstream of genes in the ACP set. c, SOX5 exhibits attenuated cortical patterning in ASD (lines: frontal–temporal pairs from the same individual). d, Correlation between SOX5 expression and predicted targets in control and ASD samples for all ACP genes (top left), SOX5 targets from the ACP set (top right), SOX5 non-targets from the ACP set (bottom left), and background (all other genes, bottom right). Plots show the distribution of Pearson correlation values between SOX5 and other genes in ASD and control samples. ΔR, change in median R value between distributions. e, Gene Ontology (GO) term enrichment for genes upregulated and downregulated after SOX5 overexpression in neural progenitor cells. f, Enrichment analysis of the SOX5 differential gene expression (DGE) set in the ACP set and all other genes (background). P represents significance in enrichment over background by two-sided Fisher’s exact test.
Figure 3 |
Figure 3 |. Duplication 15q syndrome recapitulates transcriptomic changes in idiopathic ASD.
a, DGE changes across the 15q11–13.2 region for ASD and dup15q compared to control. Error bars show 95% confidence intervals for the fold changes. * FDR < 0.05 across this region. BP, breakpoint. b, Comparison of DGE effect sizes in dup15q versus control and ASD versus control. c, Comparison of differential alternative splicing effect sizes in dup15q versus control and ASD versus control. d, Average linkage hierarchical clustering of dup15q samples and controls using the DGE and differential alternative splicing (DS) gene sets.
Figure 4 |
Figure 4 |. Co-expression network analysis.
a, Signed association of module eigengenes with diagnosis (Bonferroni-corrected P value from an LME model, see Extended Data Fig. 8c and Methods). Positive values indicate modules with an increased expression in ASD samples. Grey bars with labels signify six ASD-associated modules. b, Cell-type enrichment for the ASD-associated modules. c, Heat map of correlations between ASD-associated module eigengenes sorted by average linkage hierarchical clustering. df, Module plots displaying the top 15 hub genes and top 50 connections along with the GO term enrichment of each module. g, Plot of CTX.M20 and CTX.M19 module eigengenes across age. P values are for the difference between temporal trajectories for ASD and control by permutation test (see Methods).

Comment in

References

    1. Gaugler T et al. Most genetic risk for autism resides with common variation. Nat. Genet 46, 881–885 (2014). - PMC - PubMed
    1. Gratten J, Visscher PM, Mowry BJ & Wray NR Interpreting the role of de novo protein-coding mutations in neuropsychiatric disease. Nat. Genet 45, 234–238 (2013). - PubMed
    1. de la Torre-Ubieta L, Won H, Stein JL & Geschwind DH Advancing the understanding of autism disease mechanisms through genetics. Nat. Med 22, 345–361 (2016). - PMC - PubMed
    1. Gupta S et al. Transcriptome analysis reveals dysregulation of innate immune response genes and neuronal activity-dependent genes in autism. Nat. Commun 5, 5748 (2014). - PMC - PubMed
    1. Garbett K et al. Immune transcriptome alterations in the temporal cortex of subjects with autism. Neurobiol. Dis 30, 303–311 (2008). - PMC - PubMed

Publication types

MeSH terms

Supplementary concepts