Comparative Study
. 2016 Nov 3;13(1):58.
doi: 10.1186/s12989-016-0171-3.

Air-liquid interface exposure to aerosols of poorly soluble nanomaterials induces different biological activation levels compared to exposure to suspensions

Affiliations
Comparative Study

Air-liquid interface exposure to aerosols of poorly soluble nanomaterials induces different biological activation levels compared to exposure to suspensions

Thomas Loret et al. Part Fibre Toxicol. .

Abstract

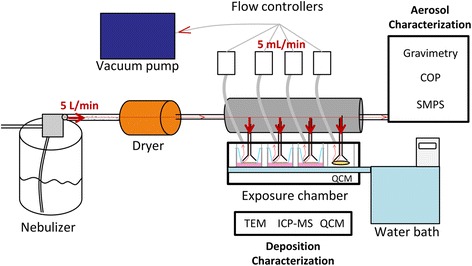
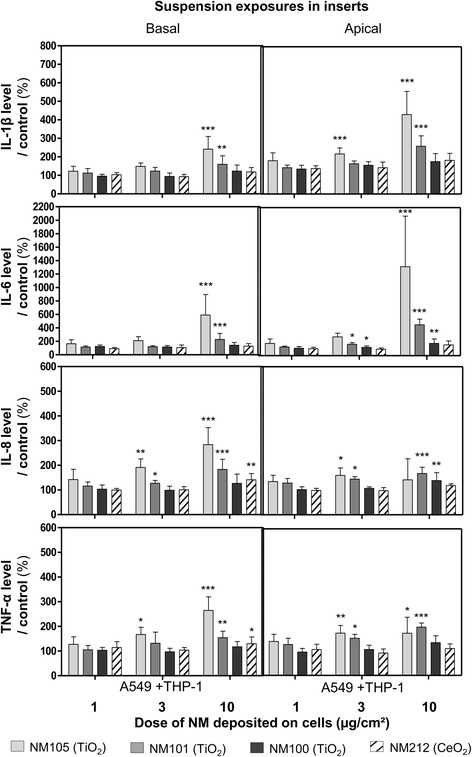
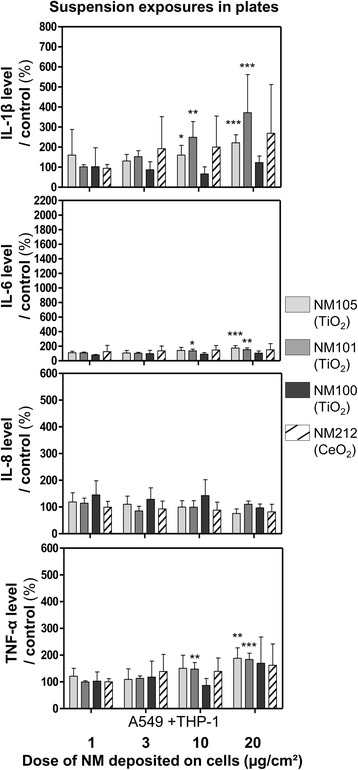
Background: Recently, much progress has been made to develop more physiologic in vitro models of the respiratory system and improve in vitro simulation of particle exposure through inhalation. Nevertheless, the field of nanotoxicology still suffers from a lack of relevant in vitro models and exposure methods to predict accurately the effects observed in vivo, especially after respiratory exposure. In this context, the aim of our study was to evaluate if exposing pulmonary cells at the air-liquid interface to aerosols of inhalable and poorly soluble nanomaterials generates different toxicity patterns and/or biological activation levels compared to classic submerged exposures to suspensions. Three nano-TiO2 and one nano-CeO2 were used. An exposure system was set up using VitroCell® devices to expose pulmonary cells at the air-liquid interface to aerosols. A549 alveolar cells in monocultures or in co-cultures with THP-1 macrophages were exposed to aerosols in inserts or to suspensions in inserts and in plates. Submerged exposures in inserts were performed, using similar culture conditions and exposure kinetics to the air-liquid interface, to provide accurate comparisons between the methods. Exposure in plates using classical culture and exposure conditions was performed to provide comparable results with classical submerged exposure studies. The biological activity of the cells (inflammation, cell viability, oxidative stress) was assessed at 24 h and comparisons of the nanomaterial toxicities between exposure methods were performed.

Results: Deposited doses of nanomaterials achieved using our aerosol exposure system were sufficient to observe adverse effects. Co-cultures were more sensitive than monocultures and biological responses were usually observed at lower doses at the air-liquid interface than in submerged conditions. Nevertheless, the general ranking of the nanomaterials according to their toxicity was similar across the different exposure methods used.

Conclusions: We showed that exposure of cells at the air-liquid interface represents a valid and sensitive method to assess the toxicity of several poorly soluble nanomaterials. We underlined the importance of the cellular model used and offer the possibility to deal with low deposition doses by using more sensitive and physiologic cellular models. This brings perspectives towards the use of relevant in vitro methods of exposure to assess nanomaterial toxicity.

Keywords: Air-liquid interface; Alveolar cells; Co-culture; In vitro; Nanomaterials; Submerged conditions; Toxicity.


Figures

Fig. 1
Fig. 1
In vitro comparisons between ALI and submerged exposure. Alveolar cells in monoculture or in co-culture were cultured in inserts or in plates and exposed at the ALI to aerosols or in submerged conditions to suspensions of four poorly soluble NMs. Final doses were reached within 3 h in inserts and 24 h in plates. Total deposited doses were measured at the ALI or estimated in submerged conditions and cell biological activity was assessed after 24 h of exposure to the NMs, performing cell viability, stress oxidative and inflammation assays. Comparisons were performed between the biological activation levels determined after statistical analysis
Fig. 2
Fig. 2
Exposure of cells at the ALI to aerosols of NMs. Cells at the ALI in inserts were exposed simultaneously to aerosols of NMs or to air in two different VitroCell® exposure chambers. NM aerosols were generated at a 5 L/min flow rate by nebulization of suspensions using a nebulizer. Aerosols were dried using a dryer to reduce relative humidity to 90 %. The aerosols were sucked using a vacuum pump to allow the NM deposition on the cells. At the cell level, the flow rate was reduced to 5 mL/min/well using flow controllers to prevent cell damage. Aerosols were characterized in real time using a SMPS and a COP, to assess the size distribution and by gravimetric measurements, to assess the mass concentration. The deposition of NMs on the cells was assessed by performing QCM and ICP-MS measurements and TEM analysis, to assess the mass, shape, size and distribution of the NMs on the cells
Fig. 3
Fig. 3
Number size distribution of the aerosols and respective deposition in inserts. Aerosols were generated by nebulization of suspensions of TiO2 (NMs 105, 101, 100) and CeO2 (NM212) at concentrations of 1 g/L (light grey), 5 g/L (dark grey), 10 g/L (black). The size distributions of the NMs in the aerosols were measured using a SMPS and an OPC, and particles ranged from 10 to 1095 nm and 300 to 34 000 nm, respectively (a). The deposition of the NMs on the TEM grids was assessed after exposure (b). TEM grids were placed on the apical side of inserts and exposed 3 h to aerosols generated with suspensions of 10 g/L in the nebulizer. After exposure, the grids were analyzed by TEM to assess the sizes, shapes and distributions of the deposited NMs
Fig. 4
Fig. 4
Levels of pro-inflammatory mediators IL-1β, IL-6, IL-8 and TNF-α in culture medium of cells exposed at the ALI to aerosols. Mono (A549) and co-cultures (A549 + THP-1) were exposed for 3 h at the ALI to aerosols of TiO2 (NM105, NM101, NM100) and CeO2 (NM212) or air and kept in the incubator at the ALI for 21 h, with NMs deposited on their surface. Deposited doses were around 0.1, 1, 3 μg/cm2. At 24 h, IL-1β, IL-6, IL-8 and TNF-α levels in the culture medium were measured by ELISA multiplex at the basal side. For exposures at the ALI, specific air and positive controls (LPS 20 μg/mL) (not shown on the graph) were used for each NM used and for each concentration tested. Data represent the mean ± Standard Deviation (SD) of three independent experiments. A Kruskal-Wallis test followed by Dunn’s post-hoc test were performed to compare treated groups to controls (*p < 0.05; **p < 0.01; ***p < 0.001)
Fig. 5
Fig. 5
Functionality, integrity and intracellular ROS levels of cells exposed at the ALI to aerosols. Mono (A549) and co-cultures (A549 + THP-1) were exposed for 3 h at the ALI to aerosols of TiO2 (NM105, NM101, NM100) and CeO2 (NM212) or air and kept at the ALI for 21 h in the incubator, with NMs deposited on their surface. Deposited doses were around 0.1, 1, 3 μg/cm2. At 24 h, Alamar blue® and LDH assays were performed to assess functionality and integrity of the cells, respectively. A DCF assay was performed to measure intracellular ROS levels and H2O2 (1 mM) was used as positive control for the DCF assay (not shown on the graph). Specific air and incubator controls (cells kept in the incubator) (not shown on the graph) were used for each NM used and for each concentration tested. Data represent the mean ± SD of three independent experiments. A Kruskal-Wallis test followed by Dunn’s post-hoc test were performed to compare treated groups to control (*p < 0.05; **p < 0.01; ***p < 0.001)
Fig. 6
Fig. 6
Levels of pro-inflammatory mediators IL-1β, IL-6, IL-8 and TNF-α in culture medium of cells exposed in submerged conditions in inserts. Co-cultures (A549 + THP-1) were exposed in inserts for 3 h to suspensions of TiO2 (NM105, NM101, NM100) and CeO2 (NM212), to achieve deposited doses of around 1, 3 and 10 μg/cm2. Suspensions were then replaced by fresh medium and cells were kept for 21 h at the incubator with NMs deposited on their surface. At 24 h, IL-1β, IL-6, IL-8 and TNF-α levels were measured by ELISA multiplex in cell culture medium (apical and basal sides). A specific control (cells exposed to culture medium) and positive control (LPS 20 μg/mL) (not shown on the graph) were used for each NM used. Data represent the mean ± Standard Deviation (SD) of three independent experiments. A Kruskal-Wallis test followed by Dunn’s post-hoc test were performed to compare treated groups to controls (*p < 0.05; **p < 0.01; ***p < 0.001)
Fig. 7
Fig. 7
Functionality, integrity and intracellular ROS levels of cells exposed in submerged conditions in inserts. Co-cultures (A549 + THP-1) were exposed in inserts for 3 h to suspensions of TiO2 (NM105, NM101, NM100) and CeO2 (NM212), to achieve deposited doses of around 1, 3 and 10 μg/cm2. Suspensions were then replaced by fresh medium and cells were kept for 21 h at the incubator with NMs deposited on their surface. At 24 h, Alamar blue® and LDH assays were performed to assess functionality and integrity of the cells, respectively. A DCF assay was performed to measure intracellular ROS levels and H2O2 (1 mM) was used as positive control for the assay (not shown on the graph). Data represent the mean ± SD of three independent experiments. A Kruskal-Wallis test followed by Dunn’s post-hoc test were performed to compare treated groups to controls (*p < 0.05; **p < 0.01; ***p < 0.001)
Fig. 8
Fig. 8
Levels of pro-inflammatory mediators IL-1β, IL-6, IL-8 and TNF-α in the culture medium of cells exposed in submerged conditions in plates. Co-cultures (A549 + THP-1) were exposed in plates for 24 h to suspensions of TiO2 (NM105, NM101, NM100) and CeO2 (NM212), to achieve deposited doses of around 1, 3 and 10 and 20 μg/cm2. IL-1β, IL-6, IL-8 and TNF-α levels were measured by ELISA multiplex in the culture medium. A specific control (cells exposed to culture medium) and positive control (LPS 20 μg/mL) (not shown on the graph) were used for each NM used Data represent the mean ± SD of three independent experiments. A Kruskal-Wallis test followed by Dunn’s post-hoc test were performed to compare treated groups to controls (*p < 0.05; **p < 0.01; ***p < 0.001)
Fig. 9
Fig. 9
Functionality, integrity and intracellular ROS levels of cells exposed in submerged conditions in plates. Co-cultures (A549 + THP-1) were exposed in plates for 24 h to suspensions of TiO2 (NM105, NM101, NM100) and CeO2 (NM212), to achieve deposited doses of around 1, 3 and 10 and 20 μg/cm2. Alamar blue® and LDH assays were performed to assess functionality and integrity of the cells, respectively. A DCF assay was performed to measure intracellular ROS levels and H2O2(1 mM) was used as positive control for the assay (not shown on the graph). Data represent the mean ± SD of three independent experiments. A Kruskal-Wallis test followed by Dunn’s post-hoc test were performed to compare treated groups to controls (*p < 0.05; **p < 0.01; ***p < 0.001)
Fig. 10
Fig. 10
levels of pro-inflammatory mediators after stimulation with LPS (20 μg/mL). Co-cultures were stimulated at the ALI or in submerged conditions in inserts with 20 μg/ml of LPS at the basal side for 21 h. Levels of IL-1β, IL-6, IL-8 and TNF-α were assessed in culture medium at basal side and in culture medium or washing liquid at the apical side for submerged and ALI exposures, respectively. The control for ALI exposures was cells exposed at the ALI to air for 3 h in the exposure system and kept at the ALI for 21 h with fresh medium in the incubator. The control for submerged exposure was cells kept in submerged condition with fresh medium for 21 h. IL-1β, IL-6, IL-8 and TNF-α secretions were measured by ELISA multiplex in the cell culture medium. Results were first expressed in concentrations (pg/mL), to assess whether cells secreted similar amounts of cytokines at the ALI and in submerged conditions in inserts, after stimulation (a). Because we observed more basal secretion at the ALI (secretion by non stimulated cells), the data was also expressed in cytokine levels compared to control (b), to compare ALI and submerged results more accurately. Data represent the mean ± SD of three independent experiments. A two-way Anova followed by a Bonferroni post-hoc test were performed to compare treated groups to their respective controls (*p < 0.05; **p < 0.01; ***p < 0.001) or to compare ALI and submerged exposures (# p < 0.05; ## p < 0.01; ### p < 0.001)

References

    1. Nowack B, Ranville JF, Diamond S, Gallego-Urrea JA, Metcalfe C, Rose J, et al. Potential scenarios for nanomaterial release and subsequent alteration in the environment. Environ Toxicol Chem. 2012;31(1):50–9. doi: 10.1002/etc.726. - DOI - PubMed
    1. Oberdorster G, Oberdorster E, Oberdorster J. Nanotoxicology: an emerging discipline evolving from studies of ultrafine particles. Environ Health Perspect. 2005;113(7):823–39. doi: 10.1289/ehp.7339. - DOI - PMC - PubMed
    1. Yokel RA, Macphail RC. Engineered nanomaterials: exposures, hazards, and risk prevention. J Occup Med Toxicol. 2011;6:7. doi: 10.1186/1745-6673-6-7. - DOI - PMC - PubMed
    1. Johnston H, Pojana G, Zuin S, Jacobsen NR, Moller P, Loft S, et al. Engineered nanomaterial risk. Lessons learnt from completed nanotoxicology studies: potential solutions to current and future challenges. Crit Rev Toxicol. 2013;43(1):1–20. doi: 10.3109/10408444.2012.738187. - DOI - PubMed
    1. Piccinno F, Gottschalk F, Seeger S, Nowack B. Industrial production quantities and uses of ten engineered nanomaterials in Europe and the world. J Nanopart Res. 2012;14(9). doi: Artn 1109 10.1007/S11051-012-1109-9.

Publication types

LinkOut - more resources