. 2016 Dec 5;215(5):621-629.
doi: 10.1083/jcb.201609019.

Structures of human mitofusin 1 provide insight into mitochondrial tethering

Affiliations

Structures of human mitofusin 1 provide insight into mitochondrial tethering

Yuanbo Qi et al. J Cell Biol. .

Abstract

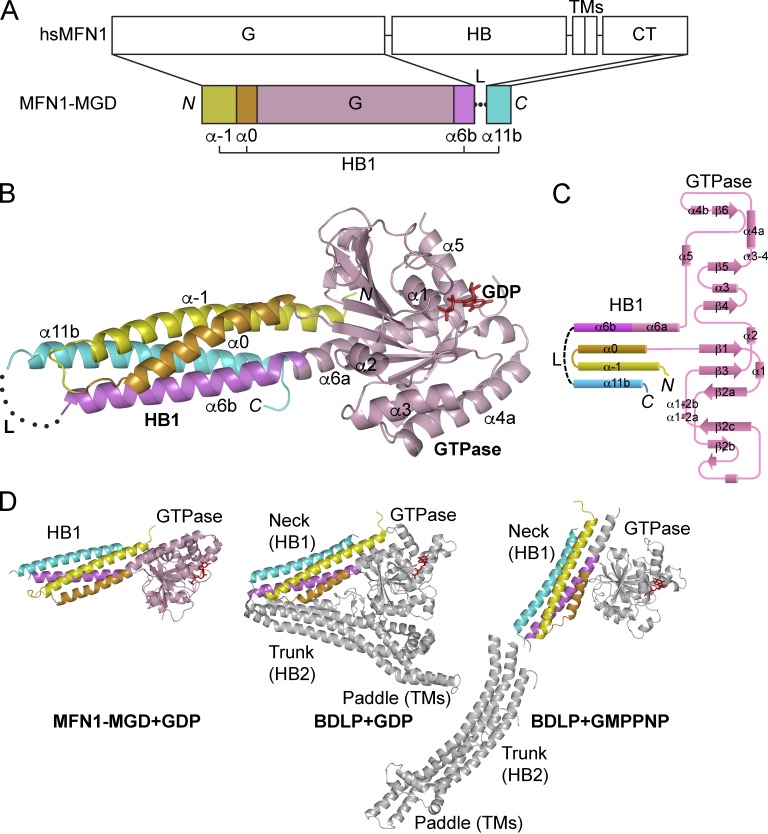
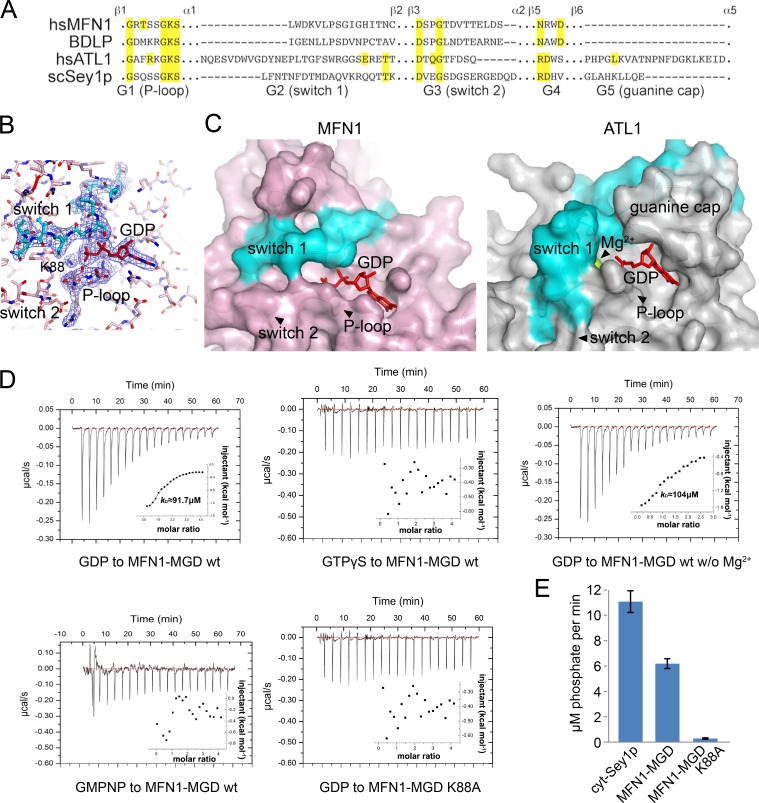
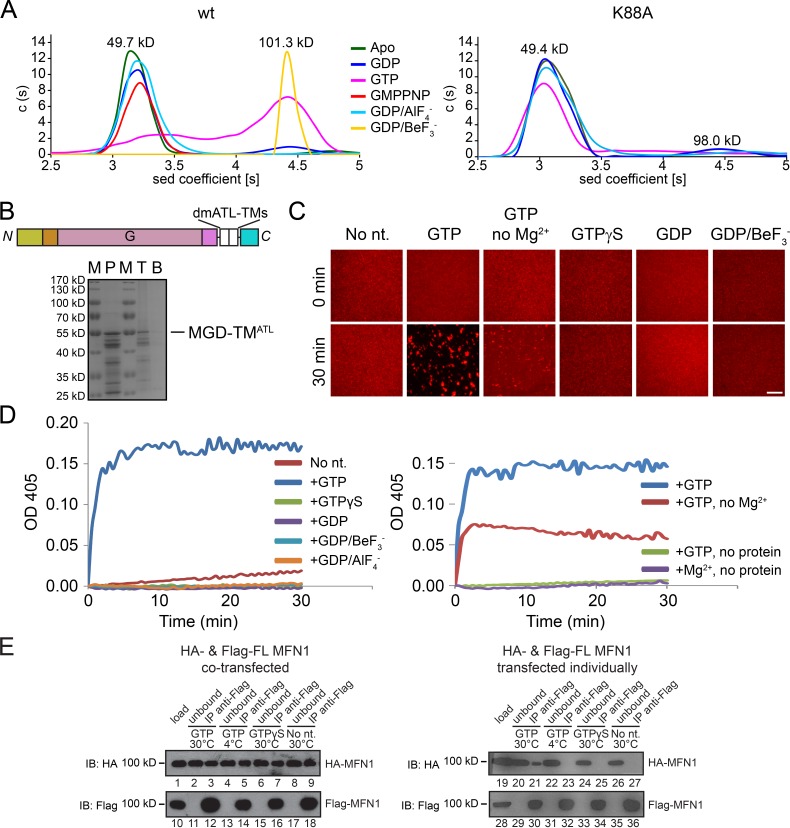
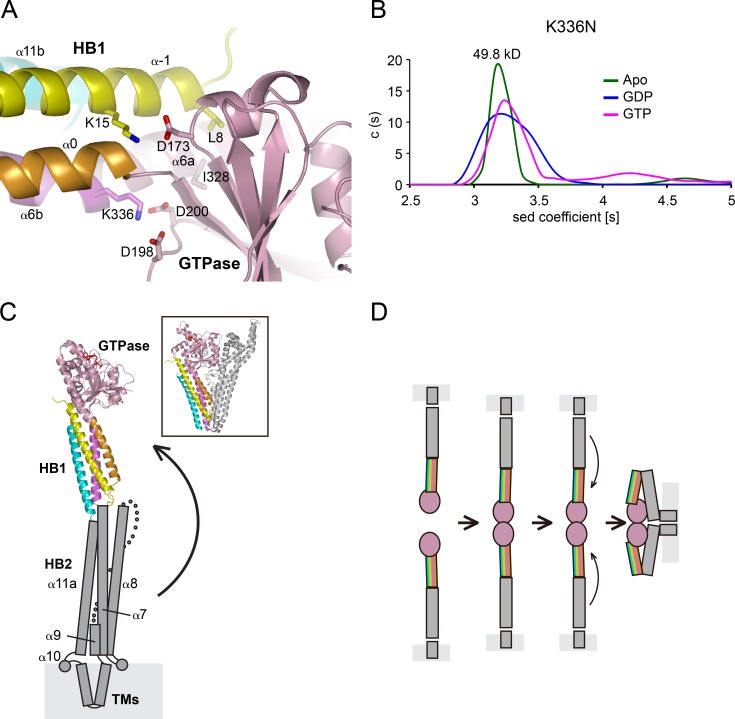
Mitochondria undergo fusion and fission. The merging of outer mitochondrial membranes requires mitofusin (MFN), a dynamin-like GTPase. How exactly MFN mediates membrane fusion is poorly understood. Here, we determined crystal structures of a minimal GTPase domain (MGD) of human MFN1, including the predicted GTPase and the distal part of the C-terminal tail (CT). The structures revealed that a helix bundle (HB) formed by three helices extending from the GTPase and one extending from the CT closely attaches to the GTPase domain, resembling the configuration of bacterial dynamin-like protein. We show that the nucleotide-binding pocket is shallow and narrow, rendering weak hydrolysis and less dependence on magnesium ion, and that association of HB affects GTPase activity. MFN1 forms a dimer when GTP or GDP/BeF3-, but not GDP or other analogs, is added. In addition, clustering of vesicles containing membrane-anchored MGD requires continuous GTP hydrolysis. These results suggest that MFN tethers apposing membranes, likely through nucleotide-dependent dimerization.


Figures

Figure 1.
Figure 1.
Crystal structure of MFN1–MGD. (A) Scheme showing the domains of human MFN1 and the MGD construct used for crystallization. Regions of MGD are colored and secondary structure elements that form helix bundle 1 (HB1) are labeled. G, GTPase; TMs, transmembrane segments; CT, cytosolic tail; L, linker. (B) Structure of the GDP-bound form of MGD. As in A, the GTPase is colored in pink and the helices in HB1 yellow (α-1), orange (α0), purple (α6b), and cyan (α11b), respectively. GDP is shown as red sticks and the disordered linker by a dotted line. The main helices are labeled. (C) Topology plots of the MGD. Colored as in A. (D) Comparison of MFN and BDLP. The GTPase domains of MFN1–MGD and BDLP in GDP- (PDB 2J68) or GMPPNP-bound (PDB 2W6D) states are oriented similarly. The nucleotides are shown as red sticks. The part in BDLP that is equivalent to MGD is colored in the same way; the remaining part is shown in gray. Major domains are labeled.
Figure 2.
Figure 2.
GTP binding and hydrolysis of MFN1. (A) Sequence alignment of the conserved GTPase motifs. Key residues are highlighted in yellow. Neighboring secondary structure elements of the motifs are labeled. (B) The active site of MFN1 is shown in sticks. The 2Fo − Fc electron density maps (1.0-σ contour) of switch 1, P-loop, and GDP are shown as wire mesh (blue). (C) Comparison of the active sites of MFN1 and ATL1. A surface representation is shown. The switch 1 region is highlighted in cyan, GDP as red sticks, and Mg2+ ion as a lime sphere. Key motifs are labeled. (D) Binding affinity of various nucleotides for wild-type (wt) MFN1 and the K88A mutant measured by ITC. 2 mM nucleotide solution was injected stepwise into 0.1 mM protein. The dissociation constant, Kd, if calculable, is given in the inlet. The data are representative of at least three repetitions. (E) GTPase activity of MFN1 and Sey1p. 2 µM protein was used for each sample. The activities were measured by phosphate release at saturating GTP concentrations (0.5 mM) using the cytosolic domains. Each bar is the mean and SD of four measurements. The data are representative of at least three repetitions.
Figure 3.
Figure 3.
Homotypic interactions of MFN1. (A) The sizes of wild-type (wt) MFN1-MGD (theoretical molecular mass, 49.5 kD) and the K88A mutant (both at 0.4 mM) were determined by analytical ultracentrifugation in the presence of 2 mM indicated nucleotides. The estimated molecular masses are given above the peaks (in kilodaltons). The data are representative of at least three repetitions. (B) Purified (P) and reconstituted dmATL TM-containing MGD (domain structure shown above) was subjected to floatation analysis. Top (T) and bottom (B) fractions were analyzed by SDS-PAGE and Coomassie staining. M, molecular marker shown in kilodaltons. (C) Membrane tethering by MGD-TMATL followed by a visual assay. Proteoliposomes containing MFN1 (protein/lipid ratio 1:2,000) and rhodamine-labeled lipids were analyzed by confocal microscopy. One aliquot was sampled immediately, and a second was taken after incubation at 37°C with 10 mM of the indicated nucleotide for 30 min. The data are representative of at least three repetitions. Bar, 50 µm. (D) As in C, but measured by absorbance at 405 nm. (E) HA-tagged and Flag-tagged full-length (FL) human MFN1 were cotransfected into HEK293T cells and solubilized in digitonin or transfected individually followed by mixing of the digitonin-solubilized cell extracts. Immunoprecipitation (IP) was performed with anti-HA or anti-Flag agarose beads. When indicated, 1 mM nucleotides was added and incubated. The samples were analyzed by SDS-PAGE and immunoblotting (IB). 10% of the starting material (load) and the material not bound to the antibodies (unbound) was also analyzed.
Figure 4.
Figure 4.
Association between GTPase and HBs of MFN1. (A) The interface between GTPase and HB1. The cartoon representation is colored as in Fig. 1 B. Key residues are indicated as sticks. (B) The size of MFN1MGD K336N (theoretical molecular mass, 49.5 kD) at 0.4 mM was determined by analytical ultracentrifugation in the presence of the indicated nucleotides. The estimated molecular masses are given above the peaks (in kilodaltons). The data are representative of at least three repetitions. (C) A structural model of full-length MFN1. Predicted HB2 is shown in gray, with secondary structure elements labeled. A possible movement of the HB2 is indicated by an arrow, and the resulting folded configuration may resemble that of BDLP (shown in box for comparison). (D) A simple fusion model for MFN. First, the HBs are extended. Then, upon GTP hydrolysis, HB1 rotates and allows HB2 to bend over and attach to the GTPase, bringing apposing membranes together for fusion.

References

    1. Afonine P.V., Grosse-Kunstleve R.W., Echols N., Headd J.J., Moriarty N.W., Mustyakimov M., Terwilliger T.C., Urzhumtsev A., Zwart P.H., and Adams P.D.. 2012. Towards automated crystallographic structure refinement with phenix.refine. Acta Crystallogr. D Biol. Crystallogr. 68:352–367. 10.1107/S0907444912001308 - DOI - PMC - PubMed
    1. Anton F., Dittmar G., Langer T., and Escobar-Henriques M.. 2013. Two deubiquitylases act on mitofusin and regulate mitochondrial fusion along independent pathways. Mol. Cell. 49:487–498. 10.1016/j.molcel.2012.12.003 - DOI - PubMed
    1. Bian X., Klemm R.W., Liu T.Y., Zhang M., Sun S., Sui X., Liu X., Rapoport T.A., and Hu J.. 2011. Structures of the atlastin GTPase provide insight into homotypic fusion of endoplasmic reticulum membranes. Proc. Natl. Acad. Sci. USA. 108:3976–3981. 10.1073/pnas.1101643108 - DOI - PMC - PubMed
    1. Brandt T., Cavellini L., Kühlbrandt W., and Cohen M.M.. 2016. A mitofusin-dependent docking ring complex triggers mitochondrial fusion in vitro. eLife. 5:e14618 10.7554/eLife.14618 - DOI - PMC - PubMed
    1. Byrnes L.J., and Sondermann H.. 2011. Structural basis for the nucleotide-dependent dimerization of the large G protein atlastin-1/SPG3A. Proc. Natl. Acad. Sci. USA. 108:2216–2221. 10.1073/pnas.1012792108 - DOI - PMC - PubMed

Substances