. 2017 Jan;173(1):155-166.
doi: 10.1104/pp.16.01024. Epub 2016 Dec 5.

SUPPRESSOR OF FRIGIDA (SUF4) Supports Gamete Fusion via Regulating Arabidopsis EC1 Gene Expression

Affiliations

SUPPRESSOR OF FRIGIDA (SUF4) Supports Gamete Fusion via Regulating Arabidopsis EC1 Gene Expression

Francesca Resentini et al. Plant Physiol. 2017 Jan.

Abstract

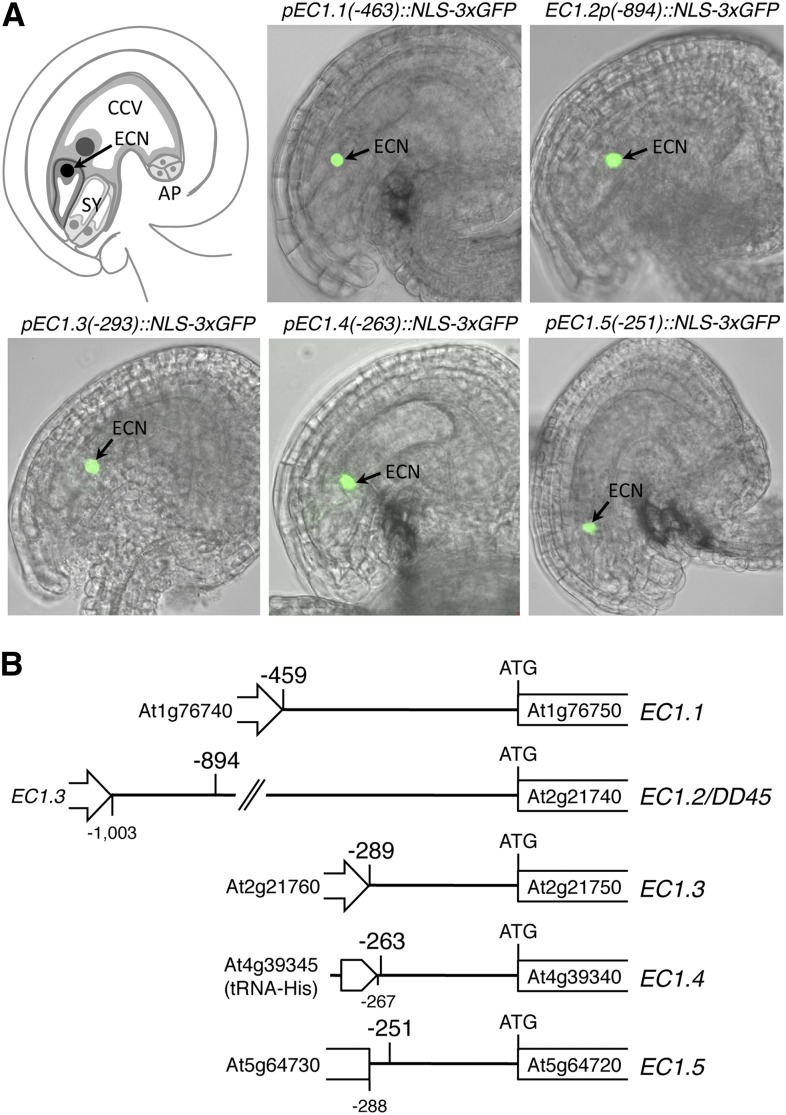
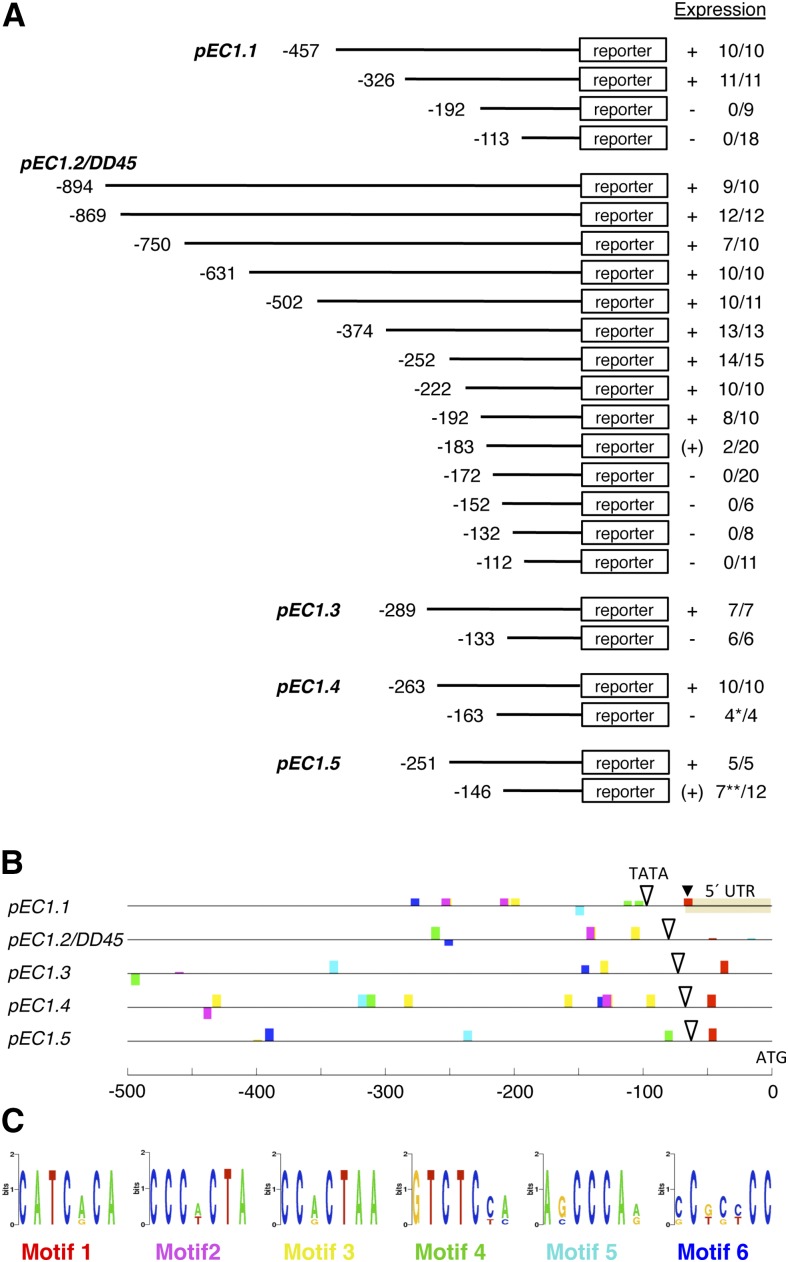
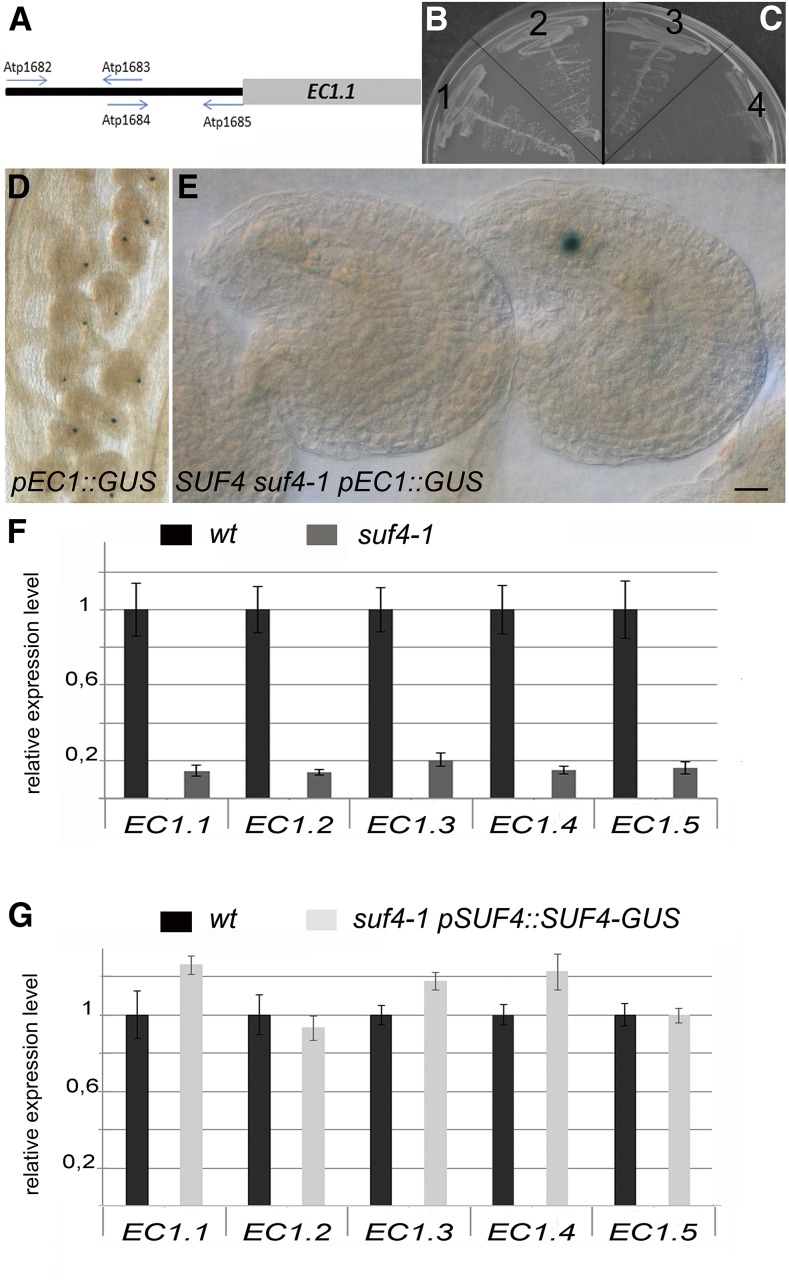
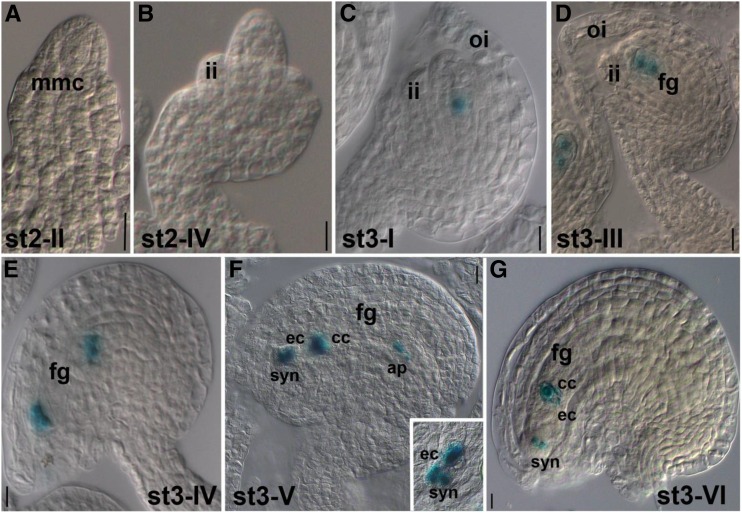
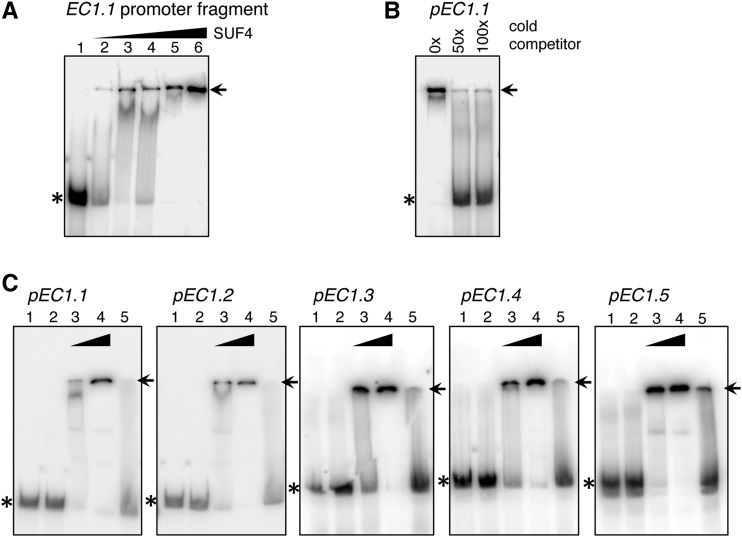
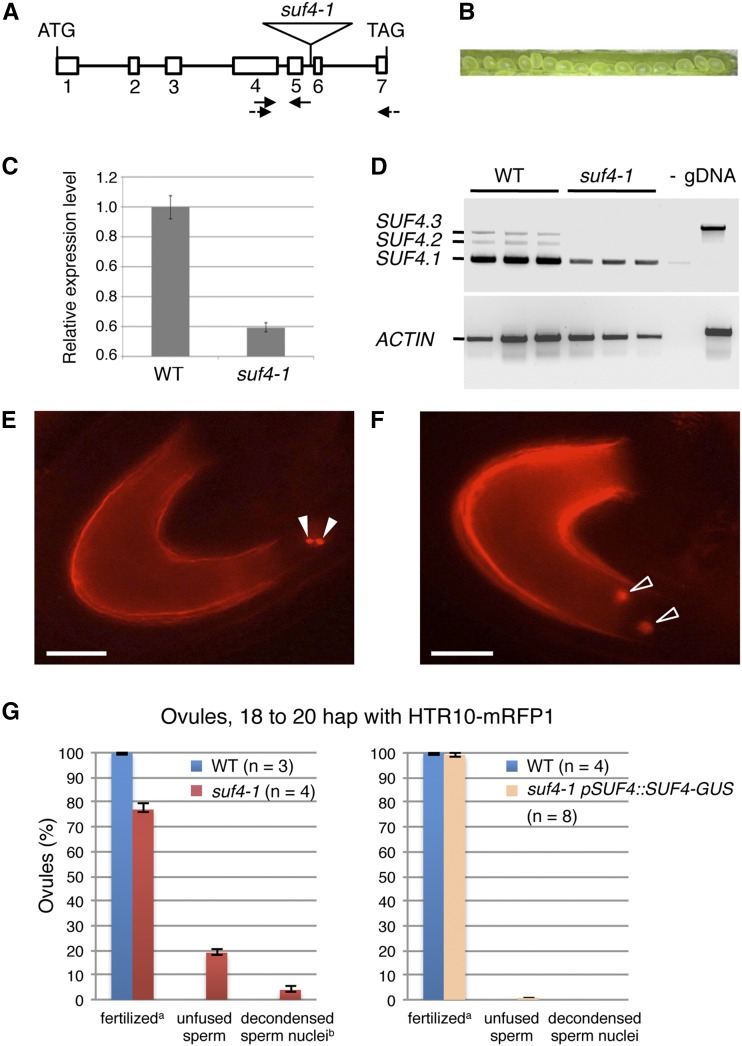
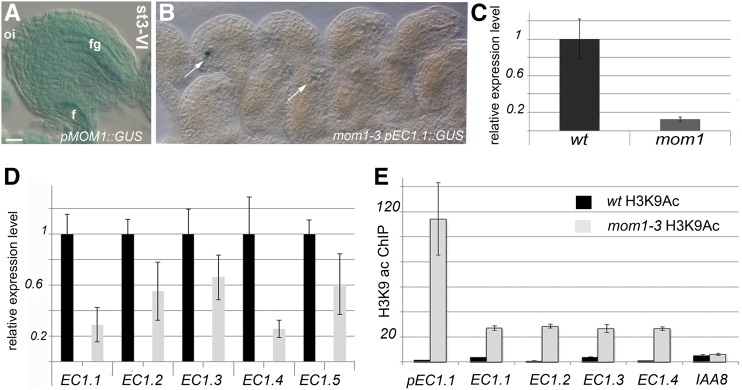
The EGG CELL1 (EC1) gene family of Arabidopsis (Arabidopsis thaliana) comprises five members that are specifically expressed in the egg cell and redundantly control gamete fusion during double fertilization. We investigated the activity of all five EC1 promoters in promoter-deletion studies and identified SUF4 (SUPPRESSOR OF FRIGIDA4), a C2H2 transcription factor, as a direct regulator of the EC1 gene expression. In particular, we demonstrated that SUF4 binds to all five Arabidopsis EC1 promoters, thus regulating their expression. The down-regulation of SUF4 in homozygous suf4-1 ovules results in reduced EC1 expression and delayed sperm fusion, which can be rescued by expressing SUF4-β-glucuronidase under the control of the SUF4 promoter. To identify more gene products able to regulate EC1 expression together with SUF4, we performed coexpression studies that led to the identification of MOM1 (MORPHEUS' MOLECULE1), a component of a silencing mechanism that is independent of DNA methylation marks. In mom1-3 ovules, both SUF4 and EC1 genes are down-regulated, and EC1 genes show higher levels of histone 3 lysine-9 acetylation, suggesting that MOM1 contributes to the regulation of SUF4 and EC1 gene expression.


Figures

Figure 1.
Figure 1.
EC1 promoter regions drive egg cell-specific expression. A, Egg cell-specific reporter activity in mature ovules. Green fluorescent egg cell nuclei (arrows) indicate that all five promoters of the Arabidopsis EC1 gene family are functional and specifically active in the egg cell. AP, Antipodal cells; CCV, central cell vacuole; ECN, egg cell nucleus; SY, synergid cells. B, Schemes illustrating the genomic regions 5′ upstream of the sense strands of EC1 coding sequences. The position in a DNA sequence is designated relative to the predicted start codon (ATG) of the EC1 open reading frame. Arabidopsis Genome Initiative codes for EC1 genes and adjacent gene loci are given. Note that the promoter regions of EC1.3, EC1.4, and EC1.5 are short (−289 to −267 bp) but sufficient to drive egg cell-specific expression.
Figure 2.
Figure 2.
EC1 promoter deletion studies and mapping of putative cis-regulatory motifs. A, Scheme summarizing the results from EC1 promoter deletion studies. A series of 5′ deletion constructs was tested for reporter activity in transgenic plants. Expression describes the observed reporter activity as present (+), weakly present [(+)], or absent (−) in the egg cell. Numbers indicate individual transgenic lines for a given deletion construct showing reporter activity compared with the total number of lines transgenic for this construct. *, One out of four lines showed misexpression of the reporter in sporophytic cells; **, five of seven lines showed only very weak reporter activity, and two of these five lines showed misexpression in sporophytic cells. B, Conserved sequence motifs (colored boxes) mapped in the −500-bp upstream regions of the five EC1 genes by Cistome (https://bar.utoronto.ca/cistome/cgi-bin/BAR_Cistome.cgi) using the prediction program MEME. White triangles mark the positions of TATA box motifs identified by AthMap (http://www.athamap.de/index.php). The transcription start site of EC1.1 is labeled with a black triangle. UTR, Untranslated region. C, Sequence logos of mapped sequence motifs shown in B. Motifs 2 and 3 show high sequence similarity.
Figure 3.
Figure 3.
SUF4 regulates EC1.1 in yeast and in planta. A to C, Yeast one-hybrid analysis of interactions between SUF4 and pEC1.1. A, The EC1.1 promoter was divided into two bait fragments, and arrows indicate primers used for bait construction. B and C, Transformed yeast strains with the proximal fragment of the EC1.1 promoter were grown on either permissive –His–Leu medium (B) or selective –His–Leu with 5 mm 3-AT medium (C). Sections 1 and 4, pGADT7 without any insert (negative control); sections 2 and 3, pGAD-SUF4. D, GUS staining of homozygous pEC1.1(-457)::GUS plants. All egg cells show reporter activity. E, SUF4 is important for EC1.1 promoter activity in planta. suf4-1 mutants were crossed with homozygous pEC1.1(-457)::GUS plants. In the F1 carpels, only 25%, instead of the expected 50%, of egg cells were GUS positive; therefore, pEC1.1(-457)::GUS activation relies on SUF4. Bar = 20 µm. F, All five EC1 genes are down-regulated in suf4-1 mutant pistils, as indicated by real-time RT-PCR analyses. To normalize the expression level, we used UBIQUITIN10 or ACTIN8 (data not shown). The expression of each EC1 gene has been calibrated to 1 in wild-type pistils (wt). G, The normal EC1 gene expression is restored in suf4-1 suf4-1 pSUF4::SUF4-GUS pSUF4::SUF4-GUS pistils. The expression of each EC1 gene has been calibrated to 1 in wild-type pistils.
Figure 4.
Figure 4.
SUF4 is expressed in developing FGs. A and B, pSUF4::SUF4-GUS activity is detected neither in the megaspore mother cell (mmc; A) nor in the tetrad of megaspores (B). C, SUF4-GUS is detected in developing ovules from stage 3-I on, initially in the nucleus of the functional megaspore forming the haploid FG. D and E, SUF4-GUS expression persists in the developing embryo sac. F, In the seven-celled embryo sac (stage 3-V), SUF4-GUS is detected in all seven nuclei. G, At stage 3-VI, SUF4-GUS is no longer expressed in the egg cell but only in the nuclei of the central cell and synergid cells. Ovule stages are according to Schneitz et al. (1995). ap, Antipodal cells; cc, central cell; ec, egg cell; fg, FG; ii, inner integument; oi, outer integument; syn, synergid cells. Bars = 20 µm
Figure 5.
Figure 5.
SUF4 binds to all five EC1 promoters. A, Gel-shift assay without (lane 1) and with 10 (lane 2), 50 (lane 3), 100 (lane 4), 200 (lane 5), and 400 ng (lane 6) of recombinant 6xHIS-SUF4-STREPII added to a radioactively labeled 108-bp EC1.1 promoter fragment covering the DNA region used as bait in the yeast one-hybrid screen. B, Gel-shift assay with 50-fold (50×) and 100-fold (100×) excess of unlabeled EC1.1 promoter fragment as a cold competitor added to the reaction mix with 200 ng of 6xHIS-SUF4-STREPII. The control reaction is without cold competitor (0×). C, Fifty and 150 ng of recombinant 6xHIS-MBP-SUF4, and 150 ng of 6xHIS-MBP as a control, were mixed with 10 ng of radioactively labeled EC1 promoter fragments. Lane 1, Radioactively labeled promoter fragment only; lane 2, radioactively labeled promoter fragment with 150 ng of 6xHIS-MBP tag only; lane 3, radioactively labeled promoter fragment with 50 ng of 6xHIS-MBP-SUF4; lane 4, radioactively labeled promoter fragment with 150 ng of MBP-SUF4; lane 5, radioactively labeled promoter fragment with 150 ng of MBP-SUF4 and 100-fold excess of cold competitor (unlabeled promoter fragment). Asterisks mark free probes, arrows mark shifted bands of protein-DNA complexes.
Figure 6.
Figure 6.
suf4-1 ovules show a moderate ec1 phenotype. A, Genomic organization of SUF4, composed of seven exons and six introns. The T-DNA in suf4-1 is inserted in intron 5, 2,325 bp downstream of the predicted translation start site. B, Siliques of homozygous suf4-1 show normal seed set. C, Quantitative RT-PCR analyses revealed that residual SUF4 transcript is detectable in suf4-1. D, Three alternative splicing variants of SUF4 (SUF4.1, SUF4.2, and SUF4.3) are expressed in pistils of the wild type (WT). The functional splicing variant SUF4.1 (Kim and Michaels, 2006) also is detectable in pistils of homozygous suf4-1 plants. E and F, Phenotypes of suf4-1 pistils pollinated with the sperm cell marker line HTR10-mRFP1. Fluorescence microscopy 18 to 20 h after pollination revealed ovules with unfused sperm cells (arrowheads in E) or sperm cell nuclei with decondensed chromatin (arrowheads in F). At that time, gamete fusion in wild-type ovules has been accomplished (data not shown). Bars = 20 µm. G, Quantification of the suf4-1 ovule phenotypes shown in E and F. n, Number of pistils (Col-0, 167 ovules; suf4-1, 232 ovules). In the complemented line suf4-1 pSUF4::SUF4-GUS (at right), the suf4-1 phenotype of unfused or delayed-fusing sperm cells is not detectable. n, Number of pistils (Col-0, 178 ovules; suf4-1, 400 ovules). a, Fertilized ovules, no HTR10-mRFP1 fluorescence visible; b, includes two ovules with decondensed sperm chromatin and two additional unfused sperm cells. Error bars in C and G represent sem.
Figure 7.
Figure 7.
MOM1 is expressed in developing ovules and participates in SUF4 and EC1 expression. A, GUS activity driven by pMOM1::GUS is detected in the FG and in the sporophytic tissues of mature ovules. f, Funiculus; fg, FG; oi, outer integument. Bar = 20 µm. B, In mom1-3 mutants hemizygous for pEC1.1(-457)::GUS, enzymatic GUS activity is detected in 25% to 36% of the analyzed egg cells (arrows). A total of 589 ovules were analyzed. C, Quantitative RT-PCR analyses to monitor SUF4 expression in mom1-3 flowers. SUF4 expression is reduced compared with wild-type (wt) flowers. D, In mom1-3 mutant pistils, all five EC1 genes are down-regulated, as shown by quantitative RT-PCR analysis. E, ChIP using an anti-H3K9ac antibody. ChIP enrichment was evaluated by quantitative PCR analyses. EC1 genes are enriched in H3K9ac in mom1-3 inflorescence in comparison with wild-type ones. Immunoprecipitation efficiency was tested by quantifying H3K9ac marks in the IAA8 locus (Zhou et al., 2010). Cycle threshold values were used to calculate the immunoprecipitation/input signal. ChIP enrichments are presented as the percentage of bound/input signal.

Similar articles

Cited by

References

    1. Amedeo P, Habu Y, Afsar K, Mittelsten Scheid O, Paszkowski J (2000) Disruption of the plant gene MOM releases transcriptional silencing of methylated genes. Nature 405: 203–206 - PubMed
    1. Aravind L. (2000) The BED finger, a novel DNA-binding domain in chromatin-boundary-element-binding proteins and transposases. Trends Biochem Sci 25: 421–423 - PubMed
    1. Austin RS, Hiu S, Waese J, Ierullo M, Pasha A, Wang TT, Fan J, Foong C, Breit R, Desveaux D, Moses A, Provart NJ (2016) New BAR tools for mining expression data and exploring Cis-elements in Arabidopsis thaliana. Plant J 88: 490–504 - PubMed
    1. Bailey TL, Boden M, Buske FA, Frith M, Grant CE, Clementi L, Ren J, Li WW, Noble WS (2009) MEME SUITE: tools for motif discovery and searching. Nucleic Acids Res 37: W202–W208 - PMC - PubMed
    1. Bao Z, Zhang N, Hua J (2014) Endopolyploidization and flowering time are antagonistically regulated by checkpoint component MAD1 and immunity modulator MOS1. Nat Commun 5: 5628. - PubMed

Publication types