. 2017 Jul;27(7):2903-2915.
doi: 10.1007/s00330-016-4623-9. Epub 2016 Dec 5.

Differentiation of Uterine Leiomyosarcoma from Atypical Leiomyoma: Diagnostic Accuracy of Qualitative MR Imaging Features and Feasibility of Texture Analysis

Affiliations

Differentiation of Uterine Leiomyosarcoma from Atypical Leiomyoma: Diagnostic Accuracy of Qualitative MR Imaging Features and Feasibility of Texture Analysis

Yulia Lakhman et al. Eur Radiol. 2017 Jul.

Abstract

Purpose: To investigate whether qualitative magnetic resonance (MR) features can distinguish leiomyosarcoma (LMS) from atypical leiomyoma (ALM) and assess the feasibility of texture analysis (TA).

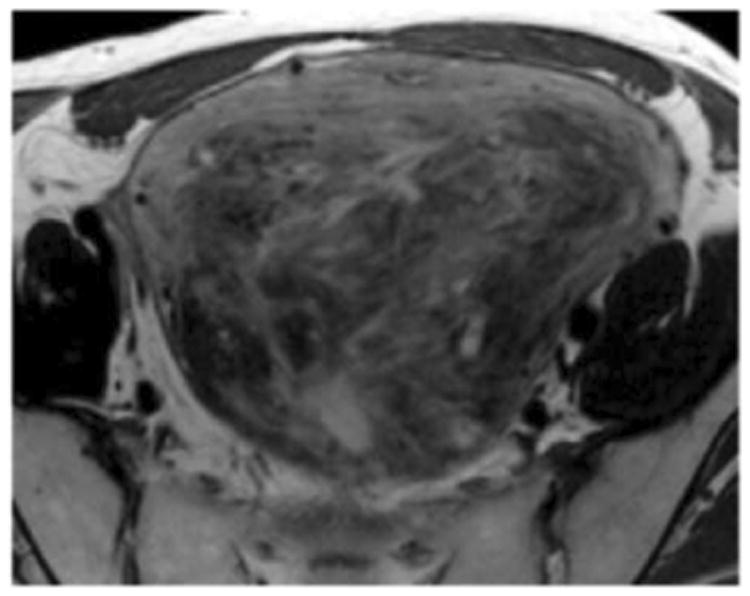
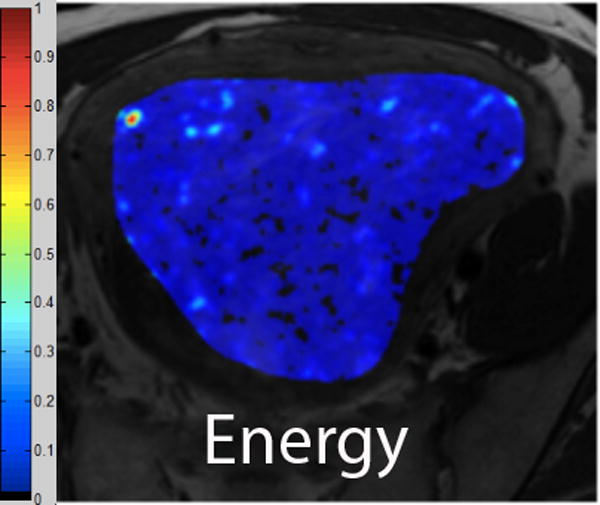
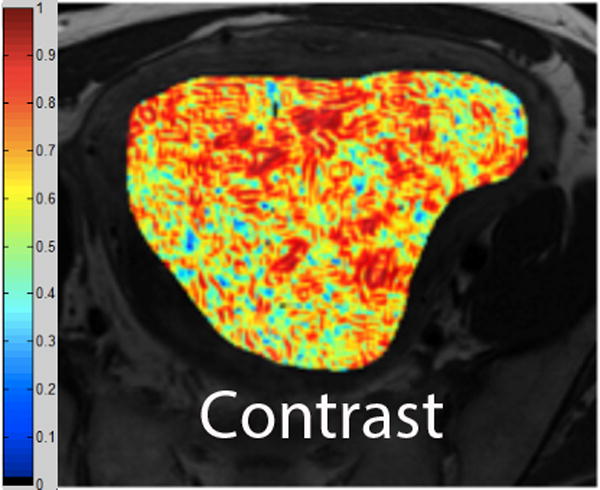
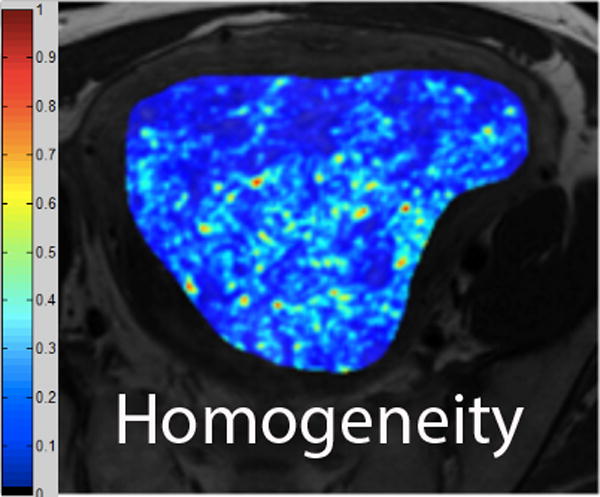
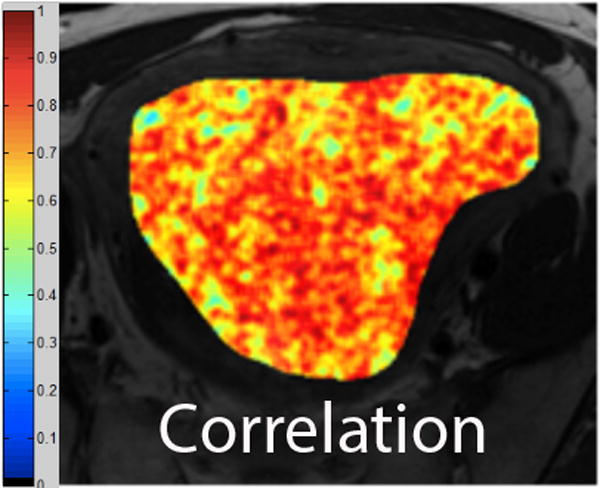
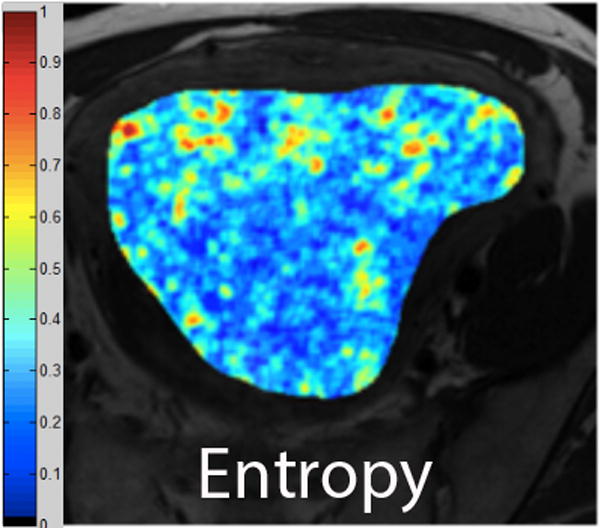
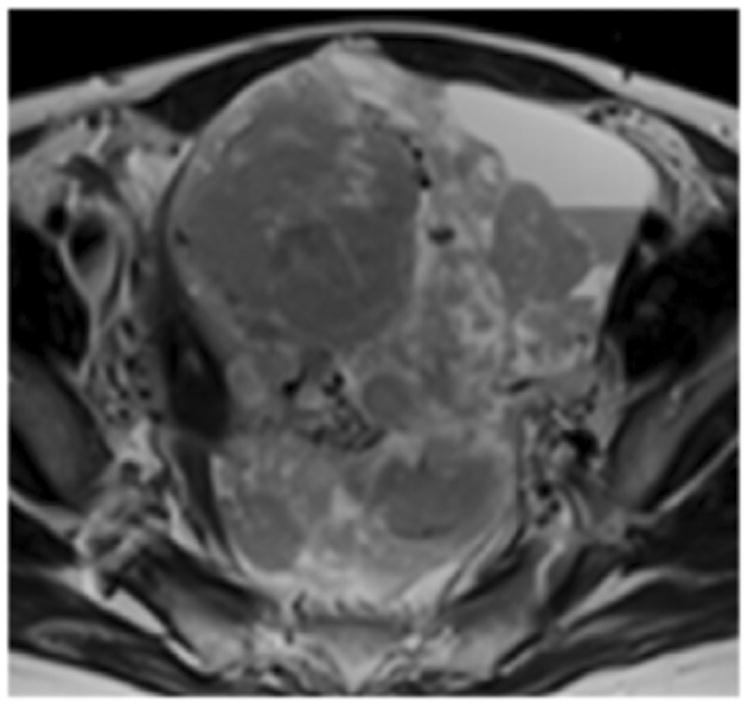
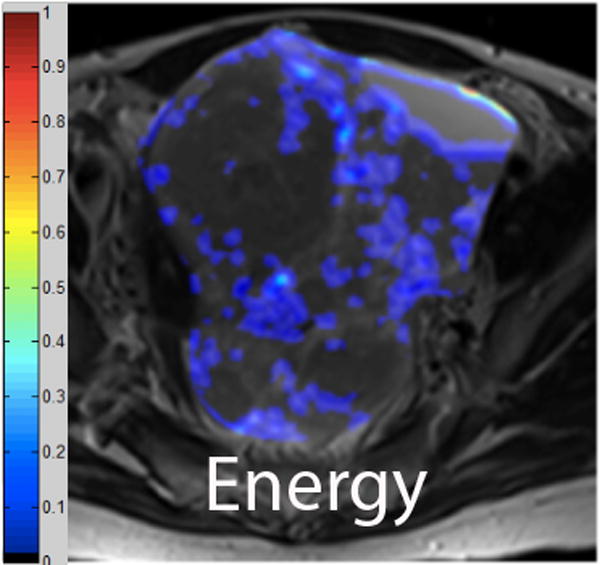
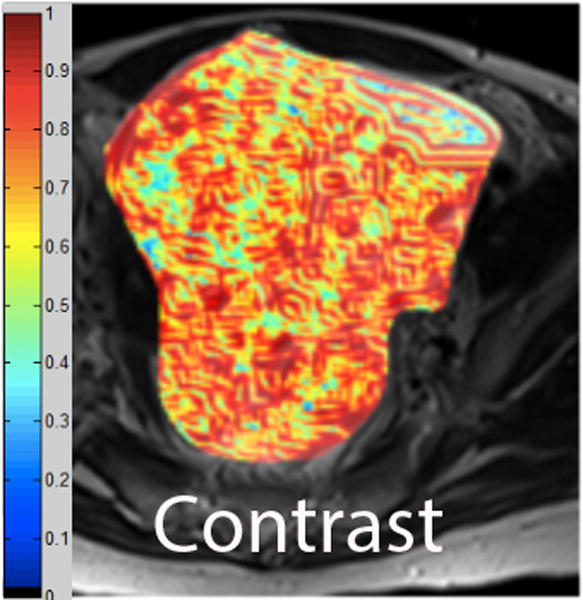
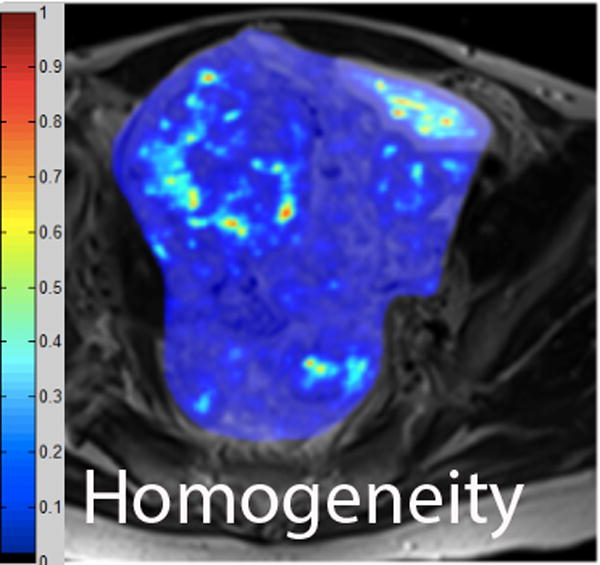
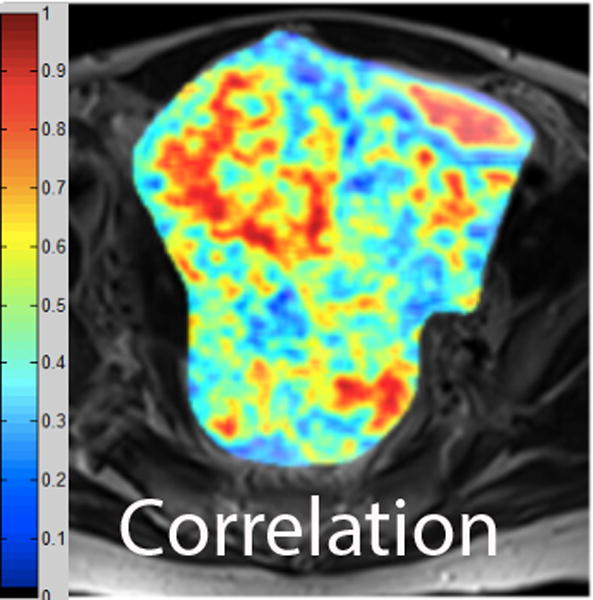
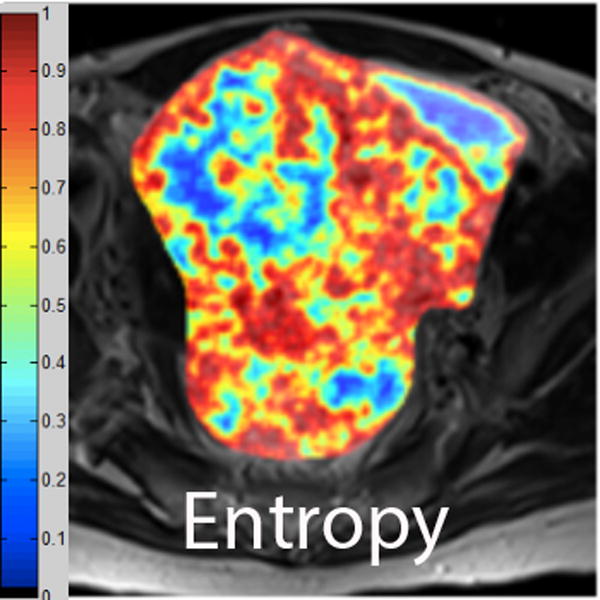
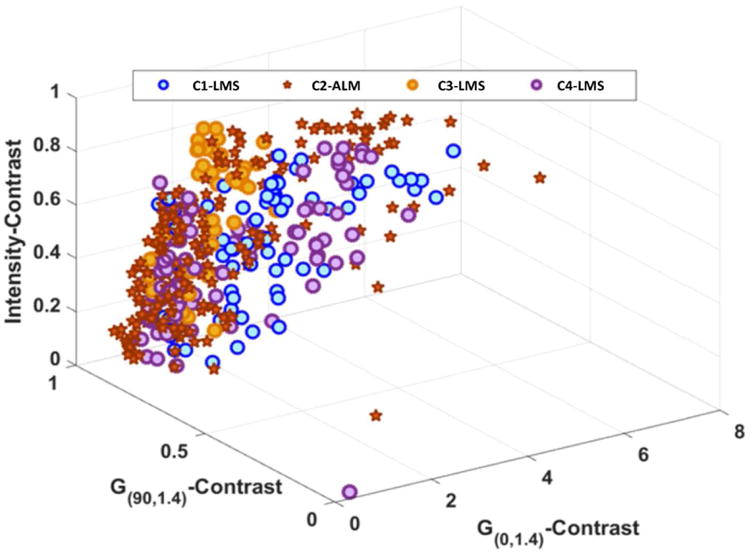
Methods: This retrospective study included 41 women (ALM = 22, LMS = 19) imaged with MRI prior to surgery. Two readers (R1, R2) evaluated each lesion for qualitative MR features. Associations between MR features and LMS were evaluated with Fisher's exact test. Accuracy measures were calculated for the four most significant features. TA was performed for 24 patients (ALM = 14, LMS = 10) with uniform imaging following lesion segmentation on axial T2-weighted images. Texture features were pre-selected using Wilcoxon signed-rank test with Bonferroni correction and analyzed with unsupervised clustering to separate LMS from ALM.

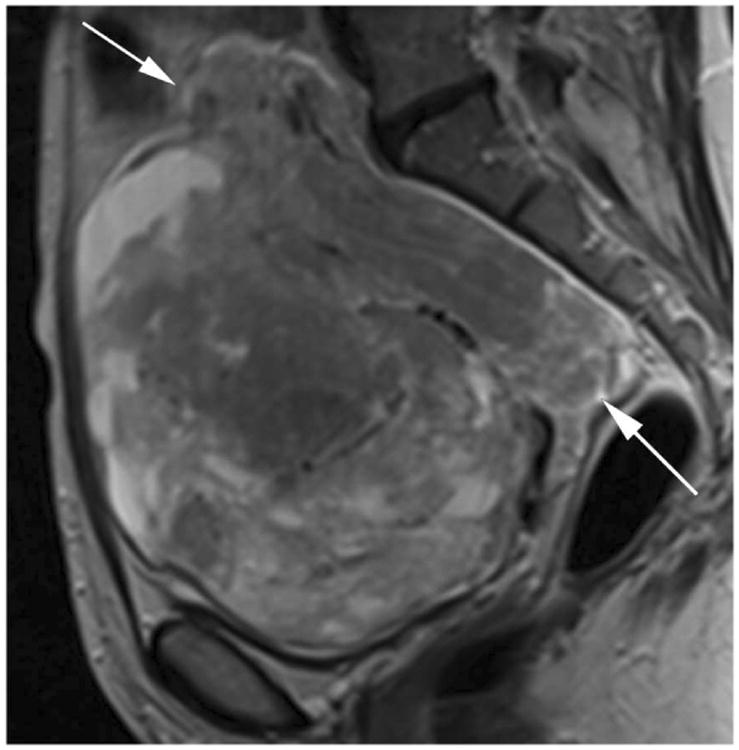
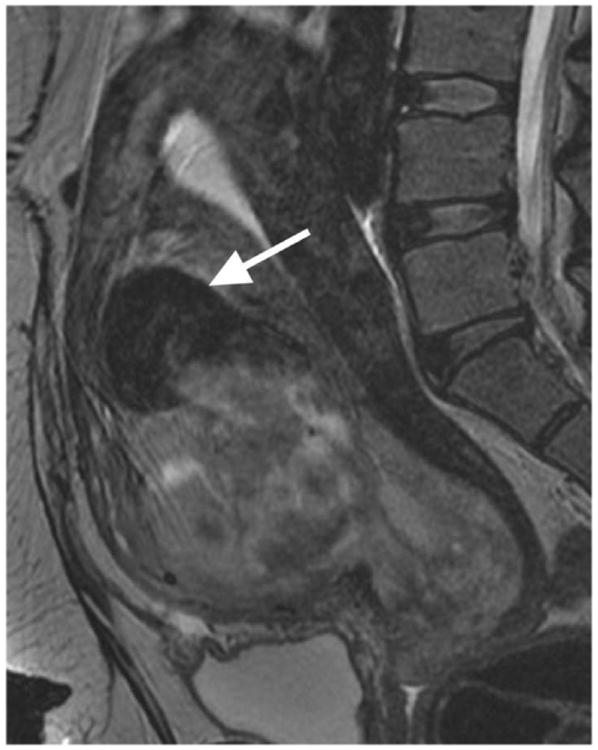
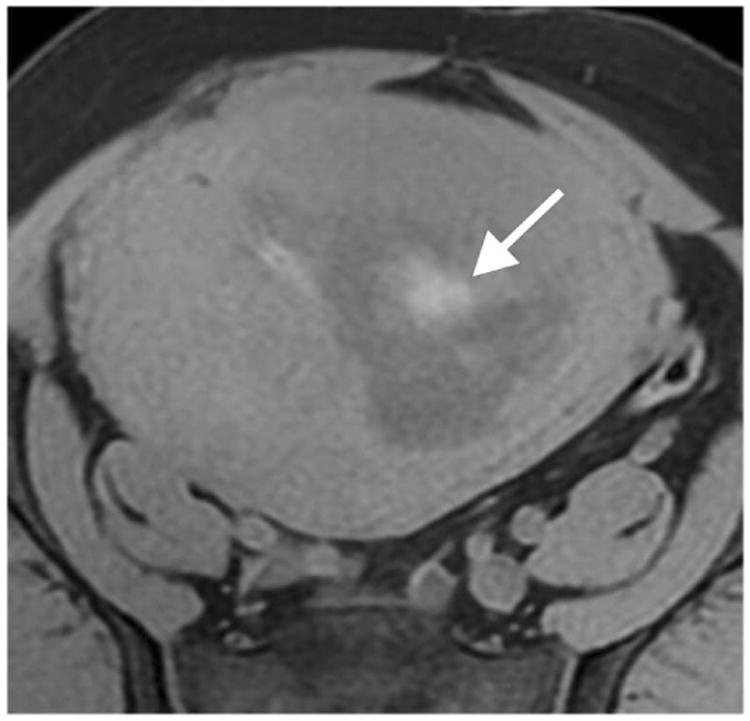
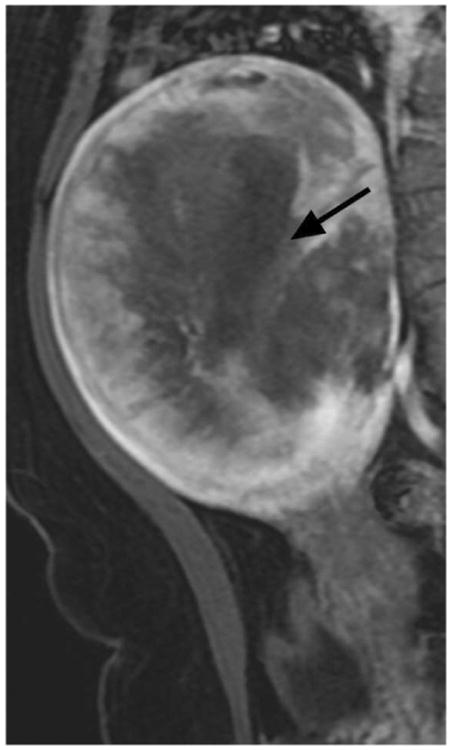
Results: Four qualitative MR features most strongly associated with LMS were nodular borders, haemorrhage, "T2 dark" area(s), and central unenhanced area(s) (p ≤ 0.0001 each feature/reader). The highest sensitivity [1.00 (95%CI:0.82-1.00)/0.95 (95%CI: 0.74-1.00)] and specificity [0.95 (95%CI:0.77-1.00)/1.00 (95%CI:0.85-1.00)] were achieved for R1/R2, respectively, when a lesion had ≥3 of these four features. Sixteen texture features differed significantly between LMS and ALM (p-values: <0.001-0.036). Unsupervised clustering achieved accuracy of 0.75 (sensitivity: 0.70; specificity: 0.79).

Conclusions: Combination of ≥3 qualitative MR features accurately distinguished LMS from ALM. TA was feasible.

Key points: • Four qualitative MR features demonstrated the strongest statistical association with LMS. • Combination of ≥3 these features could accurately differentiate LMS from ALM. • Texture analysis was a feasible semi-automated approach for lesion categorization.

Keywords: Atypical Uterine Leiomyoma; Magnetic Resonance Imaging; Texture Analysis; Uterine Leiomyoma; Uterine Leiomyosarcoma.


Figures

Figure 1
Figure 1
Illustrations of the four qualitative MR features that demonstrated the strongest statistical associations with LMS at histopathology. A. Sagittal T2-weighted image shows a large uterine mass with nodular superior and posterior borders (white arrows). B. Sagittal T2-weighted image demonstrates “T2 dark” area in the myometrial mass (white arrow). C. Noncontrast T1-weighted fat-saturated image illustrates the presence of intra-lesional haemorrhage (white arrow). D. Sagittal contrast-enhanced T1-weighted fat saturated image shows the presence of central unenhanced areas (black arrow).
Figure 1
Figure 1
Illustrations of the four qualitative MR features that demonstrated the strongest statistical associations with LMS at histopathology. A. Sagittal T2-weighted image shows a large uterine mass with nodular superior and posterior borders (white arrows). B. Sagittal T2-weighted image demonstrates “T2 dark” area in the myometrial mass (white arrow). C. Noncontrast T1-weighted fat-saturated image illustrates the presence of intra-lesional haemorrhage (white arrow). D. Sagittal contrast-enhanced T1-weighted fat saturated image shows the presence of central unenhanced areas (black arrow).
Figure 2
Figure 2
A. Axial T2-weighted image illustrates ALM. B - F. Illustration of the intensity-based texture features (energy, contrast, homogeneity, correlation, and entropy) overlaid on the axial T2-weighted image.
Figure 2
Figure 2
A. Axial T2-weighted image illustrates ALM. B - F. Illustration of the intensity-based texture features (energy, contrast, homogeneity, correlation, and entropy) overlaid on the axial T2-weighted image.
Figure 2
Figure 2
A. Axial T2-weighted image illustrates ALM. B - F. Illustration of the intensity-based texture features (energy, contrast, homogeneity, correlation, and entropy) overlaid on the axial T2-weighted image.
Figure 2
Figure 2
A. Axial T2-weighted image illustrates ALM. B - F. Illustration of the intensity-based texture features (energy, contrast, homogeneity, correlation, and entropy) overlaid on the axial T2-weighted image.
Figure 2
Figure 2
A. Axial T2-weighted image illustrates ALM. B - F. Illustration of the intensity-based texture features (energy, contrast, homogeneity, correlation, and entropy) overlaid on the axial T2-weighted image.
Figure 2
Figure 2
A. Axial T2-weighted image illustrates ALM. B - F. Illustration of the intensity-based texture features (energy, contrast, homogeneity, correlation, and entropy) overlaid on the axial T2-weighted image.
Figure 3
Figure 3
A. Axial T2-weighted image illustrates LMS. B - F. Illustration of the intensity-based texture features (energy, contrast, homogeneity, correlation, and entropy) overlaid on the axial T2-weighted image.
Figure 3
Figure 3
A. Axial T2-weighted image illustrates LMS. B - F. Illustration of the intensity-based texture features (energy, contrast, homogeneity, correlation, and entropy) overlaid on the axial T2-weighted image.
Figure 3
Figure 3
A. Axial T2-weighted image illustrates LMS. B - F. Illustration of the intensity-based texture features (energy, contrast, homogeneity, correlation, and entropy) overlaid on the axial T2-weighted image.
Figure 3
Figure 3
A. Axial T2-weighted image illustrates LMS. B - F. Illustration of the intensity-based texture features (energy, contrast, homogeneity, correlation, and entropy) overlaid on the axial T2-weighted image.
Figure 3
Figure 3
A. Axial T2-weighted image illustrates LMS. B - F. Illustration of the intensity-based texture features (energy, contrast, homogeneity, correlation, and entropy) overlaid on the axial T2-weighted image.
Figure 3
Figure 3
A. Axial T2-weighted image illustrates LMS. B - F. Illustration of the intensity-based texture features (energy, contrast, homogeneity, correlation, and entropy) overlaid on the axial T2-weighted image.
Figure 4
Figure 4
A plot demonstrating the results of self-tuning spectral clustering. To facilitate the ease of illustration, only three of 16 texture features with statistically significant difference between LMS and ALM were used to generate this figure. Self-tuning spectral clustering identified a total of four distinct data clusters (C1 though C4) that comprised of one ALM (star) grouping and 3 LMS (blue, orange, and purple circles) groupings.

References

    1. Ryan GL, Syrop CH, Van Voorhis BJ. Role, epidemiology, and natural history of benign uterine mass lesions. Clin Obstet Gynecol. 2005;48:312–324. - PubMed
    1. Wallach EE, Vlahos NF. Uterine myomas: an overview of development, clinical features, and management. Obstet Gynecol. 2004;104:393–406. - PubMed
    1. Owen C, Armstrong AY. Clinical management of leiomyoma. Obstet Gynecol Clin North Am. 2015;42:67–85. - PubMed
    1. Wu TI, Yen TC, Lai CH. Clinical presentation and diagnosis of uterine sarcoma, including imaging. Best Pract Res Clin Obstet Gynaecol. 2011;25:681–689. - PubMed
    1. D'Angelo E, Prat J. Uterine sarcomas: a review. Gynecol Oncol. 2010;116:131–139. - PubMed

LinkOut - more resources