. 2016 Dec 6:7:13701.
doi: 10.1038/ncomms13701.

MEK inhibitors block growth of lung tumours with mutations in ataxia-telangiectasia mutated

Affiliations

MEK inhibitors block growth of lung tumours with mutations in ataxia-telangiectasia mutated

Michal Smida et al. Nat Commun. .

Abstract

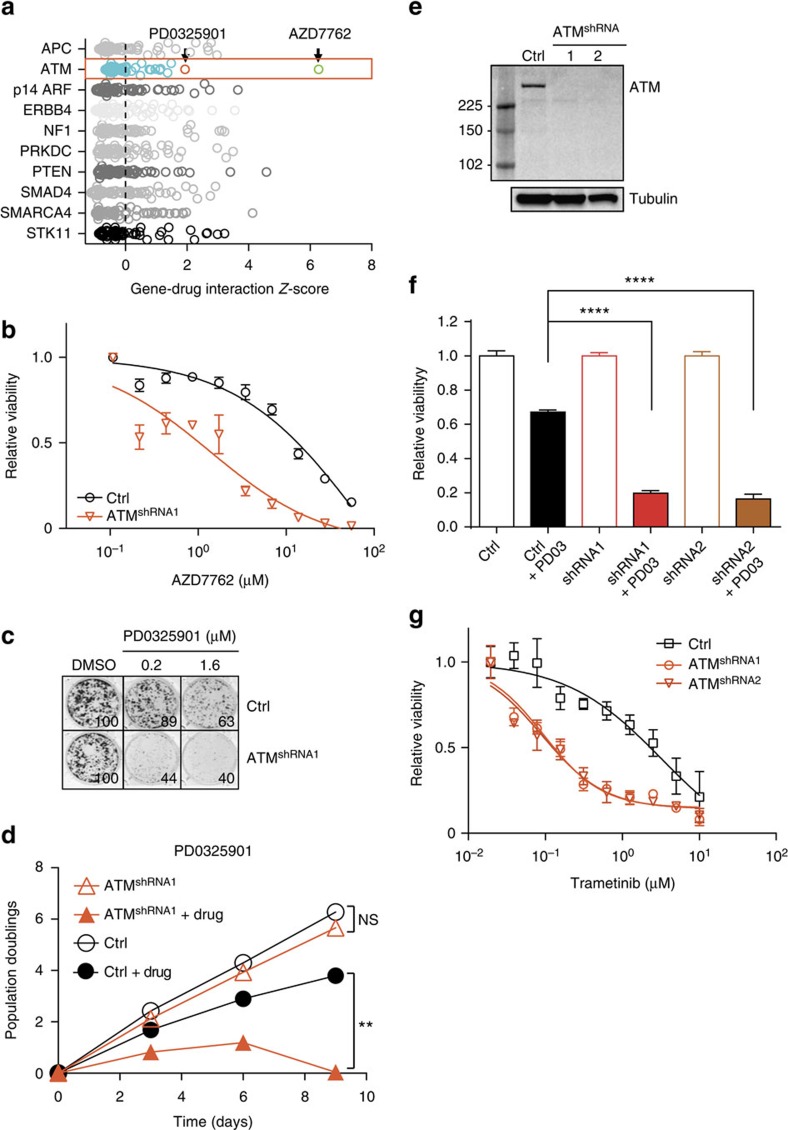
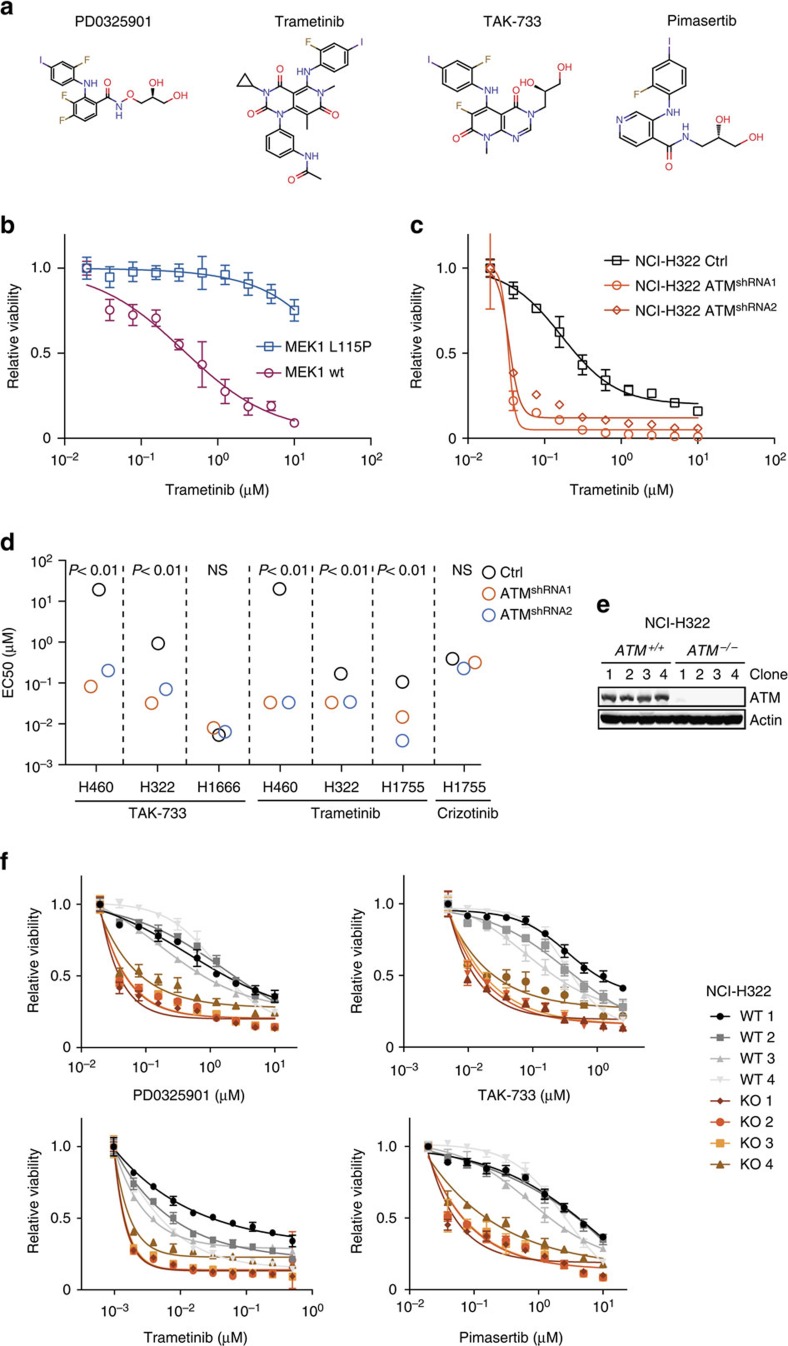
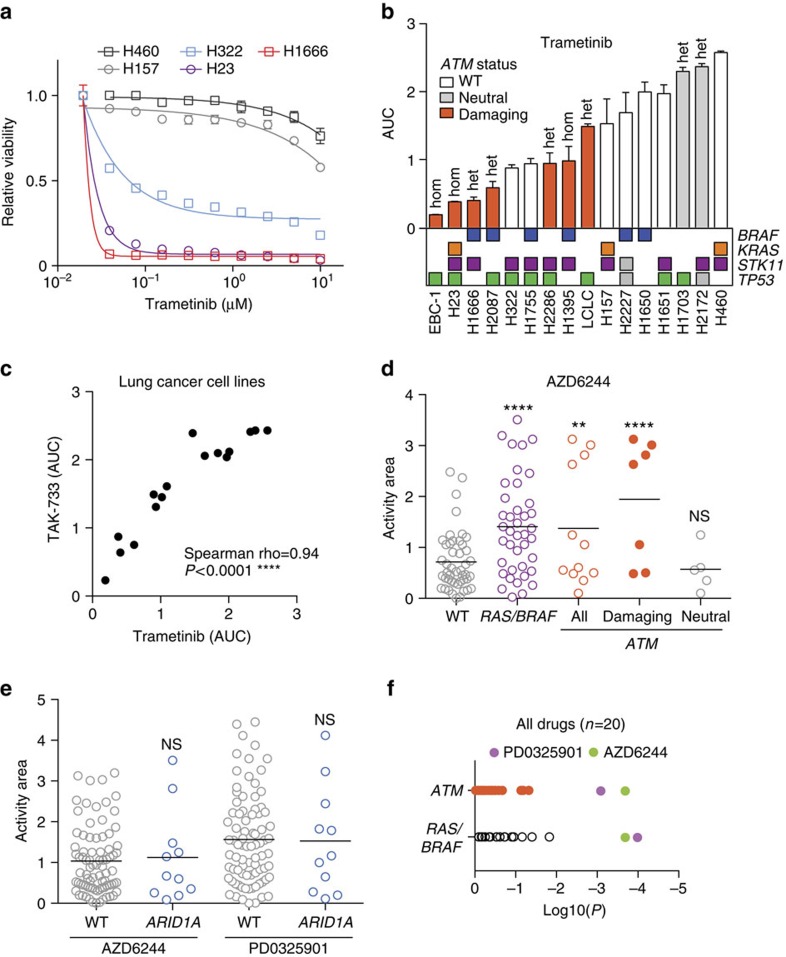
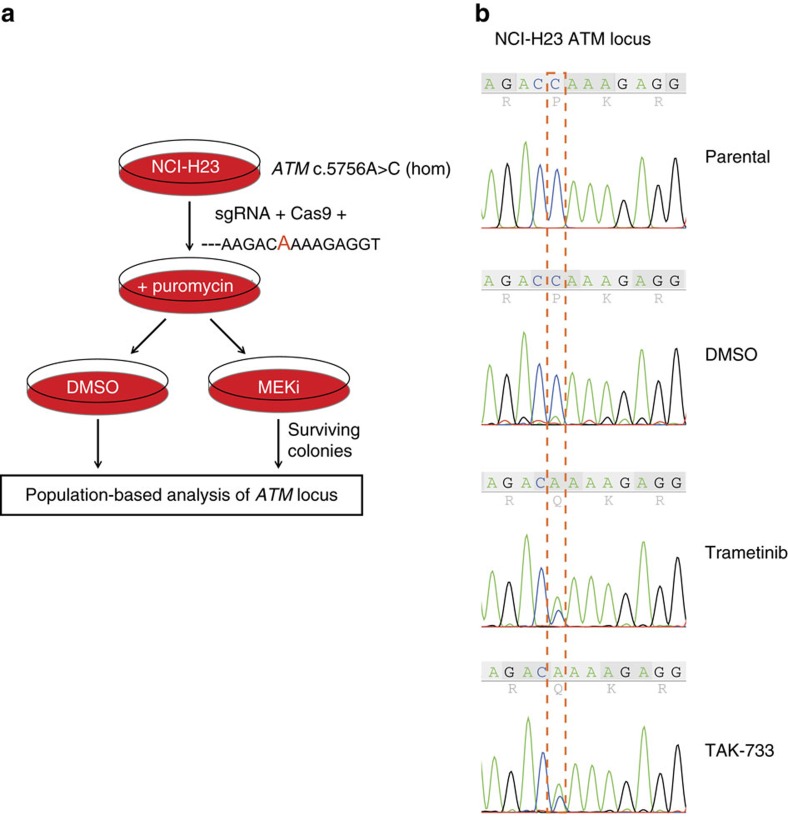
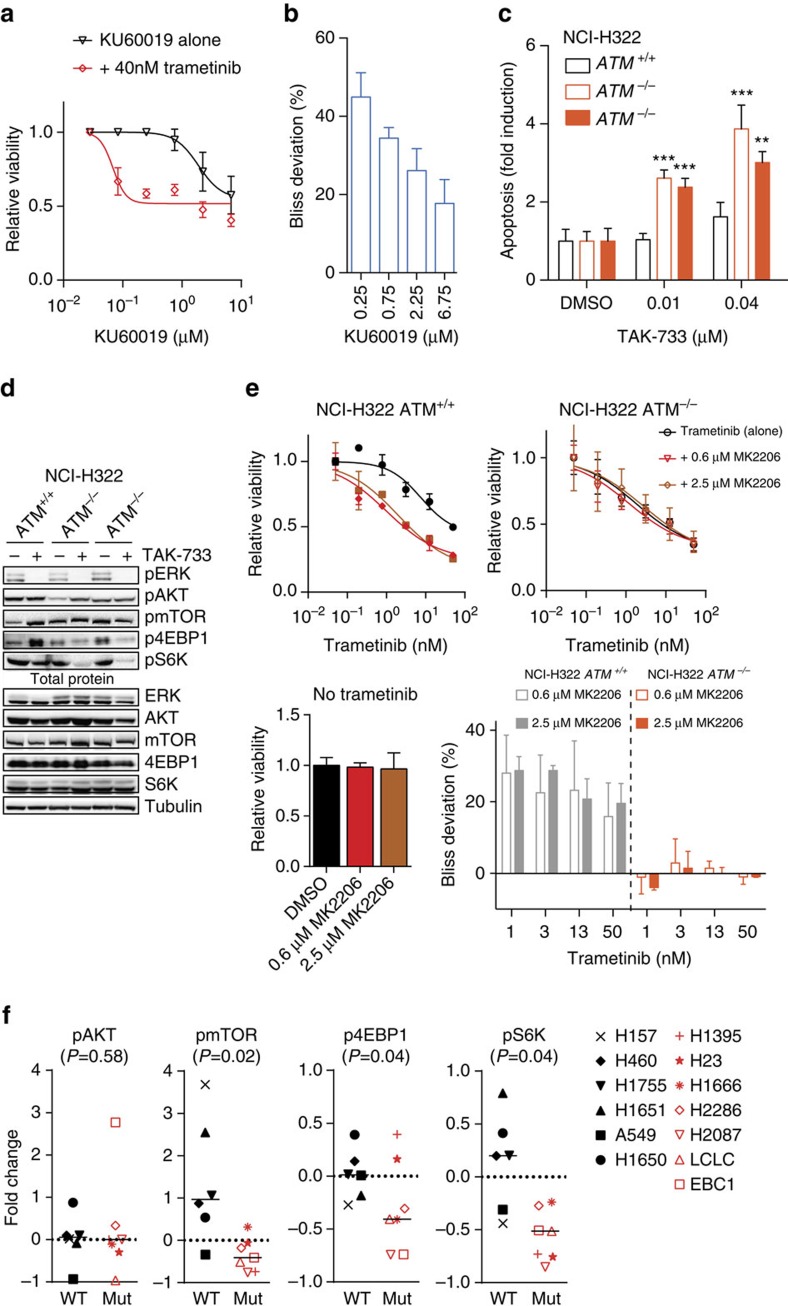
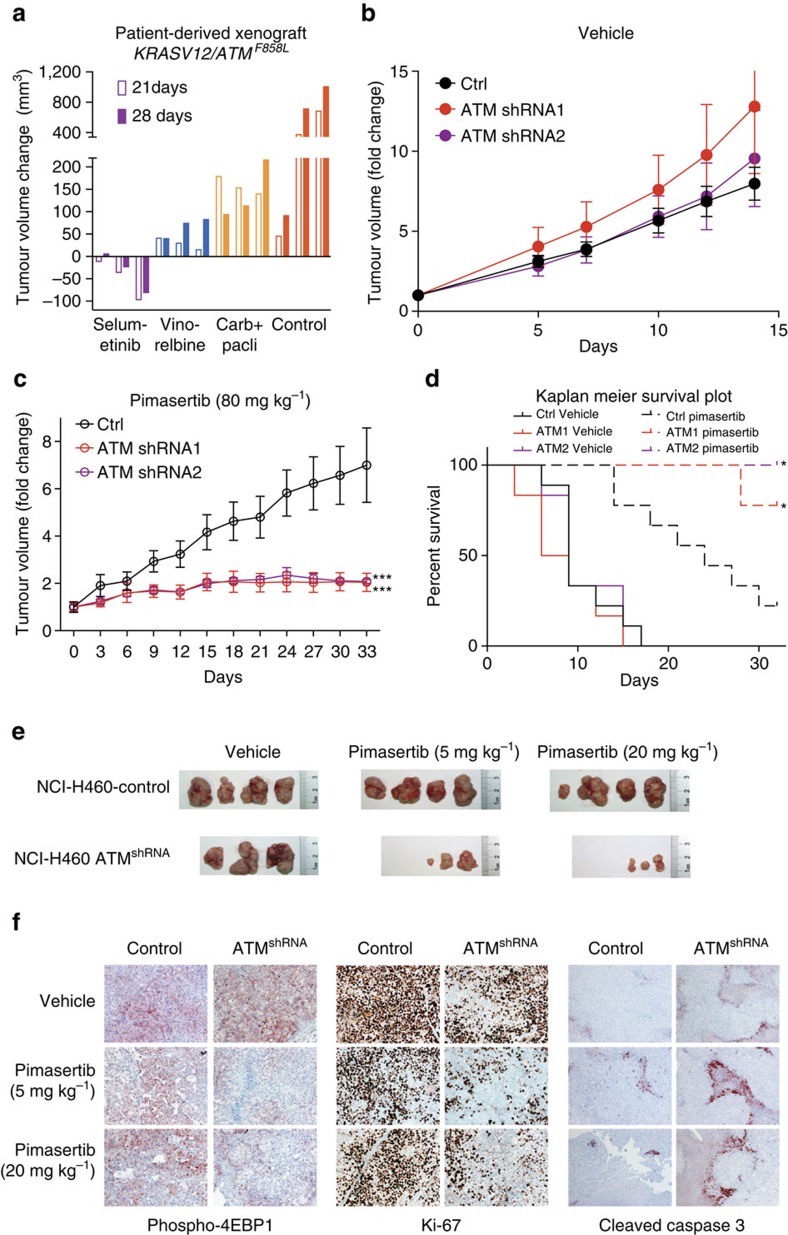
Lung cancer is the leading cause of cancer deaths, and effective treatments are urgently needed. Loss-of-function mutations in the DNA damage response kinase ATM are common in lung adenocarcinoma but directly targeting these with drugs remains challenging. Here we report that ATM loss-of-function is synthetic lethal with drugs inhibiting the central growth factor kinases MEK1/2, including the FDA-approved drug trametinib. Lung cancer cells resistant to MEK inhibition become highly sensitive upon loss of ATM both in vitro and in vivo. Mechanistically, ATM mediates crosstalk between the prosurvival MEK/ERK and AKT/mTOR pathways. ATM loss also enhances the sensitivity of KRAS- or BRAF-mutant lung cancer cells to MEK inhibition. Thus, ATM mutational status in lung cancer is a mechanistic biomarker for MEK inhibitor response, which may improve patient stratification and extend the applicability of these drugs beyond RAS and BRAF mutant tumours.


Figures

Figure 1
Figure 1. Chemical genetic screen reveals MEK inhibitor sensitivity of ATM-depleted cells.
(a) Gene–drug interaction screen in AALE cells (see Methods). Synthetic lethal drug interactions are sorted based on Z-score for each indicated tumour suppressor. The interactions between ATM and AZD7762 (green circle) and PD0325901 (red circle) are indicated with black arrows. (b) Dose–response curve with the Chk1/2 inhibitor AZD7762. AALE cells were infected as indicated and treated with the drug for 3 days. Displayed is the relative viability that is calculated by normalizing the raw CellTiter-Glo data to the vehicle (DMSO) treated controls. Error bars indicate s.d. (n=3). (c) Colony formation of AALE cells infected with ATM shRNA or control virus and treated with PD0325901 for 10 days. Shown is a representative example (n=3). Numbers in the bottom right corners indicate quantification relative to DMSO-treated samples. (d) Growth curves of indicated AALE cell lines treated with PD0325901 (1 μM). Cells were counted and passaged every 3 days and seeded at equal densities. **P<0.01, two-sided t-test (n=2 biological replicates). (e) Western blot analysis of AALE cells infected with ATM knockdown vectors. (f) Cell viability of AALE cells infected with indicated vectors and treated with PD0325901 for 3 days. Data are normalized to vehicle (DMSO). Indicated are s.d.'s. ****P<0.0001, two-sided t-test (n=3). (g) Relative cell viability of AALE cells stably infected with ATM shRNA or control viruses and treated with trametinib for 3 days. Data are normalized to vehicle (DMSO). Error bars indicate s.d.'s (n=3).
Figure 2
Figure 2. ATM loss-of-function in lung cancer cell lines triggers MEK inhibitor sensitivity.
(a) Chemical structures of MEK inhibitors used in this study. (b) Dose–response experiment of ATM knockdown (shRNA1) AALE cells infected with the indicated MEK1 expression vectors and treated with trametinib for 3 days. Data are normalized to vehicle-treated cells. Error bars indicate s.d.'s (n=3). (c) Dose–response experiment of ATM knockdown NCI-H322 cells treated with trametinib for 5 days. Data are normalized to vehicle-treated cells. Error bars indicate s.d.'s (n=3). (d) Effective concentration resulting in 50% growth inhibitory effect (EC50) is depicted for indicated cell line and compound combinations. The EC50 for the unresponsive control NCI-H460 cells was set to 20 μM. (e) Western blot analysis of CRISPR/Cas9 edited NCI-H322 clones. (f) Dose–response experiment of NCI-H322 cells in which both ATM alleles have been inactivated (four KO clones) or unedited control (four WT clones) treated with PD0325901, TAK-733, trametinib or pimasertib for 5 days. Data are normalized to vehicle-treated cells. Error bars indicate s.d.'s (n=3).
Figure 3
Figure 3. Cancer-associated ATM mutations predict MEK inhibitor sensitivity.
(a) Representative dose–response curves for sensitive and resistant lung cancer cell lines treated with trametinib for 5 days and normalized to vehicle control. Error bars indicate s.d.'s (n=3). KRAS/BRAF genotypes for indicated cell lines: NCI-H460: KRAS-Q61H; NCI-H322: None; NCI-H23: KRAS-G12C; NCI-H1666: BRAF-G466V; NCI-H157: KRAS-G12R. (b) Sensitivity of indicated 16 cell lines to trametinib. Shown is the area under curve (AUC) derived from dose–response experiments as in a. When applicable, the heterozygous (het) or homozygous (hom) mutational status of ATM is indicated above the bars and mutational status for selected genes is indicated below. Error bars indicate s.d.'s (n=3). (c) Area under curve values derived from dose–response experiments with TAK-733 and trametinib for 16 lung cancer cell lines. (d) Sensitivity of lung cancer cell lines in the Cancer Cell Line Encyclopedia (CCLE) to the MEK inhibitor AZD6244 (selumetinib). High activity area score (area above the curve=AAS) indicates drug sensitivity. Each circle indicates a single cell line and cell lines are grouped according to genotype (WT=wild type for K-Ras, H-Ras, N-Ras, BRAF, c-RAF and ATM; ATM=ATM mutant; RAS=K-Ras, H-Ras or N-Ras mutant). ATM mutations are labelled according to PolyPhen predictions (damaging >0.9, neutral <0.9). Black bar indicates mean AAS. **P<0.01, ****P<0.0001, NS=not significant, two-sided t-test compared with WT group. (e) Analysis as in d for ARID1A mutant or wild-type cell lines for sensitivity to indicated MEK inhibitors. NS=not significant, two-sided t-test. (f) Analysis of ATM or RAS/BRAF mutant cell lines for response to drugs (n=20) in CCLE data set. Indicated is the P value for each drug.
Figure 4
Figure 4. Restoration of ATM point mutation renders cells resistant to MEK inhibition.
(a) Schematic outline of CRISPR/Cas9 rescue experiment in ATM mutant NCI-H23 cells. (b) Sanger sequence chromatogram of cells treated as in a. Red dashed box indicates the mutant cytosine (C) that is replaced by adenosine (A).
Figure 5
Figure 5. ATM loss-of-function dampens AKT/mTOR signalling.
(a,b) Drug synergy experiment in AALE cells with ATM inhibitor (KU60019) and trametinib (40 nM). Displayed is relative cell viability for KU60019 treatment alone and for co-treatment with trametinib. Error bars indicate s.d. (n=3). (b) Deviation from Bliss additivity calculated from experiment in a. Error bars indicate s.d. (n=3). (c) Fold induction of apoptotic cells after 3-day compound or vehicle (DMSO) treatment, as measured by annexin V positivity. Error bars indicate s.d.'s (n=4). **P<0.01, ***P<0.001, two-way ANOVA with Holm Sidak multiple comparisons correction. (d) Western blot analysis of ATM knockout and control NCI-H322 cells treated with TAK-733 (1.0 μM, 6 h) with indicated antibodies (pERK (T202/204); pAKT (S473); p-mTOR (S2448); p4EBP1 (T37/46); pS6K (T389)). Shown is a control and two independent knockout clones. For d, a representative blot for tubulin is used as loading control. (e) Drug synergy experiment on NCI-H322 control (+/+) and ATM knockout (−/−) cells treated with trametinib simultaneously with DMSO or two different concentrations of AKT inhibitor (MK2206). Relative cell viability is shown as dose–response curves. Effect of single MK2206 treatment on cell viability in the absence of trametinib is shown below as the bar graph. Deviation from Bliss additivity calculated for both control (grey bars) and knockout (red bars) cells for indicated concentrations is shown bottom right. Error bars indicate s.d. (n=3). (f) Phosphorylation of indicated targets (pERK (T202/204); pAKT (S473); p-mTOR (S2448); p4EBP1 (T37/46); pS6K (T389)) in response to TAK-733 treatment (1.0 μM, 6 h) is shown as a fold change compared with DMSO-treated baseline (dashed line). Data were determined by quantification of digital western blot images in ImageJ for six wild-type (black symbols) and seven ATM mutant (red symbols) lung cancer cell lines. Median for each group is displayed as the horizontal line. Two-sided t-test was used to calculate the P values.
Figure 6
Figure 6. ATM depletion sensitizes tumours in vivo to MEK inhibition.
(a) Patient-derived xenograft model with KRAS and ATM mutations. Displayed is the change in tumour volume compared with baseline at 21 and 28 days post treatment for the indicated treatments. Day 21 control versus selumetinib P<0.05; day 28 control versus selumetinib P<0.05. Two-sided t-test (n=3 biological replicates). (b) Growth of control, ATM shRNA1 and ATM shRNA2 NCI-H460 xenografts. (c) As in b treated daily with the MEK inhibitor pimasertib (80 mg kg−1 p.o.). Shown is the mean and standard error. ***P<0.001 (n=8, two-sided t-test). (d) Kaplan–Meier survival curve of mice as in b,c. Control-pimasertib versus ATMshRNA1 or ATMshRNA2 P<0.05, Log rank Mantel–Cox test. (e) Macroscopic images of excised H460 tumours treated as indicated daily for 14 days. (f) Immunohistochemistry staining of NCI-H460 tumours as in e at 14 days.

References

    1. Marshall E. Cancer research and the $90 billion metaphor. Science 331, 1540–1541 (2011). - PubMed
    1. Imielinski M. et al.. Mapping the hallmarks of lung adenocarcinoma with massively parallel sequencing. Cell 150, 1107–1120 (2012). - PMC - PubMed
    1. Govindan R. et al.. Genomic landscape of non-small cell lung cancer in smokers and never-smokers. Cell 150, 1121–1134 (2012). - PMC - PubMed
    1. Cancer Genome Atlas Research, N. Comprehensive molecular profiling of lung adenocarcinoma. Nature 511, 543–550 (2014). - PMC - PubMed
    1. Ding L. et al.. Somatic mutations affect key pathways in lung adenocarcinoma. Nature 455, 1069–1075 (2008). - PMC - PubMed

Publication types

MeSH terms