. 2016 Dec 6:6:38385.
doi: 10.1038/srep38385.

Proteomic profiling reveals that collismycin A is an iron chelator

Affiliations

Proteomic profiling reveals that collismycin A is an iron chelator

Makoto Kawatani et al. Sci Rep. .

Abstract

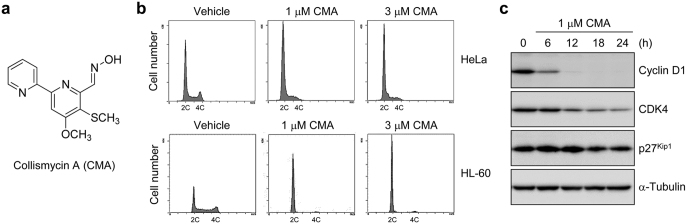
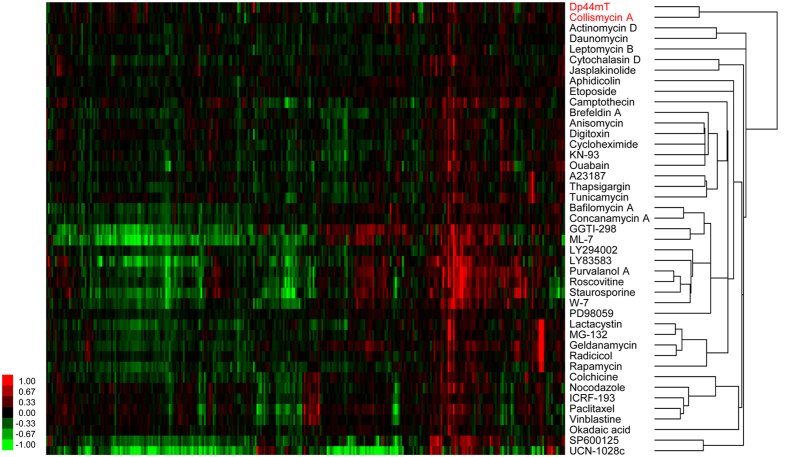
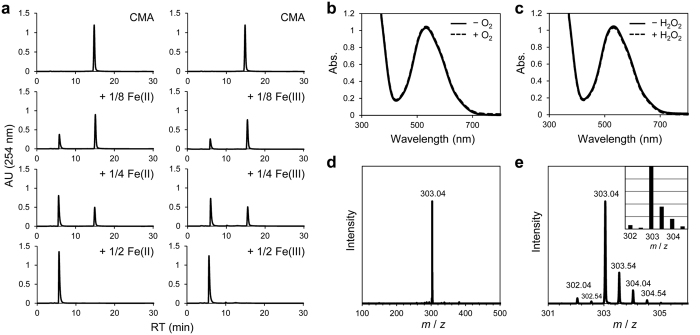
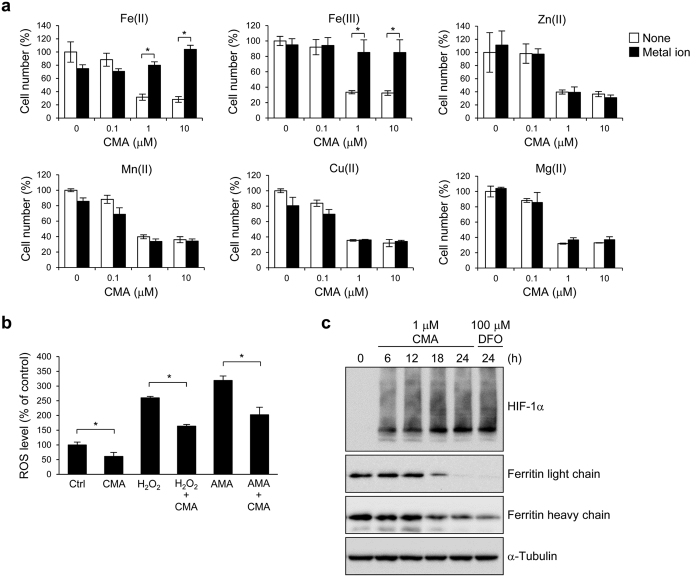
Collismycin A (CMA), a microbial product, has anti-proliferative activity against cancer cells, but the mechanism of its action remains unknown. Here, we report the identification of the molecular target of CMA by ChemProteoBase, a proteome-based approach for drug target identification. ChemProteoBase profiling showed that CMA is closely clustered with di-2-pyridylketone 4,4-dimethyl-3-thiosemicarbazone, an iron chelator. CMA bound to both Fe(II) and Fe(III) ions and formed a 2:1 chelator-iron complex with a redox-inactive center. CMA-induced cell growth inhibition was completely canceled by Fe(II) and Fe(III) ions, but not by other metal ions such as Zn(II) or Cu(II). Proteomic and transcriptomic analyses showed that CMA affects the glycolytic pathway due to the accumulation of HIF-1α. These results suggest that CMA acts as a specific iron chelator, leading to the inhibition of cancer cell growth.


Figures

Figure 1
Figure 1. CMA arrests cell cycle at the G1 phase.
(a) Structure of CMA. (b) Effect of CMA on the cell cycle. HeLa or HL-60 cells were treated with the indicated concentrations of CMA for 12 h, and then analyzed by flow cytometry after propidium iodide staining. (c) CMA decreases the expression of cyclin D1. HeLa cells were treated with 1 μM CMA for the indicated times. Cell lysates were immunoblotted with anti-cyclin D1, anti-CDK4, anti-p27Kip1, and anti-α-tubulin.
Figure 2
Figure 2. Cluster analysis by ChemProteoBase profiling.
HeLa cells were treated with 5 μM CMA for 18 h, and proteomic analysis was performed by the 2-D DIGE system. Quantitative data of the 296 common spots (x-axis) derived from CMA and those of 42 well-characterized compounds were analyzed by hierarchical clustering. In the heat map, log-fold (natural base) of the normalized volume is shown on the colored scale.
Figure 3
Figure 3. CMA forms 2:1 chelator-iron complex.
(a) CMA binds to both Fe(II) and Fe(III) ions. The mixed solutions of CMA with various concentrations of Fe(II) or Fe(III) ion were analyzed by HPLC. (b) Absorption spectra in the formation of Fe(II)-(CMA)2 complex (solid line) and after the reaction of the complex with O2 (dashed line). (c) Absorption spectra in the formation of Fe(II)-(CMA)2 complex (solid line) and after the reaction of the complex with H2O2 (dashed line). (d,e) ESI-mass spectra of isolated Fe(II)-(CMA)2 complex (inset: calculated isotope pattern of positive ion clusters at m/z 303.0).
Figure 4
Figure 4. CMA acts as a specific iron chelator.
(a) The addition of Fe(II) and Fe(III) ions rescue cells from CMA-induced growth inhibition. HeLa cells were treated with the indicated concentrations of CMA in the presence or absence of 10 μM FeCl2, 10 μM FeCl3, 10 μM ZnCl2, 1 μM MnCl2, 1 μM CuCl2, or 10 μM MgCl2 for 72 h, and cell growth was analyzed by WST-8 assay. Data are shown as the mean ± SD (n = 3). Statistical analysis was performed by using ANOVA followed by Tukey-Kramer test. *P < 0.01. (b) CMA decreases intracellular ROS level. HL-60 cells were pretreated with 1 μM CMA for 30 min and were treated with 1 mM H2O2 or 100 nM antimycin A (AMA) for 1 h. The ROS level was measured by flow cytometry using carboxy-H2DCF-DA labeling. Data are shown as the mean ± SD (n = 3). Statistical analysis was performed by using ANOVA followed by Tukey-Kramer test. *P < 0.01. (c) CMA markedly induces the expression of HIF-1α. HeLa cells were treated with 1 μM CMA or 100 μM DFO for the indicated times. Cell lysates were immunoblotted with anti-HIF-1α, anti-ferritin light chain, anti-ferritin heavy chain, and anti-α-tubulin.

References

    1. Newman D. J. & Cragg G. M. Natural products as sources of new drugs over the 30 years from 1981 to 2010. J. Nat. Prod. 75, 311–335 (2012). - PMC - PubMed
    1. Osada H. Development and application of bioprobes for mammalian cell cycle analyses. Curr. Med. Chem. 10, 727–732 (2003). - PubMed
    1. Futamura Y., Muroi M. & Osada H. Target identification of small molecules based on chemical biology approaches. Mol. Biosyst. 9, 897–914 (2013). - PubMed
    1. Kawatani M. & Osada H. Affinity-based target identification for bioactive small molecules. MedChemCommun 5, 277–287 (2014).
    1. Kawatani M. et al.. The identification of an osteoclastogenesis inhibitor through the inhibition of glyoxalase I. Proc. Natl. Acad. Sci. USA 105, 11691–11696 (2008). - PMC - PubMed

Publication types

MeSH terms