. 2016 Dec 6:6:38350.
doi: 10.1038/srep38350.

Convex Analysis of Mixtures for Separating Non-negative Well-grounded Sources

Affiliations

Convex Analysis of Mixtures for Separating Non-negative Well-grounded Sources

Yitan Zhu et al. Sci Rep. .

Abstract

Blind Source Separation (BSS) is a powerful tool for analyzing composite data patterns in many areas, such as computational biology. We introduce a novel BSS method, Convex Analysis of Mixtures (CAM), for separating non-negative well-grounded sources, which learns the mixing matrix by identifying the lateral edges of the convex data scatter plot. We propose and prove a sufficient and necessary condition for identifying the mixing matrix through edge detection in the noise-free case, which enables CAM to identify the mixing matrix not only in the exact-determined and over-determined scenarios, but also in the under-determined scenario. We show the optimality of the edge detection strategy, even for cases where source well-groundedness is not strictly satisfied. The CAM algorithm integrates plug-in noise filtering using sector-based clustering, an efficient geometric convex analysis scheme, and stability-based model order selection. The superior performance of CAM against a panel of benchmark BSS techniques is demonstrated on numerically mixed gene expression data of ovarian cancer subtypes. We apply CAM to dissect dynamic contrast-enhanced magnetic resonance imaging data taken from breast tumors and time-course microarray gene expression data derived from in-vivo muscle regeneration in mice, both producing biologically plausible decomposition results.


Figures

Figure 1
Figure 1. Illustration of a convex cone C{B} with three edges in three dimensional space.
Lines with an arrow are the axes. Bold lines are edges b1, b2and b3. The cross-section of convex cone C{B} is a triangle, indicated by grey color. The star markers on the edges are well-grounded points. v is a point outside of C{B}. Its projection on C{B} is formula image 
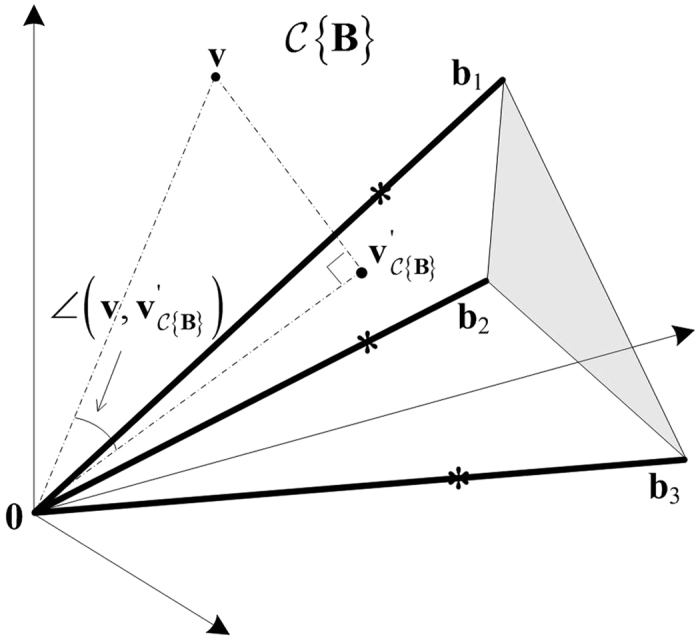
denotes the angle between two input vectors.
Figure 2
Figure 2. Illustration of sector-based clustering in a three-dimensional scatter plot.
Four sources (K = 4) are mixed to form three mixtures (M = 3). Small circles are data points. After clustering, each data sector is represented by a sector central ray (solid lines). Four data sectors are on (or close to) the true edges of cone C{X}, with their sector central rays indicated by bold lines. The quadrilateral formed by the dashed lines indicate the intersection of the cone.
Figure 3
Figure 3. Perspective projection of the 800 large-norm data points in the simulation dataset onto the 2-D intersection of the convex cone formed by the data points.
Perspective projection performs simple positive scaling of data points to make every data point have unit element sum. Black dots are data points. Each data point is connected to its sector central ray by a line. Red circles indicate the edges detected by applying the lateral edge detection algorithm on the sector central rays. Blue diamond markers indicate the positions of true mixing matrix column vectors. The three edges that minimize the model fitting error among all three-edge sets are indicated by arrows.
Figure 4
Figure 4. CAM analysis result on breast cancer DCE-MRI data.
(a) MRI images of a breast tumor taken at sequential time points after the injection of molecular contrast agent into blood. (b) Tracer concentration changes of the three identified compartments over time. (c) Recovered source images of the three compartments.
Figure 5
Figure 5. Time activity curves of the four sources detected on the 27 time-point skeletal muscle regeneration gene expression dataset.

References

    1. Lee D. D. & Seung H. S. Learning the parts of objects by non-negative matrix factorization. Nature 401, 788–791 (1999). - PubMed
    1. Hillman E. M. C. & Moore A. All-optical anatomical co-registration for molecular imaging of small animals using dynamic contrast. Nat. Photonics 1, 526–530 (2007). - PMC - PubMed
    1. Chen L. et al.. Tissue-specific compartmental analysis for dynamic contrast-enhanced MR imaging of complex tumors. IEEE Trans. Med. Imaging 30, 2044–2058, doi: 10.1109/TMI.2011.2160276 (2011). - DOI - PMC - PubMed
    1. Wang F. Y., Chi C. Y., Chan T. H. & Wang Y. Nonnegative least-correlated component analysis for separation of dependent sources by volume maximization. IEEE Trans. Pattern Anal. Mach. Intell. 32, 875–888, doi: 10.1109/TPAMI.2009.72 (2010). - DOI - PubMed
    1. Chan T.-H., Ma W.-K., Chi C.-Y. & Wang Y. A convex analysis framework for blind separation of non-negative sources. IEEE Trans. Signal Proces. 56, 5120–5134 (2008).

Publication types

MeSH terms