. 2016 Sep 12;8(11):2667-2688.
doi: 10.18632/aging.101032.

The progeroid gene BubR1 regulates axon myelination and motor function

Affiliations

The progeroid gene BubR1 regulates axon myelination and motor function

Chan-Il Choi et al. Aging (Albany NY). .

Abstract

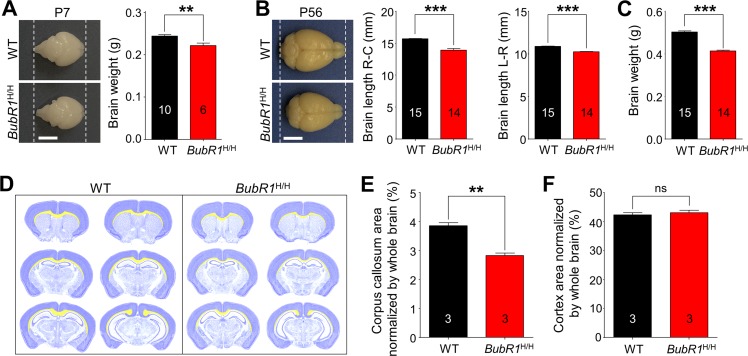
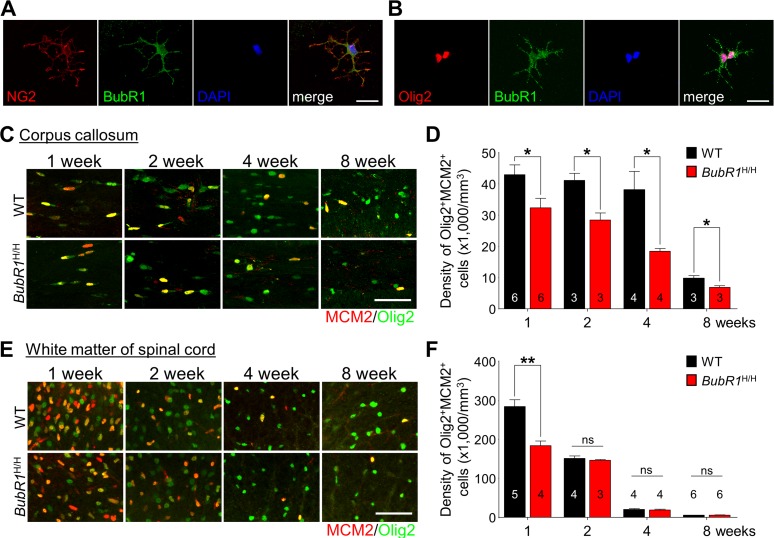
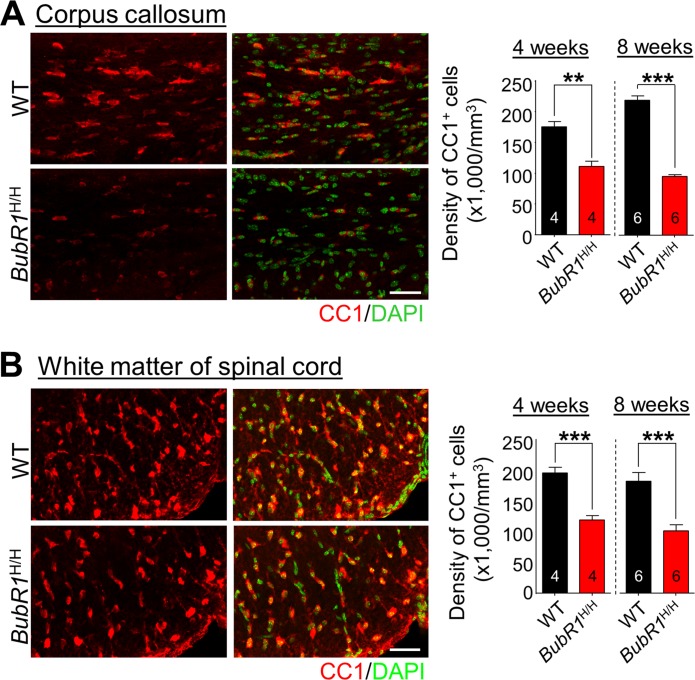
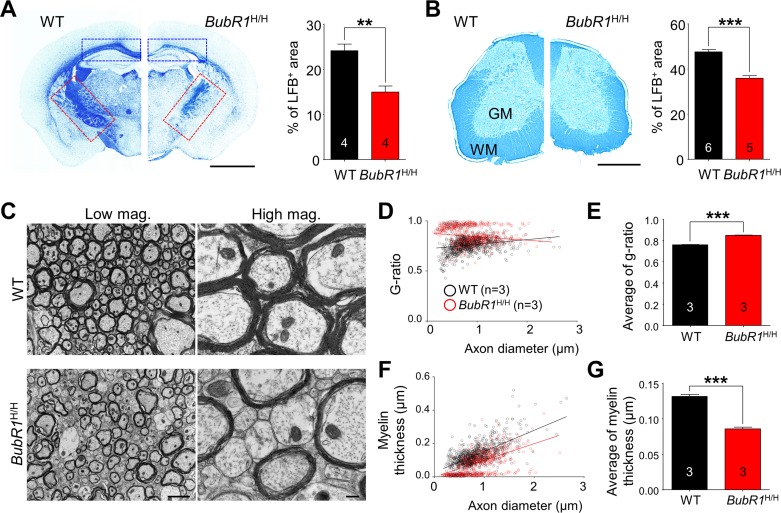
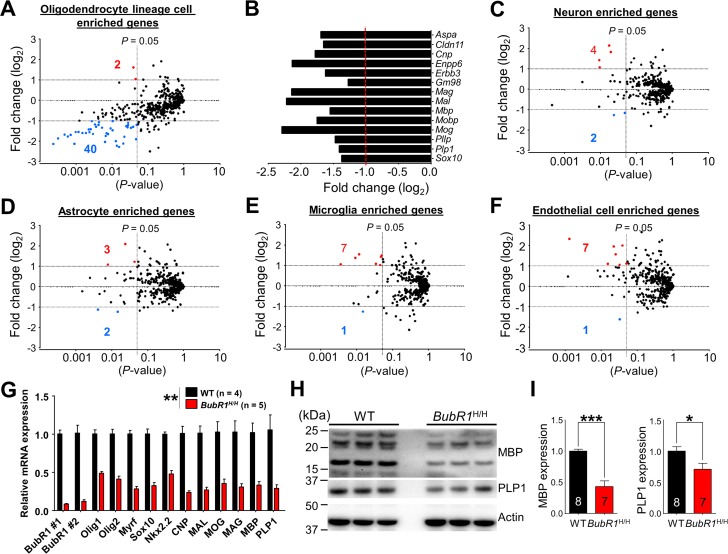
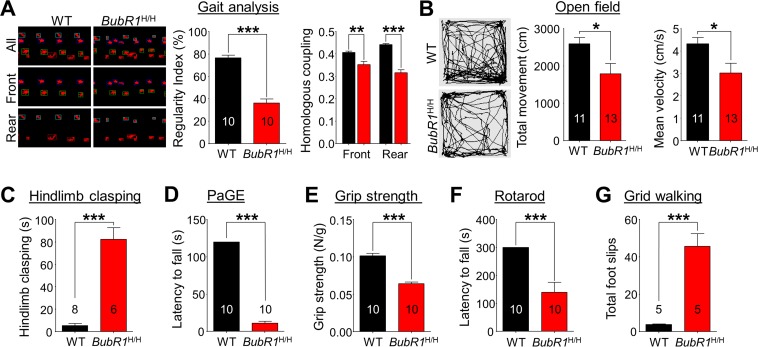
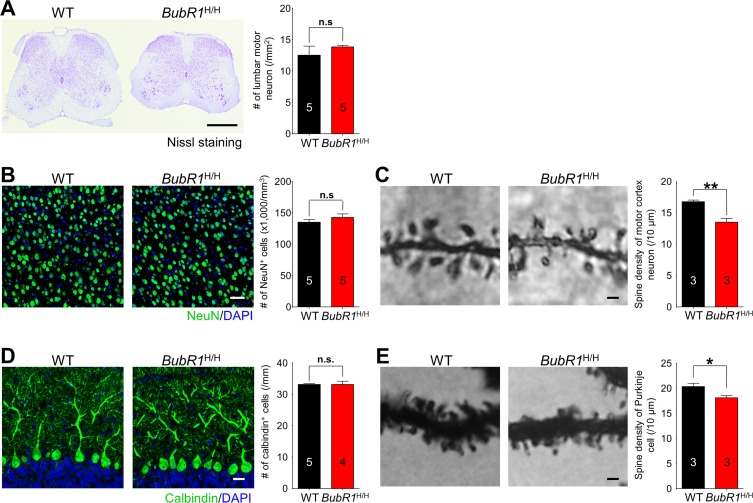
Myelination, the process by which oligodendrocytes form the myelin sheath around axons, is key to axonal signal transduction and related motor function in the central nervous system (CNS). Aging is characterized by degenerative changes in the myelin sheath, although the molecular underpinnings of normal and aberrant myelination remain incompletely understood. Here we report that axon myelination and related motor function are dependent on BubR1, a mitotic checkpoint protein that has been linked to progeroid phenotypes when expressed at low levels and healthy lifespan when overabundant. We found that oligodendrocyte progenitor cell proliferation and oligodendrocyte density is markedly reduced in mutant mice with low amounts of BubR1 (BubR1H/H mice), causing axonal hypomyelination in both brain and spinal cord. Expression of essential myelin-related genes such as MBP and PLP1 was significantly reduced in these tissues. Consistent with defective myelination, BubR1H/H mice exhibited various motor deficits, including impaired motor strength, coordination, and balance, irregular gait patterns and reduced locomotor activity. Collectively, these data suggest that BubR1 is a key determinant of oligodendrocyte production and function and provide a molecular entry point to understand age-related degenerative changes in axon myelination.

Keywords: BubR1; corpus callosum; motor function; myelination; oligodendrocytes; spinal cord.


Conflict of interest statement

The authors declare no competing financial interests.

Figures

Figure 1
Figure 1. Morphological characterization of BubR1 insufficient mice
(A-C) Reduced size of BubR1H/H mouse brain. (A) Representative photographs of WT and BubR1H/H mice at postnatal day 7 (P7) and quantification of brain weight. Scale bar: 0.5 cm. (B) Representative photographs of WT and BubR1H/H mice at postnatal day 56 (P56; 8-week-old). Scale bar: 0.5 cm. BubR1H/H exhibit a significantly reduced brain size including rostrocaudal (R-C) length, and width (L-R) (B) and weight (C). (D-F) Deficits in corpus callosum formation in BubR1 insufficient mice. (D) Representative images of quantification of cortex and corpus callosum area relative to total section area using cresyl violet stained sections. The cortex is highlighted in dark blue, the corpus callosum is highlighted in yellow. Measurements of the corpus callosum, and cortex area. Arre of the corpus callosum in BubR1 insufficient mouse is significantly different from WT mice (E), while cortical area is not (F). All values represent mean ± SEM (ns = non-significant, **P < 0.01, ***P < 0.001, student's t-test). Number associated with bar graphs indicates number of animals examined.
Figure 2
Figure 2. BubR1 insufficiency impairs OPCs proliferation during oligodendrocyte development in the CNS
(A-B) BubR1 expression in isolated primary oligodendrocyte progenitor cells. Representative image of NG2+ cell (a marker for oligodendrocyte progenitor cells) (A). Representative image of Olig2+ cell (a marker for oligodendrocyte lineage cells) (B). Scale bar: 25 μm for (A) and (B). (C-D) The number of proliferating oligodendrocyte lineage cells in the corpus callosum. (C) Representative images of MCM2+Olig2+ cells within the corpus callosum at 1, 2, 4, and 8 weeks old. (D) Quantification of MCM2+Olig2+ cell number in the corpus callosum. Scale bar: 50 μm. (E,F) The number of proliferating oligodendrocyte lineage cells in the white matter of spinal cord. (E) Representative images of MCM2+Olig2+ cells in the white matter of spinal cord at 1, 2, 4, and 8 weeks old. Scale bar: 50 μm. (F) Quantification of proliferating OPCs (Olig2+MCM2+) in the white matter of spinal cord. All values represent mean ± SEM (ns: non-significant, *P < 0.05, **P < 0.01, student's t-test). Number associated with bar graphs indicates number of animals examined.
Figure 3
Figure 3. Reductions in mature oligodendrocytes in 4- and 8-week-old BubR1 insufficient mice
(A) The density of oligodendrocyte lineage cells in the corpus callosum at 4 and 8 weeks of age. Left: Representative images of CC1 staining of 4 week-old WT and BubR1H/H mice corpus callosum. Scale bars: 50 μm. Right: Quantification of CC1+ cell number in the corpus callosum. (B) The density of oligodendrocyte lineage cells in the white matter of spinal cord at 4 and 8 weeks of age. Left: Representative images of CC1 staining of 4 week-old WT and BubR1H/H mice spinal cord. Scale bars: 50 μm. Right: Quantification of CC1+ cell density in the spinal cord. All values represent mean ± SEM (**P < 0.01, ***P < 0.001, student's t-test). Number associated with bar graphs indicates number of animals examined.
Figure 4
Figure 4. BubR1 insufficiency causes defects in CNS myelination in 8-week-old BubR1 insufficient mice
(A-B) Luxol fast blue (LFB) staining analysis. (A) Sample images of LFB staining in WT and BubR1H/H mice (left) and quantification of LFB area in coronal brain sections of 8-week-old mice (right). BubR1H/H mice exhibit a profound reduction in myelin density in the corpus callosum (blue dashed box), and internal capsule (red dashed box). Scale bar: 0.2 cm. (B) Sample images (left) and quantification of LFB area (right) indicating a profound reduction in myelin density in the spinal cord of BubR1H/H mice. Scale bar: 500 μm. WM; white matter, GM; gray matter. (C-G) Electron microscopy (EM) imaging analysis of the spinal cord dorsal column white matter of BubR1H/H mice and their WT littermates. Hypomyelination is observed in the spinal cord of BubR1H/H mice. (C) Representative EM images are shown. Scale bars: 2 μm for low magnification, and 0.2 μm for high magnification. (D,E) Scatter diagram and quantification of G-ratio. (F,G) Scatter diagram and quantification of myelin thickness. All values represent mean ± SEM (**P < 0.01, ***P < 0.001, student's t-test). Number associated with bar graphs indicates number of animals examined.
Figure 5
Figure 5. RNA-sequencing analysis reveals reduced expression of oligodendrocyte enriched genes in BubR1 insufficient mice
(A-F) Scatter plots for visualizing the top 500 genes expressed in each neural cell type, as determined by published RNA-seq data [30], in 8-week-old BubR1H/H mice relative to WT. Axes denote fold change (log2) by P-value. Vertical lines indicate P-value of 0.05, horizontal lines fold change (log2) of ±1. Red dots and corresponding number indicate up-regulated genes, blue dots and corresponding number indicate down-regulated genes. (A) Oligodendrocyte lineage cells enriched genes (2 up, 40 down). (B) Graph depicting a representative subset of oligodendrocyte- and myelination-related genes depicted in (A). Fold change represents BubR1H/H mice with WT as control. (C) Neuron enriched genes (4 up, 2 down). (D) Astrocyte enriched genes (3 up, 2 down). (E) Microglia enriched genes (7 up, 1 down). (F) Endothelial cell enriched genes (7 up, 1 down). Number of mice are 3 for each group. (G) Validation of mRNA expression of selected genes related to oligodendrocyte development and myelination. mRNA expression of oligodendrocyte development and myelination-related genes were significantly reduced in BubR1H/H mice. (H,I) Reduced expression of myelin-related proteins in BubR1 insufficient spinal cord. (H) Representative Western blot images of MBP and PLP1 in spinal cord lysates from 8-week-old WT and BubR1H/H mice. (I) Summary of densitometry quantification for MBP (16 and 21 kDa) and PLP1 (30 kDa) protein levels, which was normalized to that of actin for loading controls. All values represent mean ± SEM (*P < 0.05, **P < 0.01, ***P < 0.001, student's t-test). Number associated with bar graphs indicates number of animals examined.
Figure 6
Figure 6. BubR1 insufficient mice exhibit impaired motor function
(A) Gait analysis. The interlimb coordination was analyzed by the Tread-Scan Gait Analysis System. Left: Examples of severe gait abnormality in BubR1H/H mice. Middle: Quantification of symmetry by regularity index (front/rear step). Right: Quantification of homologous coupling (left/right step). (B) Locomotion in open field. Left: Representative exploratory activity traces from WT and BubR1H/H mice. Middle: Quantification of the total distance travelled. Right: Quantification of the mean velocity. Reduced distance moved in the open field chamber is a measure of reduced spontaneous locomotor activity. (C) Hindlimb clasping test. BubR1H/H mice exhibit increased hind limb clasping, indicating a motor function abnormality. (D) Paw grip endurance (PaGE) test, a measure of balance and endurance, indicates BubR1H/H fall sooner than WT littermates. (E) Grip strength test. All-paw grip strength is significantly reduced in BubR1H/H mice. (F) Rotarod test. Performance on a fixed speed rotarod paradigm at 10 rpm was assessed. Quantification of the latency to fall on the rotating platform was significantly reduced in BubR1H/H mice. (G) Grid walking test. BubR1H/H mice exhibit increased total foot slips in the grid walking test. All values represent mean ± SEM (*P < 0.05, **P < 0.01, ***P < 0.001, two-tailed student's t-test). Number associated with bar graphs indicates number of animals examined.
Figure 7
Figure 7. BubR1 insufficiency causes reduction in dendrite spine density of motor neurons and cerebellar purkinje cells
(A) Motor neuron density in lumbar spinal cord is not significantly different between WT and BubR1H/H mice. Left: Representative image of spinal cord with Nissl staining. Right: Quantification of lumbar motor neuron number. Scale bar: 500 μm. (B) Neuron density in primary motor cortex is not significantly different between WT and BubR1H/H mice. Left: Representative image of NeuN (a neuronal marker) and DAPI staining of motor cortex neurons. Right: Quantification of NeuN+ cell density. Scale bar: 50 μm. (C) BubR1H/H mouse motor cortex neurons exhibit a reduced dendritic spine density. Left: Representative image of golgi-stained motor cortex neuron dendritic spines. Right: Quantification of dendritic spine density. Scale bar; 1 μm. (D) BubR1H/H mouse cerebellar Purkinje neuron density is not significantly different from WT mice. Left: Representative image of Calbindin (marker for Purkinje cells) and DAPI staining of Purkinje neurons. Scale bar: 20 μm. Right: Quantification of Calbindin+ cell density. (E) BubR1H/H mouse cerebellar Purkinje neurons exhibit a reduced dendritic spine density. Left: Representative image of golgi-stained Purkinje neuron dendritic spines. Right: Quantification of dendritic spine density. Scale bar; 1 μm. All values represent mean ± SEM (ns: non-significant, *P < 0.05, **P < 0.01, two-tailed student's t-test). Number associated with bar graphs indicates number of animals examined.

References

    1. Bradl M, Lassmann H. Oligodendrocytes: biology and pathology. Acta Neuropathol. 2010;119:37–53. doi: 10.1007/s00401-009-0601-5. - DOI - PMC - PubMed
    1. Nave KA, Werner HB. Myelination of the nervous system: mechanisms and functions. Annu Rev Cell Dev Biol. 2014;30:503–33. doi: 10.1146/annurev-cellbio-100913-013101. - DOI - PubMed
    1. Mighdoll MI, Tao R, Kleinman JE, Hyde TM. Myelin, myelin-related disorders, and psychosis. Schizophr Res. 2015;161:85–93. doi: 10.1016/j.schres.2014.09.040. - DOI - PubMed
    1. Calvo-Ochoa E, Arias C. Cellular and metabolic alterations in the hippocampus caused by insulin signalling dysfunction and its association with cognitive impairment during aging and Alzheimer's disease: studies in animal models. Diabetes Metab Res Rev. 2015;31:1–13. doi: 10.1002/dmrr.2531. - DOI - PubMed
    1. Tucsek Z, Toth P, Sosnowska D, Gautam T, Mitschelen M, Koller A, Szalai G, Sonntag WE, Ungvari Z, Csiszar A. Obesity in aging exacerbates blood-brain barrier disruption, neuroinflammation, and oxidative stress in the mouse hippocampus: effects on expression of genes involved in beta-amyloid generation and Alzheimer's disease. J Gerontol A Biol Sci Med Sci. 2014;69:1212–26. doi: 10.1093/gerona/glt177. - DOI - PMC - PubMed

Substances