. 2017 Mar;153(3):537-546.
doi: 10.1016/j.jtcvs.2016.10.065. Epub 2016 Nov 14.

Regulation of membrane type-1 matrix metalloproteinase activity and intracellular localization in clinical thoracic aortic aneurysms

Affiliations

Regulation of membrane type-1 matrix metalloproteinase activity and intracellular localization in clinical thoracic aortic aneurysms

John S Ikonomidis et al. J Thorac Cardiovasc Surg. 2017 Mar.

Abstract

Objective: Membrane type-1 matrix metalloproteinase (MT1-MMP) is elevated during thoracic aortic aneurysm (TAA) development in mouse models, and plays an important role in the activation of matrix metalloproteinase (MMP)-2 and the release of matrix- bound transforming growth factor-β. In this study, we tested the hypothesis that MT1-MMP is subject to protein kinase C (PKC)-mediated regulation, which alters intracellular trafficking and activity with TAAs.

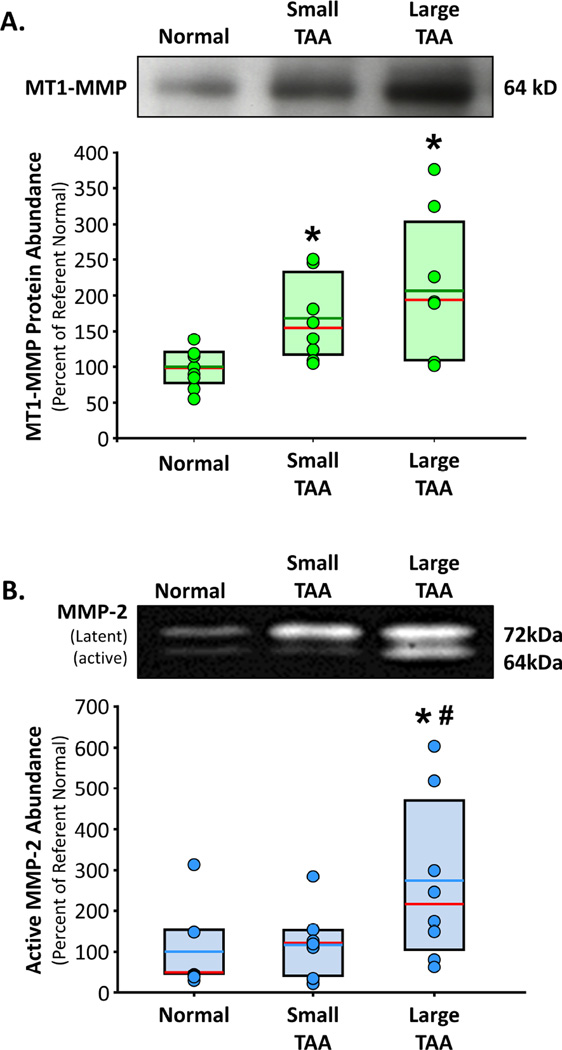
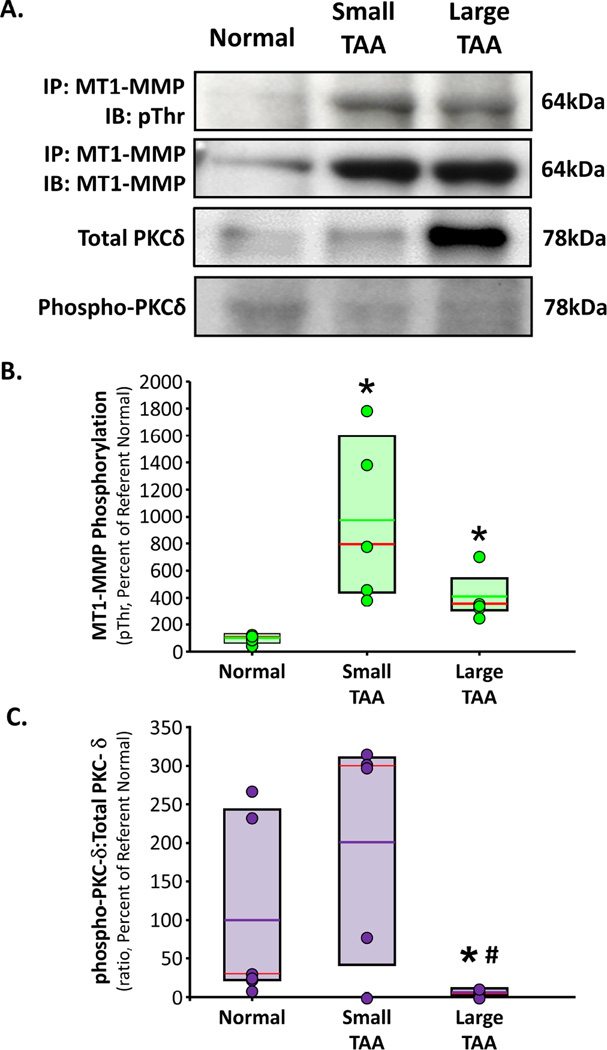
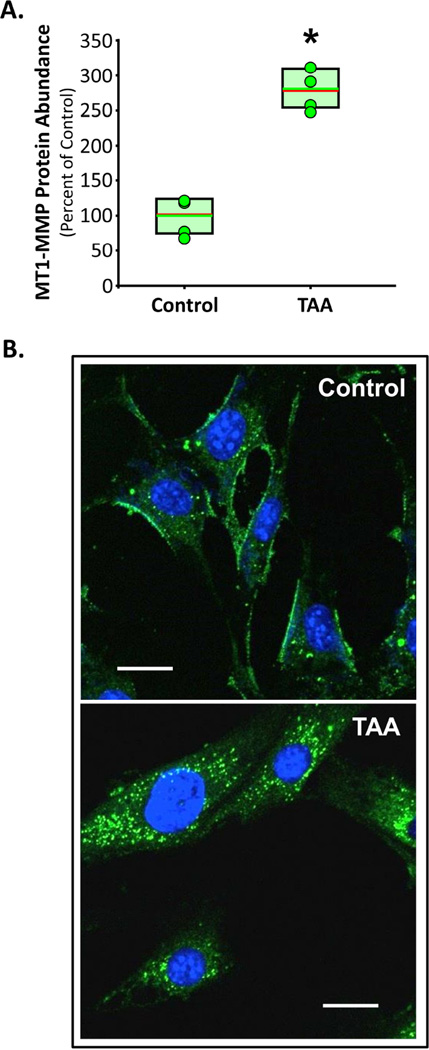
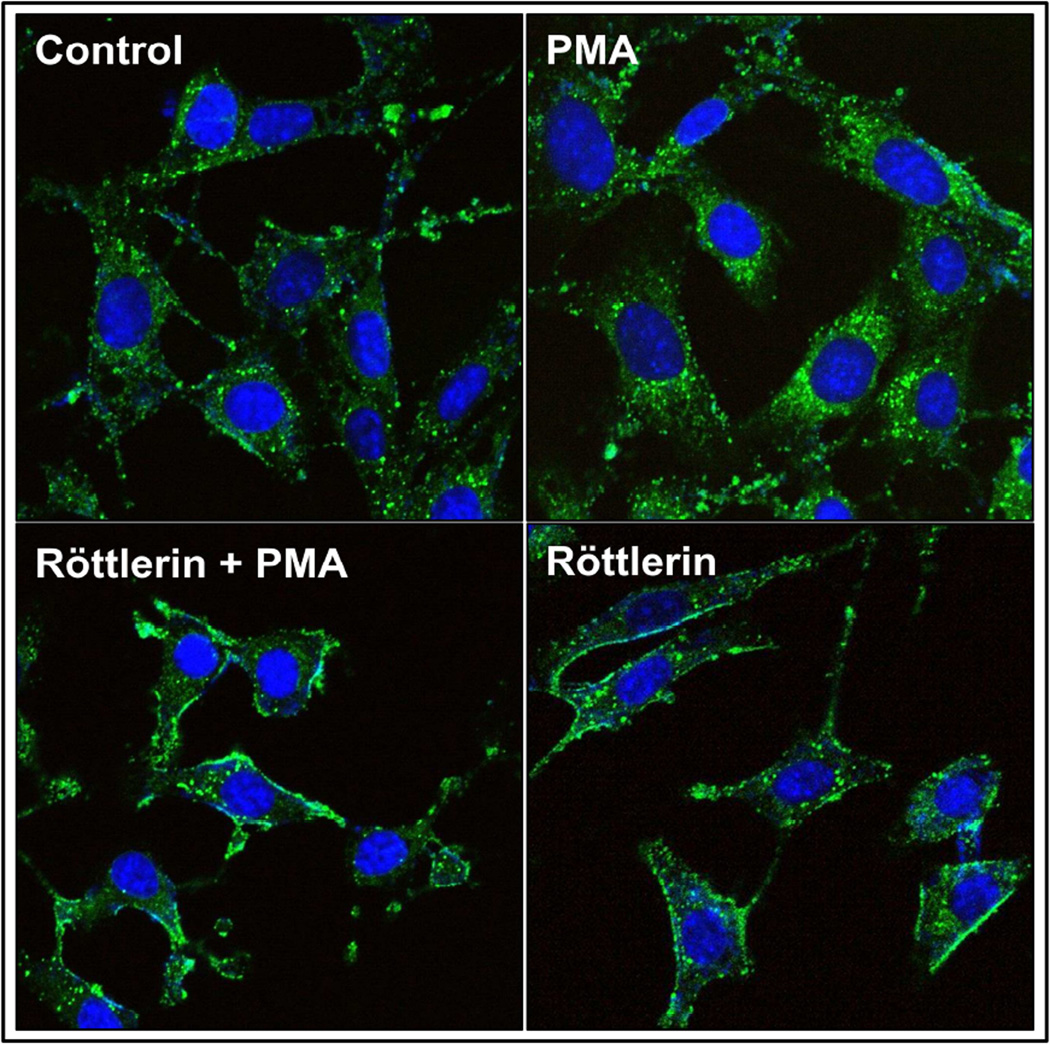
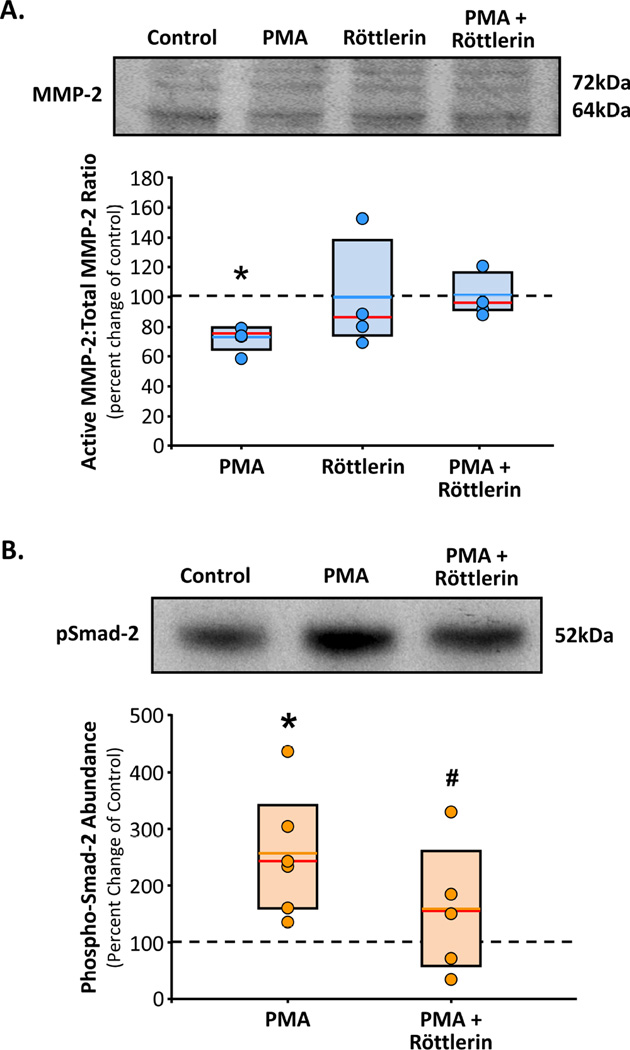
Methods: Levels of MMP-2, native and phosphorylated MT1-MMP, and PKC-δ were measured in aortic tissue from patients with small TAAs (<5 cm; n = 8) and large TAAs (>6.5 cm; n = 8), and compared with values measured in normal controls (n = 8). Cellular localization of green fluorescent protein (GFP)-tagged MT1-MMP was assessed in aortic fibroblasts isolated from control and 4-week TAA mice. The effects of PKC-mediated phosphorylation on MT1-MMP cellular localization and function (active MMP-2 vs phospo-Smad2 abundance) were assessed after treatment with a PKC activator (phorbol-12-myristate-13-acetate [PMA], 100 nM) with and without a PKC-δ-specific inhibitor (röttlerin, 3 μM).

Results: Compared with controls, MT1-MMP abundance was increased in aortas from both TAA groups. Active MMP-2 was increased only in the large TAA group. The abundances of phosphorylated MT1-MMP and activated PKC-δ were enhanced in the small TAA group compared with the large TAA group. MT1-MMP was localized on the plasma membrane in aortic fibroblasts from control mice and in endosomes from TAA mice. Treatment with PMA induced MT1-MMP-GFP internalization, enhanced phospho-Smad2, and reduced MMP-2 activation, whereas röttlerin pretreatment inhibited these effects.

Conclusions: Phosphorylation of MT1-MMP mediates its activity through directing cellular localization, shifting its role from MMP-2 activation to intracellular signaling. Thus, targeted inhibition of MT1-MMP may have therapeutic relevance as an approach to attenuating TAA development.

Keywords: MT1-MMP; aneurysm; protein kinase C; remodeling; thoracic aorta.


Conflict of interest statement

Conflicts of Interest: Both Dr. Ikonomidis and Dr. Jones have research grants to disclose. No other potential conflicts of interest exist for any of the other authors.

Figures

Figure 1
Figure 1. MT1-MMP and MMP-2 abundance in clinical TAA specimens
A. Top. Representative immunoblot showing MT1-MMP protein abundance in normal aorta (n=8), small TAA (4.0 – 4.9 cm; n=8), and large TAA (6.5 – 8.0 cm; n=8). Bottom. Densitometric quantitation of MT1-MMP protein abundance determined by immunoblotting. Results are expressed as a mean percent change of normal aorta. Individual data points in each group overlay box plots. The box defines the 25th–75th interquartile range, and both the median (red line) and mean (green line) values are shown within the box. * p<0.05 versus Normal (ANOVA with Tukey’s wsd). B. Top. Representative zymogram showing the protein abundance of the latent form (72kD band) and active form (64kD band) of MMP-2 in normal aorta (n=7), small TAA (4.0 – 4.9 cm; n=8), and large TAA (6.5 – 8.0 cm; n=8). Bottom. Densitometric quantitation of active (64kD band) MMP-2 protein abundance determined by gelatin zymography. Results are expressed as a mean percent change of normal aorta. Individual data points in each group overlay box plots. The box defines the 25th–75th interquartile range, and both the median (red line) and mean (blue line) values are shown within the box. * p<0.05 versus Normal, # p<0.05 versus Small TAA (ANOVA with Tukey’s wsd).
Figure 2
Figure 2. Phosphorylation of MT1-MMP in clinical TAA specimens
A. MT1-MMP was immunoprecipitated from normal aorta, small TAA (4.0 – 4.9 cm), and large TAA (6.5 – 8.0 cm). The immunoprecipitated protein was fractionated by electrophoresis and immunoblotted for phospho-Threonine and for MT1-MMP to confirm immunoprecipitation. Tissue homogenates from the same sample set were also immunoblotted for total PKC-δ, and phosphor-PKC-δ. Representative images are shown. B. Densitometric quantitation of MT1-MMP-specific phospho-Threonine residues in normal aorta (n=6), small TAA (4.0 – 4.9 cm; n=5), and large TAA (6.5 – 8.0 cm; n=5). Results are expressed as a mean percent change of normal aorta. Individual data points in each group overlay box plots. The box defines the 25th–75th interquartile range, and both the median (red line) and mean (green line) values are shown within the box. * p<0.05 versus Normal (ANOVA with Tukey’s wsd). C. Densitometric quantitation of the ratio of phospho-PKC-δ (activated):total PKC-δ from normal aorta (n=6), small TAA (4.0 – 4.9 cm; n=5), and large TAA (6.5 – 8.0 cm; n=4). Results are expressed as a mean percent change of normal aorta. Individual data points in each group overlay box plots. The box defines the 25th–75th interquartile range, and both the median (red line) and mean (purple line) values are shown within the box. * p<0.05 versus Normal, # p<0.05 versus Small TAA (ANOVA with Tukey’s wsd).
Figure 3
Figure 3. MT1-MMP abundance and localization in primary aortic fibroblasts
A. Protein abundance of MT1-MMP in normal and 4-week TAA aortic fibroblasts (n=4 each group). Results are expressed as a mean percent change of Control aorta. Individual data points in each group overlay box plots. The box defines the 25th–75th interquartile range, and both the median (red line) and mean (green line) values are shown within the box. * p<0.05 versus Control (unpaired Student’s t-test). B. Representative images from normal and 4-week TAA aortic fibroblasts transfected with MT1-MMP-GFP. At steady-state MT1-MMP-GFP was localized predominantly at the plasma membrane in the normal cells, but was almost exclusively localized in endosomal vesicles in the 4-week TAA cells.
Figure 4
Figure 4. PKC-δ-mediated MT1-MMP translocation in normal aortic fibroblasts
Representative images of primary aortic fibroblasts transfected with MT1-MMP-GFP and treated with or without PMA, in the presence or absence of Röttlerin. Images show MT1-MMP-GFP predominantly at the plasma membrane in controls. Upon activation of PKC with PMA, MT1-MMP translocated to intracellular endosomal vesicles. When the cells were pretreated with Röttlerin, a PKC-δ-specific inhibitor, PMA-induced translocation was inhibited. Röttlerin alone was sufficient to lock MT1-MMP at the plasma membrane.
Figure 5
Figure 5. PMA induced changes in MT1-MMP function
A. Primary aortic fibroblasts from normal mice (n=4) were treated with or without PMA, in the presence or absence of Röttlerin for 18 h (n=4 each treatment group). Cell homogenates were fractionated by gel electrophoresis and immunoblotted for latent and active MMP2. Results are expressed as a mean percent change in each cell line from its respective steady-state control (vehicle treated; dotted line). Individual data points in each group overlay box plots. The box defines the 25th–75th interquartile range, and both the median (red line) and mean (blue line) values are shown within the box. * p<0.05 versus control (ANOVA with Tukey’s wsd). B. Primary aortic fibroblasts from normal mice (n=4) were treated with or without PMA (30 min), in the presence or absence of Röttlerin (3 h pre-incubation, plus 30 min concurrent; n=4 each treatment group). Cell homogenates were fractionated by gel electrophoresis and immunoblotted for phosphor-Smad-2. Results are expressed as a mean percent change in each cell line from its respective steady-state control (vehicle treated; dotted line). Individual data points in each group overlay box plots. The box defines the 25th–75th interquartile range, and both the median (red line) and mean (orange line) values are shown within the box. * p<0.05 versus control, # p<0.05 versus PMA (ANOVA with Tukey’s wsd).

Comment in

References

    1. Elefteriades JA. Natural history of thoracic aortic aneurysms: indications for surgery, and surgical versus nonsurgical risks. Ann Thorac Surg. 2002;74:S1877–S1880. discussion S1892-1878. - PubMed
    1. Barbour JR, Spinale FG, Ikonomidis JS. Proteinase systems and thoracic aortic aneurysm progression. J Surg Res. 2007;139:292–307. - PubMed
    1. Jones JA, Ruddy JM, Bouges S, et al. Alterations in membrane type-1 matrix metalloproteinase abundance after the induction of thoracic aortic aneurysm in a murine model. Am J Physiol Heart Circ Physiol. 2010;299:H114–H124. - PMC - PubMed
    1. Longo GM, Xiong W, Greiner TC, Zhao Y, Fiotti N, Baxter BT. Matrix metalloproteinases 2 and 9 work in concert to produce aortic aneurysms. J Clin Invest. 2002;110:625–632. - PMC - PubMed
    1. Shen M, Lee J, Basu R, et al. Divergent roles of matrix metalloproteinase 2 in pathogenesis of thoracic aortic aneurysm. Arterioscler Thromb Vasc Biol. 2015;35:888–898. - PubMed

Substances