. 2017 Jan:102:248-259.
doi: 10.1016/j.freeradbiomed.2016.11.049. Epub 2016 Dec 5.

Intact mitochondrial Ca2+ uniport is essential for agonist-induced activation of endothelial nitric oxide synthase (eNOS)

Affiliations

Intact mitochondrial Ca2+ uniport is essential for agonist-induced activation of endothelial nitric oxide synthase (eNOS)

Suphachai Charoensin et al. Free Radic Biol Med. 2017 Jan.

Abstract

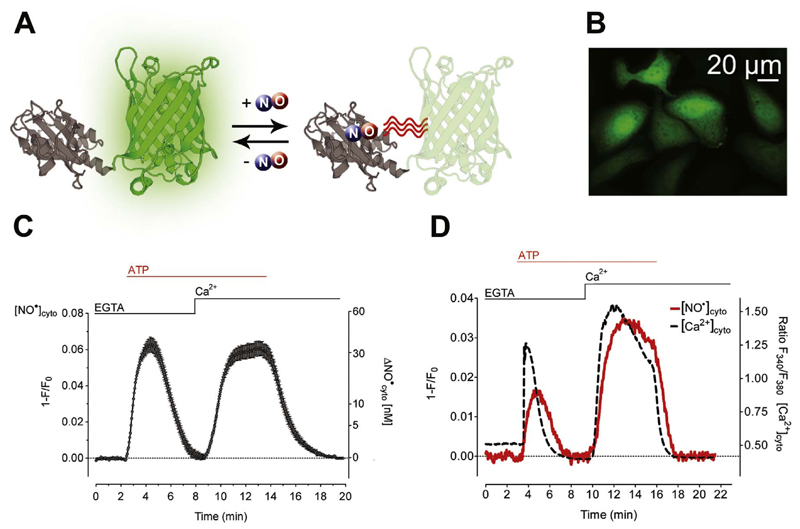
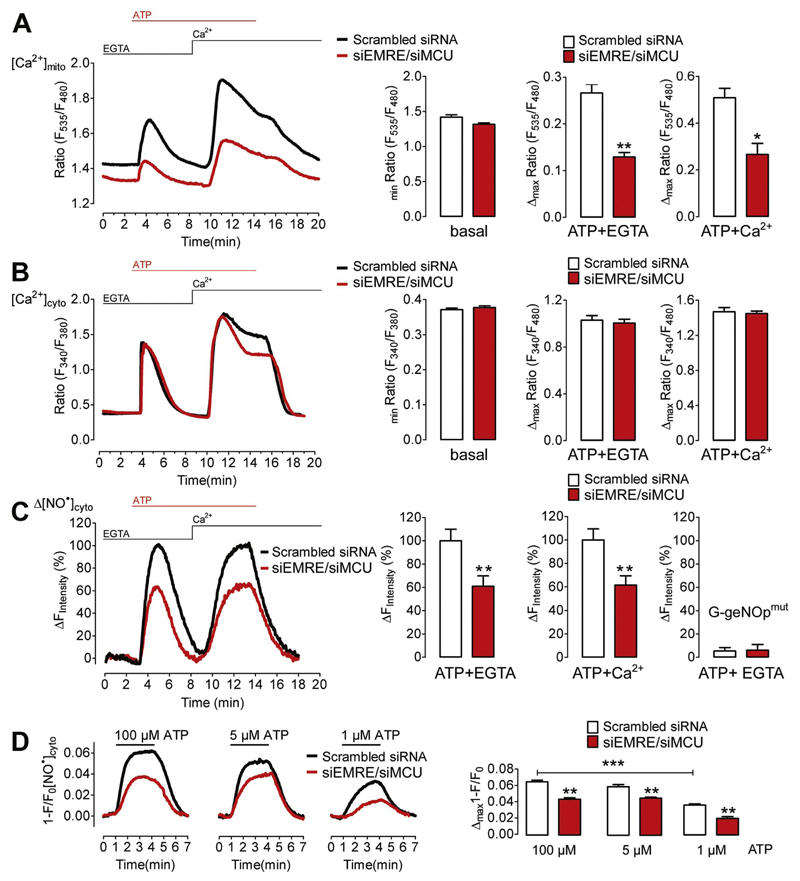
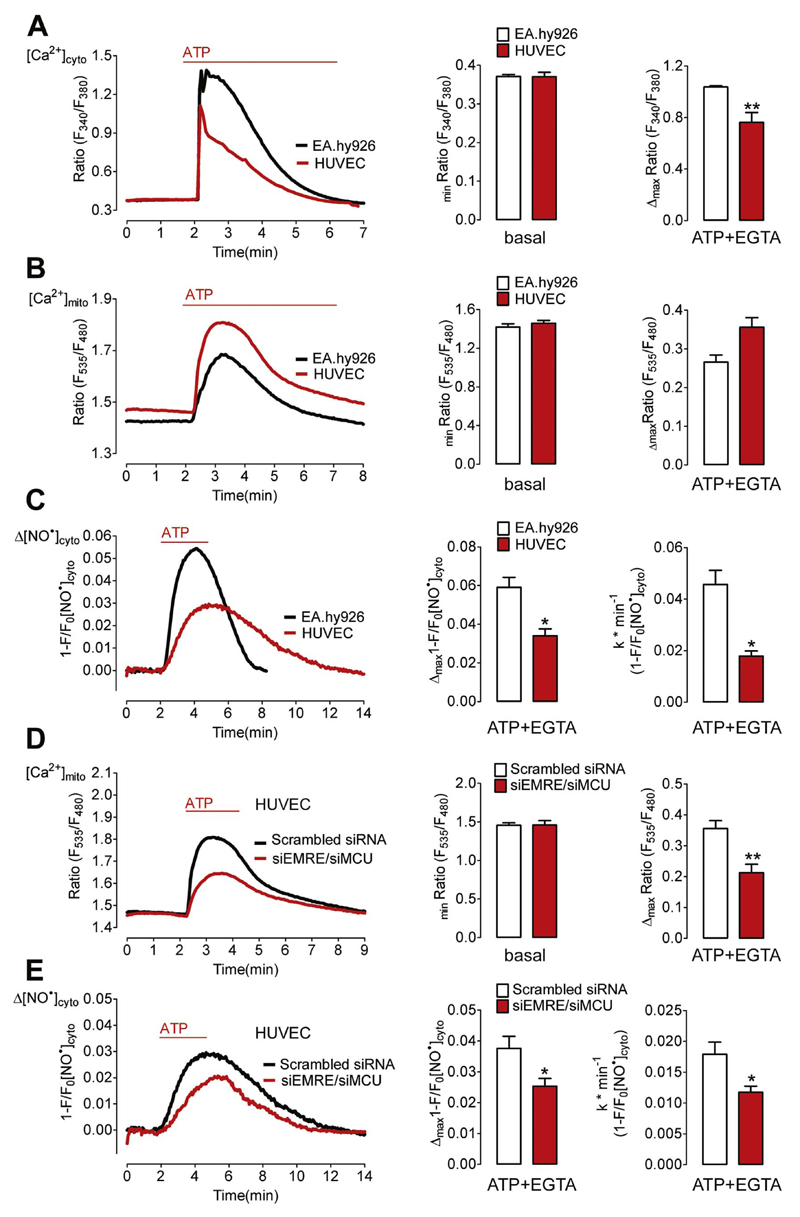
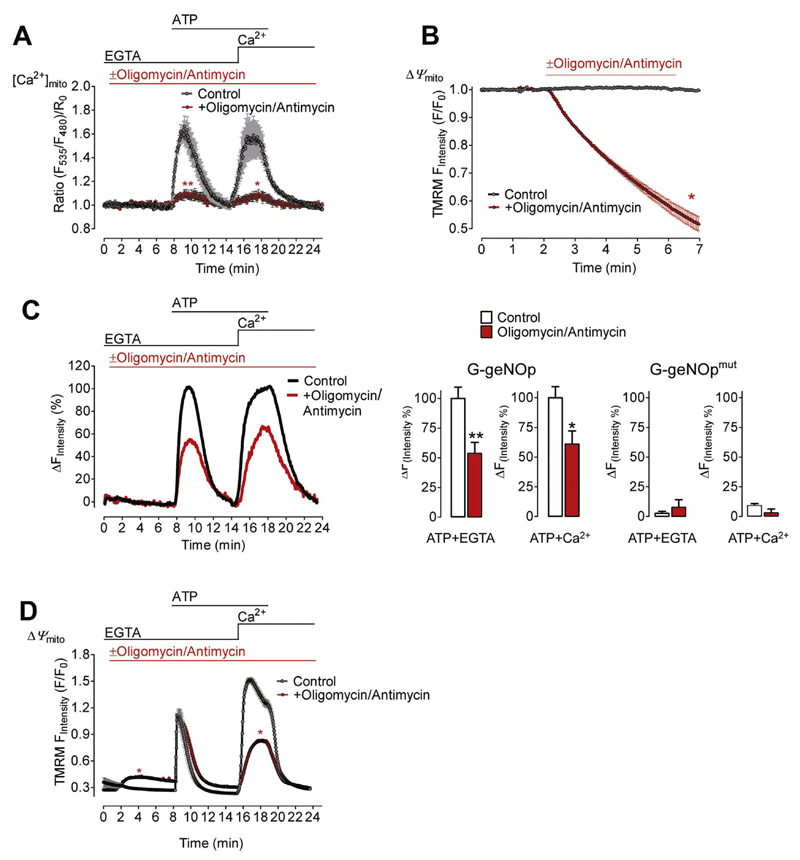
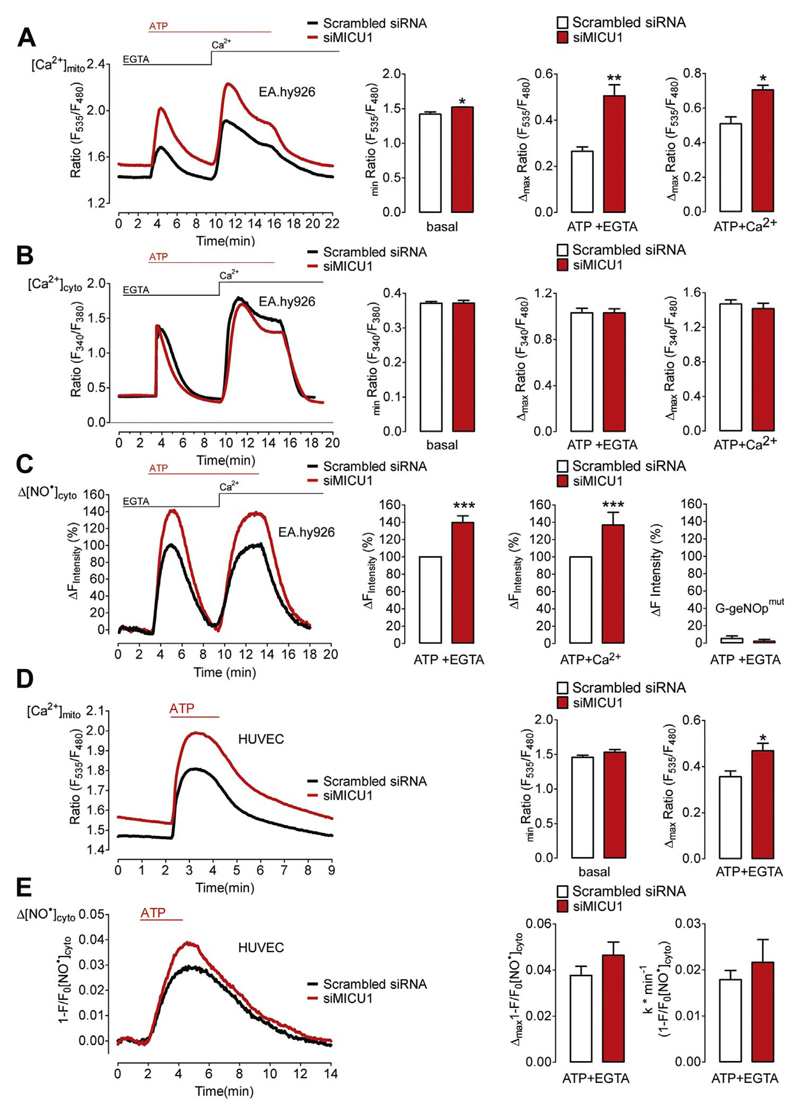
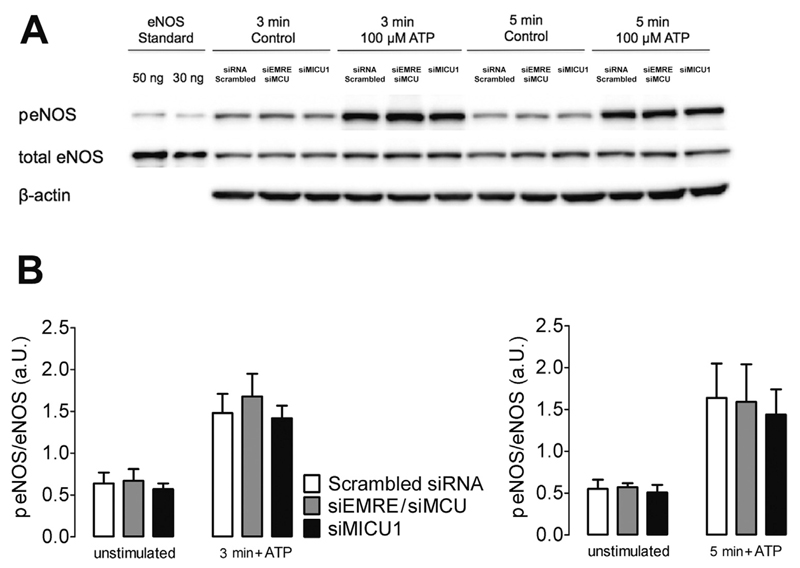
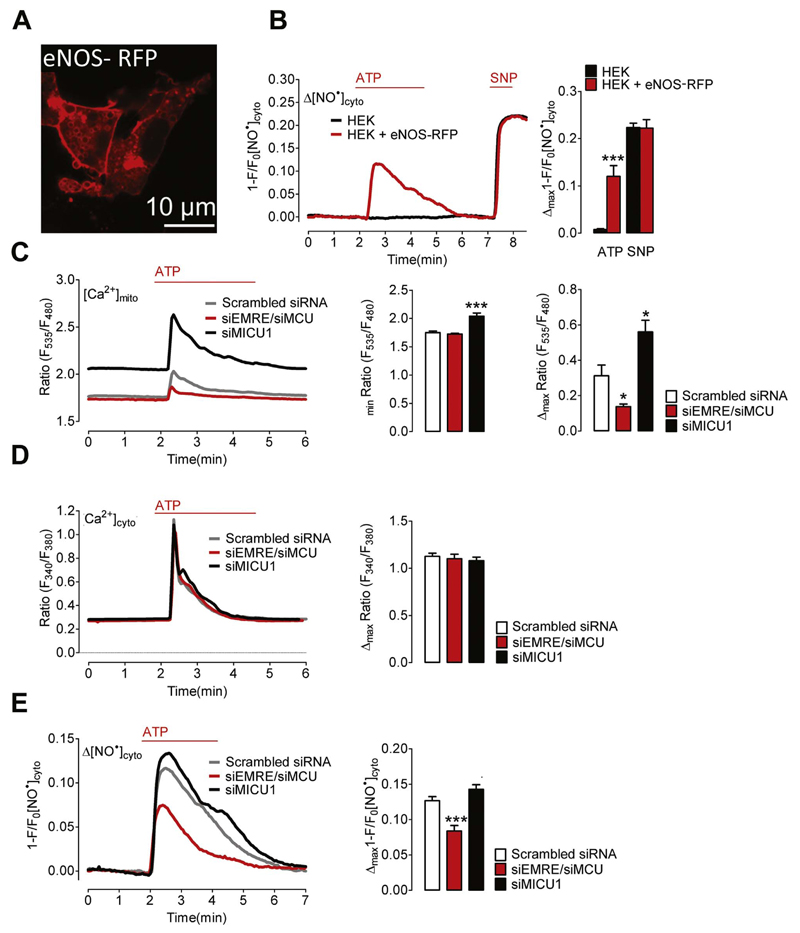
Mitochondrial Ca2+ uptake regulates diverse endothelial cell functions and has also been related to nitric oxide (NO) production. However, it is not entirely clear if the organelles support or counteract NO biosynthesis by taking up Ca2+. The objective of this study was to verify whether or not mitochondrial Ca2+ uptake influences Ca2+-triggered NO generation by endothelial NO synthase (eNOS) in an immortalized endothelial cell line (EA.hy926), respective primary human umbilical vein endothelial cells (HUVECs) and eNOS-RFP (red fluorescent protein) expressing human embryonic kidney (HEK293) cells. We used novel genetically encoded fluorescent NO probes, the geNOps, and Ca2+ sensors to monitor single cell NO and Ca2+ dynamics upon cell treatment with ATP, an inositol 1,4,5-trisphosphate (IP3)-generating agonist. Mitochondrial Ca2+ uptake was specifically manipulated by siRNA-mediated knock-down of recently identified key components of the mitochondrial Ca2+ uniporter machinery. In endothelial cells and the eNOS-RFP expressing HEK293 cells we show that reduced mitochondrial Ca2+ uptake upon the knock-down of the mitochondrial calcium uniporter (MCU) protein and the essential MCU regulator (EMRE) yield considerable attenuation of the Ca2+-triggered NO increase independently of global cytosolic Ca2+ signals. The knock-down of mitochondrial calcium uptake 1 (MICU1), a gatekeeper of the MCU, increased both mitochondrial Ca2+ sequestration and Ca2+-induced NO signals. The positive correlation between mitochondrial Ca2+ elevation and NO production was independent of eNOS phosphorylation at serine1177. Our findings emphasize that manipulating mitochondrial Ca2+ uptake may represent a novel strategy to control eNOS-mediated NO production.

Keywords: Calcium; ENOS; Endothelial nitric oxide production; GeNOps; Mitochondria.


Figures

Fig. 1
Fig. 1. Live-cell imaging of Ca2+-triggered NO formation in endothelial cells expressing G-geNOp.
(A) Schematic illustration of G-geNOp consisting of the enhanced green fluorescent protein (EGFP) fused to the bacteria-derived NO binding domain GAF (grey). Binding of NO in the vicinity of EGFP in G-geNOp induces fluorescence quenching. (B) Representative image showing EA.hy926 cells expressing G-geNOp. Notably, the NO probe localizes to the nucleus and cytosol. (C) Average curve ( ± SEM) showing NO signal over time obtained from single EA.hy926 cells obtained from independent experiments (N =40) upon treatment with 100 μM ATP in the absence of Ca2+(1 mM EGTA) and upon Ca2+(2 mM) addition. (D) Representative simultaneous recordings of NO (solid grey line) and Ca2+(dashed black line) signals over time in a single fura-2/am loaded EA.hy926 cell expressing G-geNOp. As indicated the cell was treated with 100 μM ATP in the absence of Ca2+(1 mM EGTA) and upon Ca2+ addition (2 mM) for 14 min.
Fig. 2
Fig. 2. Knock-down of EMRE and MCU reduces Ca2+-triggered NO production in EA.hy926 cells.
(A) Average curves of [Ca2+]mito (left panel) in EA.hy926 cells treated with either scrambled siRNA (black curve and white bars, N=3) or siRNAs against EMRE and MCU (siEMRE/siMCU, red curve and red bars, N=3) upon stimulation with 100 μM ATP in the absence of extracellular Ca2+(1 mM EGTA) followed by addition of Ca2+(2 mM). Bar graphs showing average basal Ca2+ level (basal, p=0.0581) and Ca2+ transients in response to 100 μM ATP-stimulated ER Ca2+ release (ATP + EGTA, **p=0.0029) and store-operated Ca2+ entry (ATP + Ca2+, *p=0.0169). (B) Curves representing average of [Ca2+]cyto in control (Scrambled siRNA, black curve, N=6) versus EMRE/MCU ablated (siEMRE/siMCU, red curve, N=7) EA.hy926 cells (left panel) stimulated with 100 μM ATP in the absence (1 mM EGTA) and addition of Ca2+(2 mM) as indicated. Respective statistical analyses of basal levels (basal, p=0.397), maximum cytosolic Ca2+ release (ATP + EGTA, p=0.6373) and maximum cytosolic Ca2+ entry (ATP + Ca2+, p=0.6988). (C) Representative curve of [NO]cyto in response to ATP stimulation. Statistical analyses of average [NO]cyto are shown in bar graphs (right panels). Maximal signals (amplitude) of scrambled siRNA- or siMCU/siEMRE-treated cells are defined as 100%. Cells were first stimulated with 100 μM ATP in the absence of extracellular Ca2+ in control cells (Scrambled siRNA, white column, ATP + EGTA, N =17) and cells reduced of EMRE and MCU (siEMRE/siMCU, red column, ATP + EGTA, N =17) and upon Ca2+( 2 mM) addition (right middle column pair). **p=0.0068 (ATP+EGTA) and **p=0.0042 (ATP+Ca2+) vs Scrambled siRNA. Right columns represent maximal fluorescence changes of G-geNOpmut in response to 100 μM ATP in EGTA (1 mM) in control cells (white column, N =11) and cells treated with siRNA against EMRE and MCU (red column, N =10). (D) Average curves of Ca2+-dependent NO formation upon stimulation with 1 μM (upper left panel) 5 μM (upper middle panel) or 100 μM ATP (upper right panel) in the absence of extracellular Ca2+ in EA.hy926 cells treated with either negative control siRNA (Scrambled siRNA, black curves) or siRNA against EMRE and MCU (siEMRE/siMCU, red curves). Statistical analysis of maximum NO formation in cells stimulated with either 1 μM ATP (lower left panel) representing Scrambled siRNA (white bar, N=3) and siEMRE/siMCU (red bar, N=3); **p=0.0045, with 5 μM ATP (lower middle panel) representing Scrambled siRNA (white bar, N=3) and siEMRE/siMCU (red bar, N=3); **p=0.0087, or with 100 μM ATP (lower right panel) representing Scrambled siRNA (white bar, N=3) and siEMRE/siMCU (red bar, N=3); **p=0.0012.
Fig. 3
Fig. 3. Knock-down of EMRE/MCU reduces Ca2+-evoked NO formation in HUVECs.
(A) Cytosolic Ca2+ signals in EA.hy926 cells (black curve and white bars) and primary HUVECs (red curve and red bars) in response to 100 μM ATP. [Ca2+]cyto was imaged using fura-2/am loaded cells. Middle bars represent basal fura-2 ratio (F340/F380) values of EA.hy926 cells (white bars, N =6, p=0.9708) and HUVECs (red bars, N =6). Right bars show maximal fura-2 ratio amplitudes in EA.hy926 (white bars, N =6) and HUVEC cells (red bars, N =6). **p=0.005 vs. EA.hy926 cells. (B) Mitochondrial Ca2+ signals in EA.hy926 cells (black curve and white bars) and primary HUVECs (red curve and red bars) in response to 100 μM ATP. [Ca2+]mito was imaged using cells expressing 4mtD3cpV. Middle bars represent basal 4mtD3cpV ratio (F535/F480) values of EA.hy926 cells (white bars, N =3, p=0.4753) and HUVECs (red bars, N =6). Right bars show maximal 4mtD3cpV ratio amplitudes in EA.hy926 (white bars, N =3) and HUVEC cells (red bars, N =6). (C) Cytosolic NO signals in EA.hy926 cells (black curve and white bars) and primary HUVECs (red curve and red bars) in response to 100 μM ATP. [NO]cyto was imaged using cells expressing G-geNOp. Middle bars represent maximal fluorescence changes of G-geNOp (1-F/F0) expressed in EA.hy926 cells (white bars, N =10) and HUVECs (red bars, N =8); *p=0.0366 vs EA.hy926. Right bars show maximal slopes of G-geNOp fluorescence changes in response to 100 mM ATP in EA.hy926 (white bars, N =10) and HUVEC cells (red bars, N =8). *p=0.015 vs. EA.hy926 cells. (D) Mitochondrial Ca2+ signals in HUVECs under control conditions (Scrambled siRNA, black curve, white bars, N =6) and in cells treated with siRNA against EMRE and MCU (siEMRE/siMCU, red curve, red columns, N =6). Middle bars represent basal 4mtD3cpV ratio values (p=0.1502). Cells were stimulated with 100 μM ATP in the absence of extracellular Ca2+. Right bars show maximal 4mtD3cpV ratio changes upon cell stimulation.**p=0.0032 vs Scrambled siRNA. (E) Cytosolic NO signals ([NO]cyto) in control HUVECs (Scrambled siRNA, black curve and white bars, N =8) and cells treated with siRNA against EMRE and MCU (siEMRE/siMCU, red curve and bars, N =8) in response to 100 μM ATP in EGTA (1 mM). Middle columns represent mean of maximal ATP-evoked G-geNOp responses; *p=0.0193. Right columns show respective maximal slopes of G-geNOp signals; *p=0.0206.
Fig. 4
Fig. 4. Cell treatment with oligomycin/antimycin reduces Ca2+-triggered NO formation.
(A) Average [Ca2+]mito signals ± SEM of EA.hy926 cells expressing 4mtD3cpv under control conditions (black curve N =8) and in the presence of 1 μM oligomycin and 5 μM antimycin (red curve, N =12) in response to 100 μM ATP first in the absence of extracellular Ca2+(1 mM EGTA) and upon addition of Ca2+(2 mM).**p=0.0096 (in EGTA) and *p=0.0159 (in Ca2+) vs. Control. (B) TMRM signals of EA.hy926 cells over time to estimate changes in Ψmito (mitochondrial membrane potential) under control conditions (black curve N =6) and upon addition of 1 μM oligomycin and 5 μM antimycin (red curve, N =6). *p=0.0286. (C) NO signals of EA.hy926 cells over time expressing G-geNOp in the absence (control, black curve, white bars, N =11) or presence of 1 μM oligomycin and 5 μM antimycin (red curve and bars, N =9). Maximal signals under control conditions in response to 100 μM ATP were defined as 100% (middle right bars). **p=0.0074 (in EGTA) and *p=0.0200 (in Ca2+) vs. Control. Right bars represent maximal fluorescence changes of the NO-insensitive G-geNOpmut in control cells (white bars N =6) and in the presence of the mitochondria toxins (red bars, N =6). p=0.8016 (in EGTA) and p=0.1508 (in Ca2+). (D) Fura-2 ratio signals of EA.hy926 cells over time under control conditions (black curve, N =6) and in the presence of 1 μM oligomycin and 5 μM antimycin (red curve, N =6). *p=0.0286 (in EGTA) and *p=0.0283 (in Ca2+) vs. Control.
Fig. 5
Fig. 5. Silencing of MICU1 increases Ca2+-triggered NO production in endothelial cells.
(A) Average curves of [Ca2+]mito (left panel) in EA.hy926 cells treated with either scrambled siRNA (black curve and white bars, N=3) or siRNAs against MICU1 (siMICU1, red curve and red bars, N=3) upon stimulation with 100 μM ATP in the absence of extracellular Ca2+(1 mM EGTA) followed by addition of Ca2+(2 mM). Bar graphs showing average basal Ca2+ level (basal, *p=0.0356) and Ca2+ transients in response to 100 μM ATP in 1 mM EGTA (ATP + EGTA, **p=0.0098) and upon Ca2+ addition (ATP + Ca2+, *p=0.0151). (B) Curves representing average of [Ca2+]cyto in control (Scrambled siRNA, black curve, N=6) versus MICU1 ablated (siMICU1, red curve, N=6) EA.hy926 cells (left panel) stimulated with 100 μM ATP in the absence (1 mM EGTA) and addition of Ca2+(2 mM) as indicated. Respective statistical analyses of basal levels (basal, p=0.9621), maximum cytosolic Ca2+ release (ATP + EGTA, p=0.9911) and maximum cytosolic Ca2+ entry (ATP + Ca2+, p=0.4977). (C) Representative curve of [NO]cyto in response to ATP stimulation. Statistical analyses of average [NO]cyto are shown in bar graphs (right panels). Maximal signals (amplitude) of scrambled siRNA- or siMICU1-treated cells are defined as 100%. Cells were first stimulated with 100 μM ATP in the absence of extracellular Ca2+ in control cells (Scrambled siRNA, white column, ATP + EGTA, N =17) and cells reduced of MICU1 (siMICU1, red column, ATP + EGTA, N =16) and upon Ca2+(2 mM) addition (right middle column pair). **p=0.0083 (ATP + EGTA) and **p=0.0079 (ATP+Ca2+) vs Scrambled siRNA. Right columns represent maximal fluorescence changes of G-geNOpmut in response to 100 μM ATP in EGTA (1 mM) in control cells (white column, N =11) and cells treated with siRNA against MICU1 (siMICU1, red column, N =8); p=0.4424 vs Scrambled siRNA. (D) Mitochondrial Ca2+ signals in HUVECs under control conditions (Scrambled siRNA, black curve, white bars, N =6) and in cells treated with siRNA against MICU1 (siMICU1, red curve, red columns, N =6). Middle bars represent basal 4mtD3cpV ratio values (p=0.1502). Cells were stimulated with 100 μM ATP in the absence of extracellular Ca2+. Right bars show maximal 4mtD3cpV ratio changes upon cell stimulation.*p=0.0211 vs Scrambled siRNA. (E) Cytosolic NO signals ([NO]cyto) in control HUVECs (Scrambled siRNA, black curve and white bars, N =8) and cells treated with siRNA against MICU1 (siMICU1, red curve and bars, N =10) in response to 100 μM ATP in EGTA (1 mM). Middle columns represent mean of maximal ATP-evoked G-geNOp responses; p=0.2532. Right columns show respective maximal slopes of G-geNOp signals; p=0.4567.
Fig. 6
Fig. 6. The expression level and phosphorylation status of eNOS remain unaffected by transient down-regulation of MCU, EMRE and MICU1.
(A) Representative Western blot of total homogenates of transfected EA.hy926 cells (30 μg of protein) showing phosphorylated eNOS (peNOS; 140 kDa), total eNOS (140 kDa) and β-actin (43 kDa) under basal conditions (unstimulated) or stimulated with 100 μM ATP for 3 or 5 min. Purified human eNOS (30 and 50 ng) was used as standard. Bands of control cells (Scrambled siRNA) and cells treated with siRNA against both EMRE and MCU (siEMRE/siMCU) or against MICU1 (siMICU1) are shown. (B) Bars show the ratio of phosphorylated to total eNOS protein in transfected EA.hy926 cells (Scrambled siRNA, siEMRE/siMCU and siMICU1) under basal conditions (unstimulated), after 3 (left panel) and 5 (right panel) minutes of incubation with 100 μM ATP. N =3 for all conditions.
Fig. 7
Fig. 7. Mitochondrial Ca2+ uptake controls NO formation in HEK293 cells expressing eNOS-RFP.
(A) Representative image showing HEK293 cells expressing eNOS-RFP. (B) Representative curves of cytosolic NO signals ([NO]cyto) over time in response to 100 μM ATP and 1 mM SNP in control HEK293 cells (black curve and bars, N =5) and HEK293 cells co-expressing eNOS-RFP (red curve and bars, N =3). Left Bars show maximal changes of G-geNOp fluorescence in response to ATP; ***p=0.0005 vs HEK293. Right bars show maximal G-geNOps signals in response to SNP, p=0.9386. (C) Mitochondrial Ca2+ signals in HEK293 cells under control conditions (Scrambled siRNA, grey curve and white columns, N =8), in cells treated with siRNA against EMRE and MCU (siEMRE/siMCU, red curve and red columns, N =8) or against MICU1 (siMICU1, black curve and columns, N =7). Cells were stimulated with 100 μM ATP in EGTA (1 mM). Left columns represent basal 4mtD3cpV ratio values; p=0.4088 (siEMRE/siMCU) vs Scrambled siRNA; ***p=0.0004 (siMICU1) vs Scrambled siRNA. Right columns show mean values of maximal 4mtD3cpV ratio signals; *p=0.0145 (siEMRE/siMCU) vs Scrambled siRNA; *p=0.0152 (siMICU1) vs Scrambled siRNA. (D) Representative cytosolic Ca2+ signals of fura-2/am loaded HEK293 cells treated with scrambled siRNA (Scrambled siRNA, grey curve and white columns, N =3) siRNA against EMRE and MCU (siEMRE/siMCU, red curve and red columns, N =3) or MICU1 (siMICU1, black curve and columns, N =4). Cells were stimulated with 100 μM ATP in EGTA (1 mM). Columns represent mean values of maximal fura-2 ratio signals; p=0.6842 (siEMRE/siMCU) vs Scrambled siRNA; p=0.4253 (siMICU1) vs Scrambled siRNA. (E) Representative cytosolic NO signals eNOS-RFP expressing HEK293 cells treated with scrambled siRNA (Scrambled siRNA, grey curve and white columns, N =9) siRNA against EMRE and MCU (siEMRE/siMCU, red curve and red columns, N =11) or MICU1 (siMICU1, black curve and columns, N =8). Cells were stimulated with 100 μM ATP in EGTA (1 mM). Columns represent mean values of maximal G-geNOp signals; ***p=0.0005 (siEMRE/siMCU) vs Scrambled siRNA; p=0.0829 (siMICU1) vs Scrambled siRNA.

Similar articles

Cited by

References

    1. Denton RM. Regulation of mitochondrial dehydrogenases by calcium ions. Biochim Biophys Acta. 1787;2009:1309–1316. - PubMed
    1. Bhosale G, Sharpe JA, Sundier SY, Duchen MR. Calcium signaling as a mediator of cell energy demand and a trigger to cell death. Ann N Y Acad Sci. 2015;1350:107–116. - PMC - PubMed
    1. Rimessi A, Giorgi C, Pinton P, Rizzuto R. The versatility of mitochondrial calcium signals: from stimulation of cell metabolism to induction of cell death. Biochim Biophys Acta. 1777;2008:808–816. - PMC - PubMed
    1. Graier WF, Frieden M, Malli R. Mitochondria and Ca2+ signaling: old guests, new functions. Pflug Arch. 2007;455:375–396. - PMC - PubMed
    1. Dedkova EN, Ji X, Lipsius SL, Blatter LA. Mitochondrial calcium uptake stimulates nitric oxide production in mitochondria of bovine vascular endothelial cells. Am J Physiol Cell Physiol. 2004;286:406–415. - PubMed

Publication types

LinkOut - more resources