. 2017 Jan 20;292(3):847-861.
doi: 10.1074/jbc.M116.759837. Epub 2016 Dec 6.

An l- to d-Amino Acid Conversion in an Endosomolytic Analog of the Cell-penetrating Peptide TAT Influences Proteolytic Stability, Endocytic Uptake, and Endosomal Escape

Affiliations

An l- to d-Amino Acid Conversion in an Endosomolytic Analog of the Cell-penetrating Peptide TAT Influences Proteolytic Stability, Endocytic Uptake, and Endosomal Escape

Kristina Najjar et al. J Biol Chem. .

Abstract

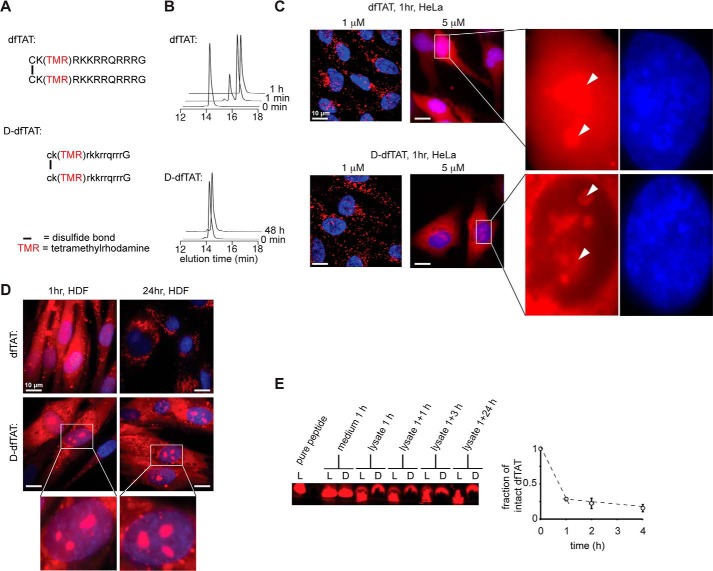
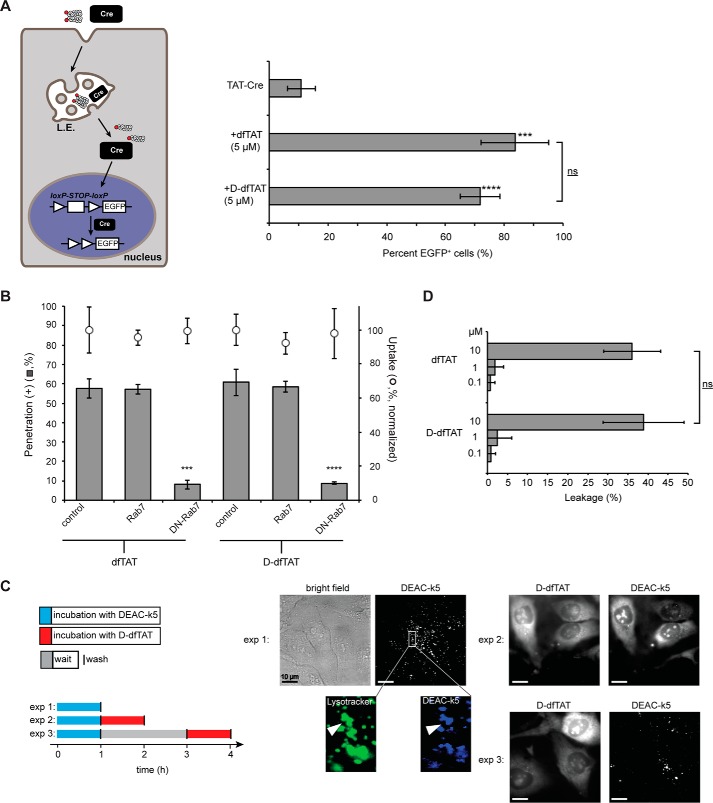
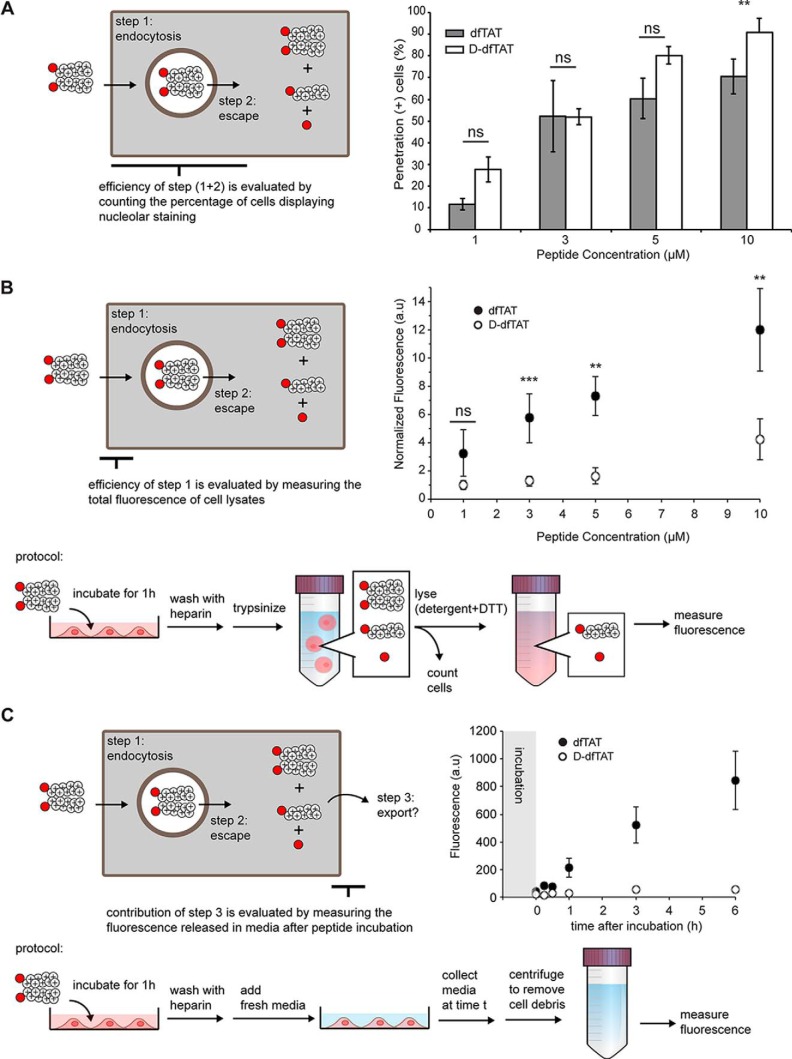
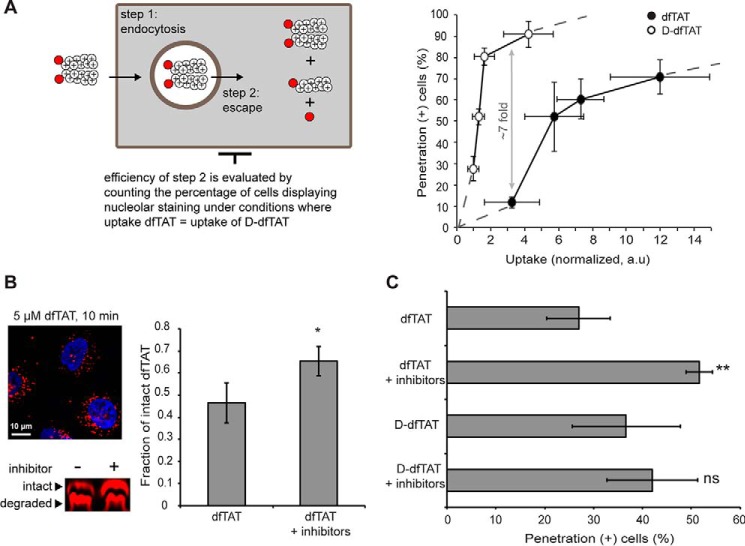
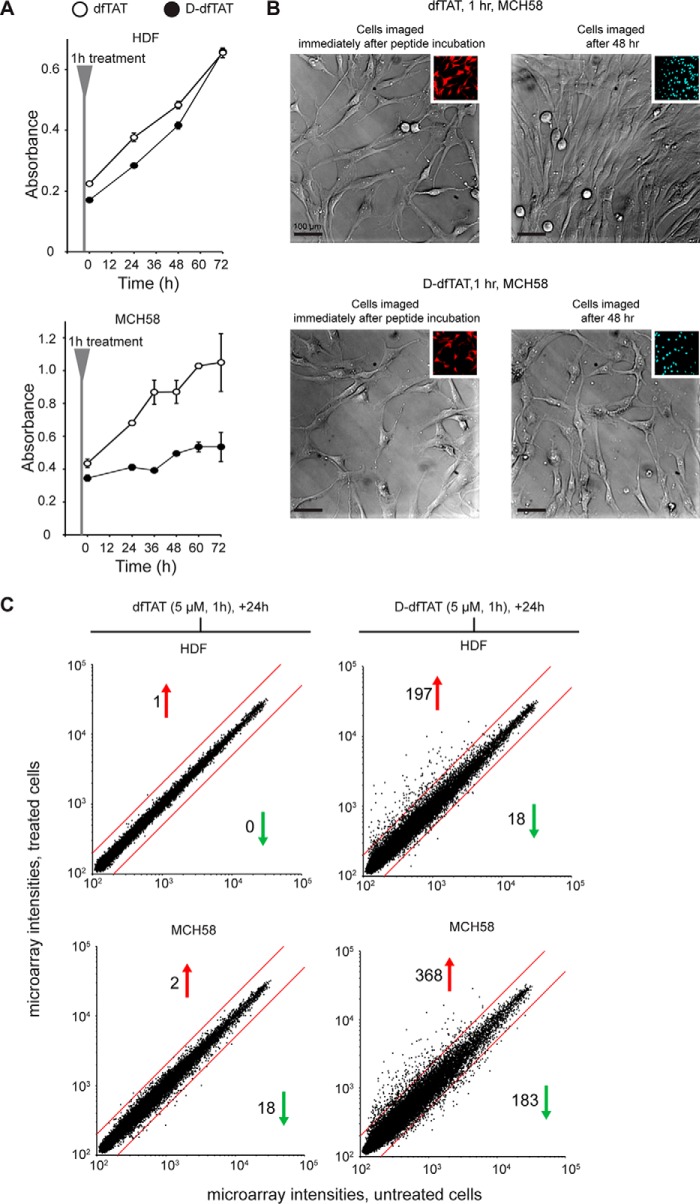
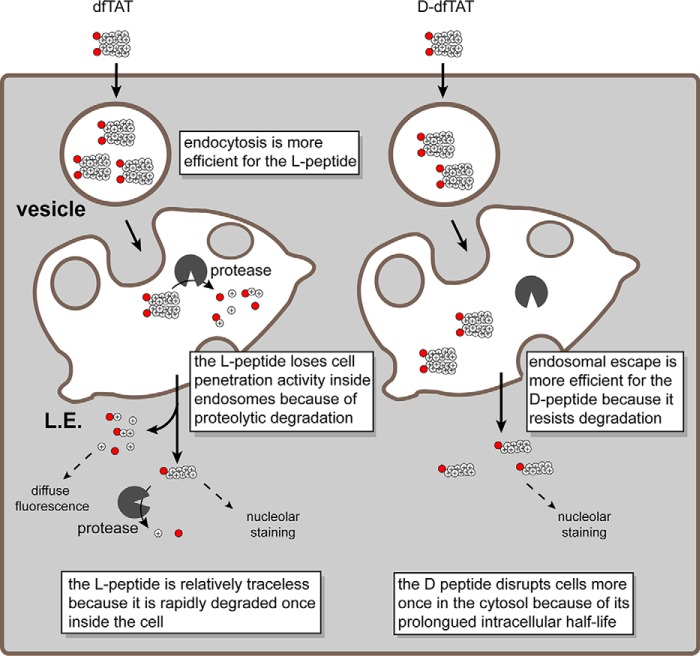
Cell-penetrating peptides (CPPs) are well established as delivery agents for otherwise cell-impermeable cargos. CPPs can also theoretically be used to modulate intracellular processes. However, their susceptibility to proteolytic degradation often limits their utility in these applications. Previous studies have explored the consequences for cellular uptake of converting the residues in CPPs from l- to d-stereochemistry, but conflicting results have been reported and specific steps en route to intracellular activity have not been explored. Here we use dimeric fluorescence TAT as a model CPP to explore the broader consequences of l- to d-stereochemical conversion. We show that inversion of chirality provides protease resistance without altering the overall mode of cellular entry, a process involving endocytic uptake followed by endosomal escape and cytosolic access. However, whereas inversion of chirality reduces endocytic uptake, the d-peptide, once in the endosome, is significantly more prone to escape than its l-counterpart. Moreover, the d-peptide is retained in the cytosol of cells for several days, whereas the l-peptide is degraded within hours. Notably, while the l-peptide is relatively innocuous to cells, the d-peptide exerts a prolonged anti-proliferative activity. Together, our results establish connections between chirality, protease resistance, cellular penetration, and intracellular activity that may be useful for the development of future delivery agents with improved properties.

Keywords: cell permeabilization; cell proliferation; cell-penetrating peptide (CPP); drug delivery system; peptide chemical synthesis; peptides.


Figures

FIGURE 1.
FIGURE 1.
d-dfTAT is protease-resistant, whereas dfTAT is not. A, schematic representation of the amino acid sequence of dfTAT (top) and d-dfTAT (bottom). B, HPLC analysis of dfTAT and d-dfTAT (10 μm) before (0 min time point) and after treatment with trypsin (0.025%). Reactions were quenched at different time intervals with 0.01% TFA in water (1 min, 1 h, and 48 min). Peaks were detected by monitoring the absorbance of the TMR chromophore at 550.8 nm. C, cellular distribution of dfTAT and d-dfTAT after a 1-h incubation. HeLa cells were incubated with dfTAT or d-dfTAT at 1 or 5 μm for 1 h, washed, and then stained with the cell-permeable Hoechst nuclear stain (1 μg/ml). Live cells were imaged with a ×100 objective. Fluorescence images are overlays of the TMR emission at 560 nm (pseudocolored red) and Hoechst emission at 460 nm (pseudocolored blue). Insets to the left show a zoom into the nucleolar staining of each peptide (white arrowheads). Scale bars, 10 μm. D, cellular distribution of dfTAT and d-dfTAT immediately after delivery and after 24 h. HDF cells were incubated with dfTAT or d-dfTAT at 5 μm for 1 h and washed. Cells were imaged with a ×100 objective either immediately after treatment or after an additional 24-h incubation. Fluorescence images are overlays of the TMR emission at 560 nm (pseudocolored red) and Hoechst emission at 460 nm (DNA stain added during imaging, pseudocolored blue). Scale bars, 10 μm. E, analysis of peptide degradation by Tris-Tricine gel electrophoresis of cell lysates. HeLa cells were incubated with 5 μm dfTAT or d-dfTAT for 1 h and lysed either immediately (1 h) or at 1, 3, or 24 h after peptide incubation. Cell lysates were analyzed by electrophoresis along with an aliquot of the peptide solution incubated with cells (medium 1 h) and with a sample of pure peptide. The gel was imaged on a fluorescence scanner. The fluorescent bands were quantified by densitometry to generate the graph presented. The data reported represent the average and corresponding S.D. values (error bars) of biological triplicates.
FIGURE 2.
FIGURE 2.
d-dfTAT enters cells by endocytosis followed by endosomal escape in a manner similar to dfTAT. A, dfTAT and d-dfTAT deliver Cre recombinase into live cells. HeLa cells were transfected with a plasmid containing EGFP upstream of a loxP-STOP-loxP sequence. The cells were then co-incubated with dfTAT or d-dfTAT (5 μm) and 4 μm Cre recombinase. Cells positive for EGFP expression were counted 24 h after the protein delivery treatment. ***, p ≤ 0.001; ****, p ≤ 0.0001 compared with control (TAT-Cre). The bracket indicates comparison of p values obtained using t test analysis of dfTAT and d-dfTAT treatments (ns, p > 0.05). B, cytosolic penetration of d-dfTAT is blocked by expression of dominant negative Rab7. HeLa cells were transfected with Rab7 or dominant negative Rab7 (DN-Rab7). dfTAT or d-dfTAT (3 μm) was then incubated with cells for 1 h, and cell penetration was quantified. The total fluorescence of cell lysates was also measured to assess the impact of each treatment on peptide endocytic uptake. The endocytic uptake of cells transfected with Rab7 or DN-Rab7 was normalized to the endocytic uptake of cells treated with dfTAT or d-dfTAT, respectively. ***, p ≤ 0.001; ****, p ≤ 0.0001 compared with control. C, d-dfTAT causes the release of a peptide preloaded into endosomes but not that of a peptide preloaded into lysosomes. In experiment 1 (exp 1), cells were incubated with DEAC-k5 (20 μm) for 1 h and washed. Cells were then incubated with LysoTracker during imaging to establish the accumulation of DEAC-k5 inside endosomes. In experiment 2 (exp 2), cells were incubated with DEAC-k5 (20 μm) for 1 h, washed, and then incubated with d-dfTAT (5 μm) for 1 h. Experiment 3 (exp 3) was performed as experiment 2 with the exception of a 2-h waiting time between incubation with DEAC-k5 and d-dfTAT. Fluorescence images represented are either monochromatic or pseudocolored green for LysoTracker and blue for DEAC-k5. Scale bars, 10 μm. D, d-dfTAT causes leakage of liposomes with a lipid composition mimicking that of late endosomes. Liposomes loaded with calcein (500 μm) were incubated with dfTAT or d-dfTAT (0.1, 1, or 10 μm). The fluorescence signal of free calcein was quantified after peptide treatment. ns, p > 0.05. The data reported in this figure represent the average and corresponding S.D. values (error bars) of biological triplicates.
FIGURE 3.
FIGURE 3.
Comparison of the cellular uptake and penetration of dfTAT and d-dfTAT. A, evaluation of the cytosolic delivery efficiency of dfTAT and d-dfTAT as a function of peptide concentration in incubation medium. HeLa cells were incubated with peptides (1–10 μm) for 1 h. The percentage of cells detected as positive for penetration was established by microscopy (ns, p > 0.05; **, p ≤ 0.01). B, quantification of whole cell uptake by dfTAT and d-dfTAT as a function of the peptide concentration in incubation medium. HeLa cells were incubated with peptides (1–10 μm) as in A. The overall amount of peptide internalized by cells (endosomal + cytosolic) was assessed by measuring the bulk fluorescence of cell lysates. The illustration summarizes the protocol used for this assay. C, determination of the contribution of peptide export after dfTAT or d-dfTAT treatment. HeLa cells were incubated with 5 μm dfTAT or d-dfTAT for 1 h. The cells were washed, and the medium in all wells was replaced. The medium for each time point condition was removed at the indicated times (0, 0.25, 0.5, 1, 3, and 6 h postincubation). The fluorescence intensity of the medium collected form treated cells was measured and normalized to the medium obtained from untreated cells. All of the data reported in this figure represent the average and corresponding S.D. values (error bars) of biological triplicates.
FIGURE 4.
FIGURE 4.
Protection from degradation confers d-dfTAT with a greater endosomal escape activity when compared with dfTAT. A, evaluation of the endosomal escape activity of dfTAT and d-dfTAT as a function of the total amount of peptide internalized by cells (rationale highlighted in the scheme). The data represented combine the peptide penetration and uptake measured in Fig. 3, A and B. B, a protease inhibitor mixture protects dfTAT from proteolytic degradation before cytosol delivery. HeLa cells were preincubated (40 min) with E-64D (40 μm) and leupeptin (28 μm). Cells were then treated with dfTAT (5 μm) in the presence of E-64D for 10 min. Cell lysates were analyzed by gel electrophoresis. Bands corresponding to intact and degraded peptide, detected using a fluorescence scanner, were quantified by densitometry to generate the bar graph presented. The data reported represent the average and corresponding S.D. values (error bars) of biological triplicates. p values were obtained using t test analysis (*, p ≤ 0.01) between dfTAT with and without inhibitors. C, a protease inhibitor mixture increases the penetration activity of dfTAT but not of d-dfTAT. HDF cells were preincubated (40 min) with the protease inhibitor mixture (40 μm E-64D and 28 μm leupeptin). The cells were then treated with dfTAT or d-dfTAT (2 μm) in the presence of E-64D for 1 h. The percentage of cells detected as positive for penetration was established by microscopy. All data (A and B) represent the mean (mean of geometric means in the case of flow cytometry) of triplicate experiments performed on different days and the corresponding S.D. values. p values were obtained using t test analysis (ns, p > 0.05; **, p ≤ 0.01) between dfTAT and d-dfTAT with or without inhibitors (C). The data reported in this figure represent the average and corresponding S.D. values of biological triplicates.
FIGURE 5.
FIGURE 5.
d-dfTAT impacts cellular proliferation and transcription more dramatically than dfTAT after cytosolic delivery. A, proliferation assays. HDF and MCH58 cells were incubated with 5 μm dfTAT or d-dfTAT for 1 h. Cells were then incubated in growth medium (DMEM plus 10% FBS), and cellular proliferation was monitored over a period of 72 h using an MTT assay. Experiments were performed in triplicates with average and S.D. (error bars) indicated. B, the effect of dfTAT and d-dfTAT treatment on cell growth was monitored by microscopy. MCH58 cells were grown to 50–60% confluence and incubated with 5 μm dfTAT or d-dfTAT for 1 h. Cells were washed and imaged. The cells were then incubated in growth medium (DMEM plus 10% FBS) and imaged again at 48 h. Bright field images of live cells taken immediately after incubation and after 48 h are shown using a ×20 objective. Insets, fluorescence images of dfTAT and d-dfTAT treatment pseudocolored in red (emission 560 nm) and Hoechst emission pseudocolored in cyan (emission 480 nm). Scale bars, 100 μm. C, RNA-seq analysis of HDF and MCH58 cells treated with d-dfTAT or dfTAT (5 μm) in L-15 for 1 h. Untreated cells were incubated without peptide in L-15 for 1 h. After 24 h in growth medium (DMEM plus 10% FBS), cells were pelleted for total RNA extraction. The scatter plots shown display the microarray intensity values of 47,000 transcripts in treated cells (dfTAT or d-dfTAT; y axis) versus untreated cells (x axis). Analyses were performed in duplicate from two independent cell cultures. Both sets of microarray analyses yielded similar results. A representative set of results is shown (both sets are deposited in the GEO Gene Expression Omnibus). The red lines indicate the 2-fold intensity thresholds. The number of genes up- or down-regulated beyond these thresholds are indicated with a red or green arrow, respectively.
FIGURE 6.
FIGURE 6.
Schematic representation modeling the similarities and differences observed in the cellular penetration of dfTAT and d-dfTAT. dfTAT is internalized by endocytosis at a higher level than d-dfTAT. Along the endocytic pathway, dfTAT is partially degraded by proteolytic enzymes, whereas d-dfTAT is not. Upon reaching the late endosome, both dfTAT and d-dfTAT induce the leakage of BMP-containing membranes. Due to proteolytic degradation, the endosomal escape efficiency of dfTAT is, however, diminished compared with d-dfTAT. Upon escaping from late endosomes, d-dfTAT and intact dfTAT are represented as being reduced to their monomer counterparts in the cytosol (e.g. by the action of glutathione). The peptide then diffuses into the cytosolic space and accumulates at nucleoli. The degradation products of dfTAT contribute to a diffuse cytosolic fluorescent distribution. d-dfTAT remains intact inside cells for several days and impacts the physiology of cells negatively. In contrast, cytosolic enzymes degrade dfTAT in a matter of hours. This in turn leads to a dramatically diminished physiological impact.

Similar articles

Cited by

References

    1. Bechara C., and Sagan S. (2013) Cell-penetrating peptides: 20 years later, where do we stand? FEBS Lett. 587, 1693–1702 - PubMed
    1. Zorko M., and Langel U. (2005) Cell-penetrating peptides: mechanism and kinetics of cargo delivery. Advanced Drug Deliv. Rev. 57, 529–545 - PubMed
    1. Gupta B., Levchenko T. S., and Torchilin V. P. (2005) Intracellular delivery of large molecules and small particles by cell-penetrating proteins and peptides. Adv. Drug Deliv. Rev. 57, 637–651 - PubMed
    1. Krosl J., Austin P., Beslu N., Kroon E., Humphries R. K., and Sauvageau G. (2003) In vitro expansion of hematopoietic stem cells by recombinant TAT-HOXB4 protein. Nat. Med. 9, 1428–1432 - PubMed
    1. Morris M. C., Depollier J., Mery J., Heitz F., and Divita G. (2001) A peptide carrier for the delivery of biologically active proteins into mammalian cells. Nat. Biotechnol. 19, 1173–1176 - PubMed

Publication types