. 2017 Jan 27;292(4):1145-1159.
doi: 10.1074/jbc.M116.756288. Epub 2016 Dec 6.

The Chemical Basis of Thiol Addition to Nitro-conjugated Linoleic Acid, a Protective Cell-signaling Lipid

Affiliations

The Chemical Basis of Thiol Addition to Nitro-conjugated Linoleic Acid, a Protective Cell-signaling Lipid

Lucía Turell et al. J Biol Chem. .

Abstract

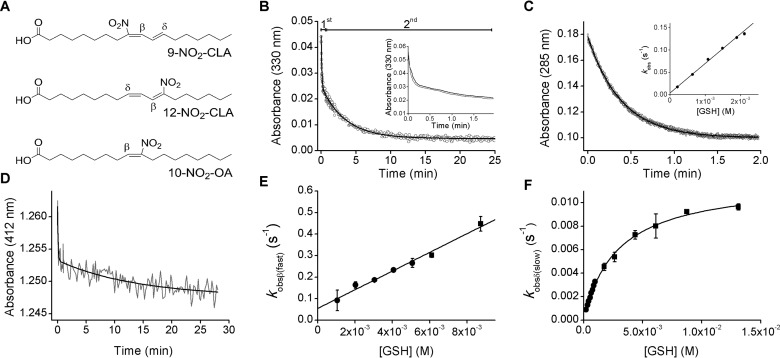
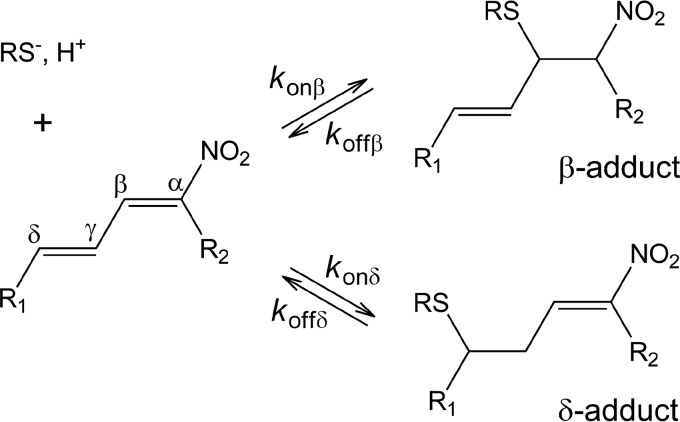
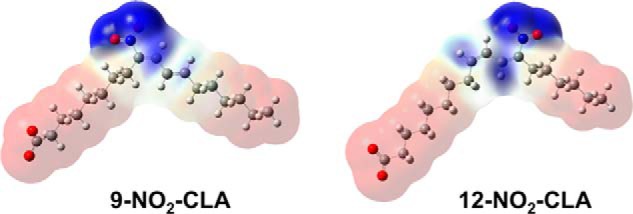
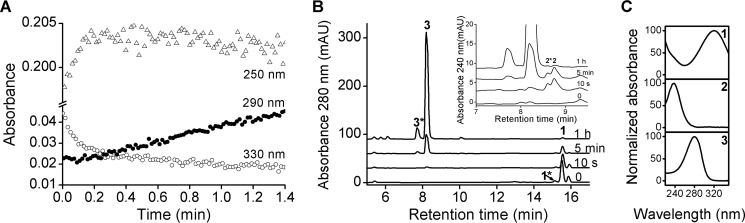
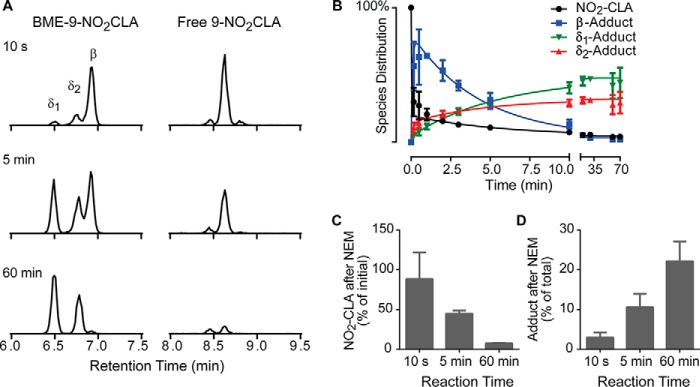
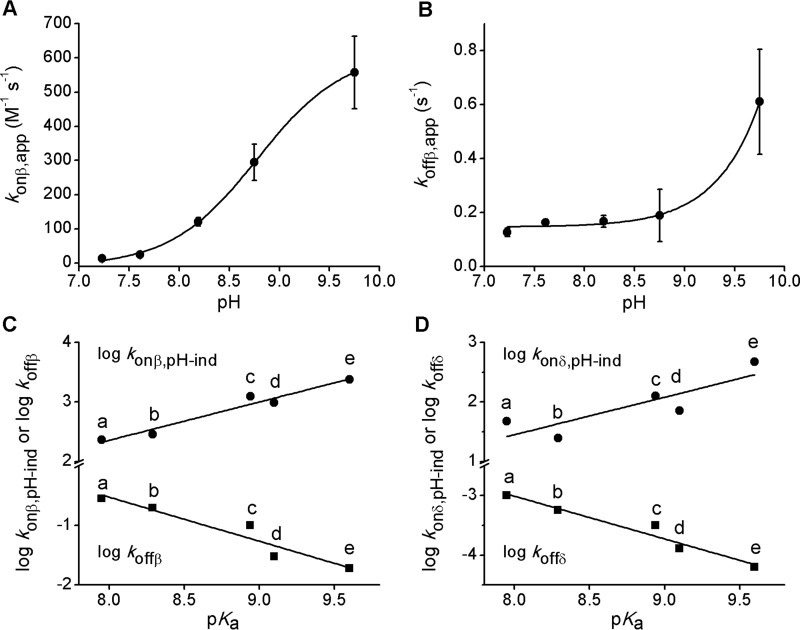
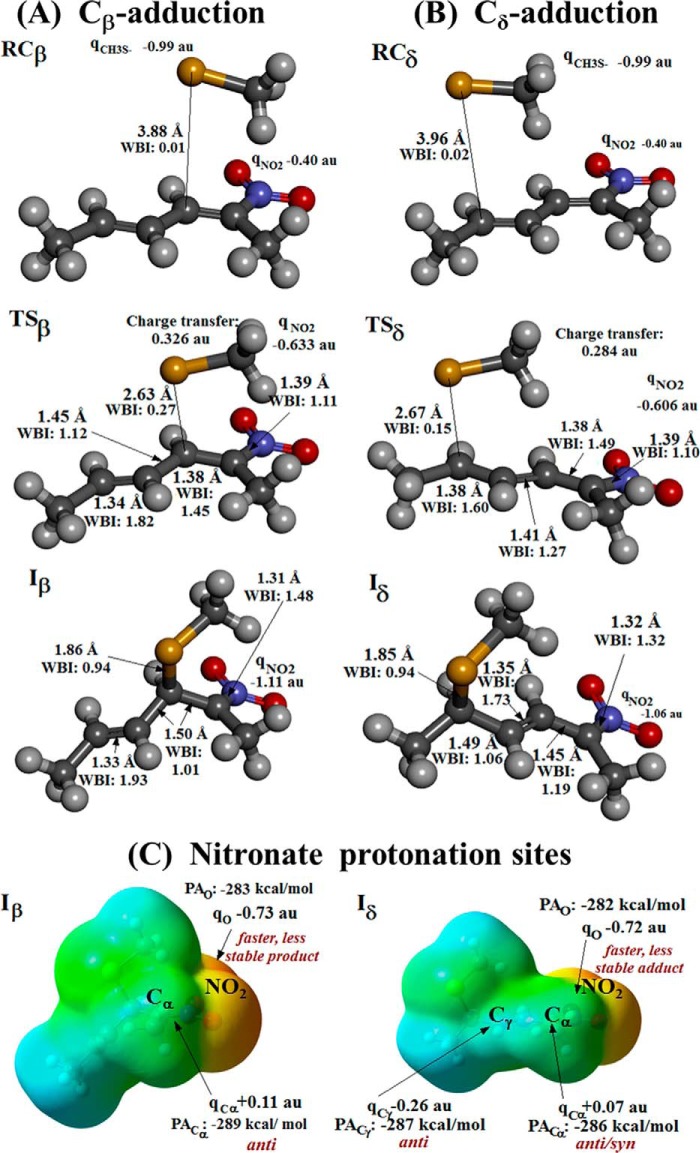
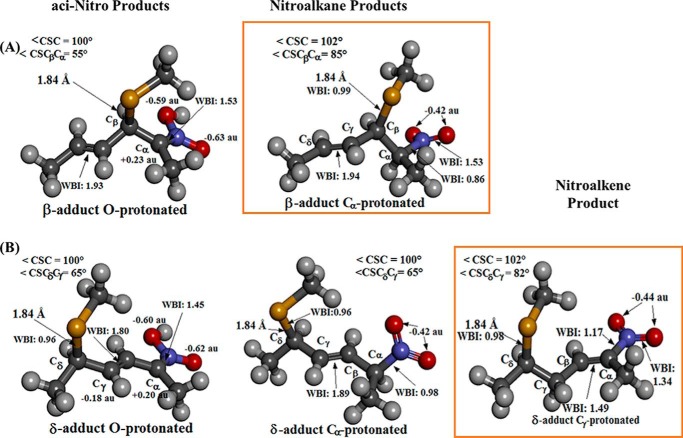
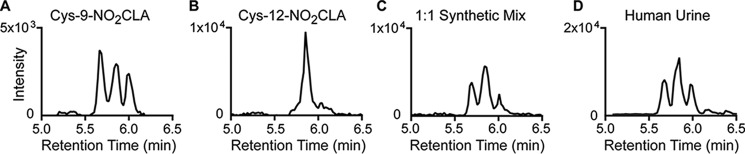
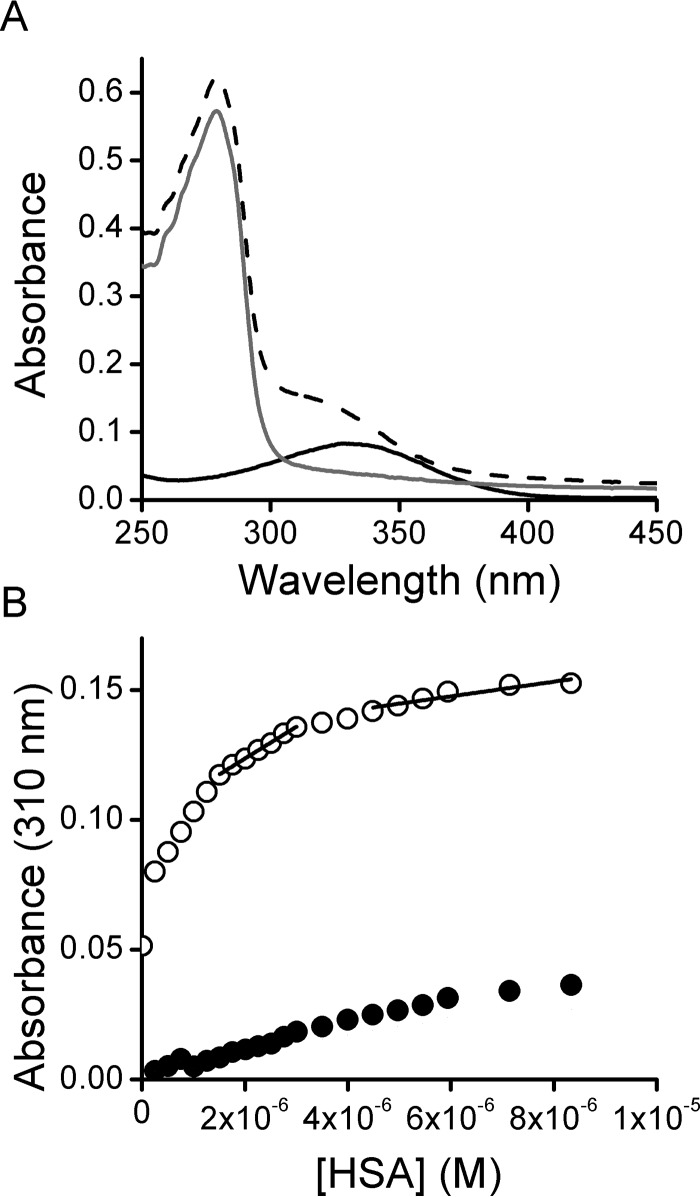
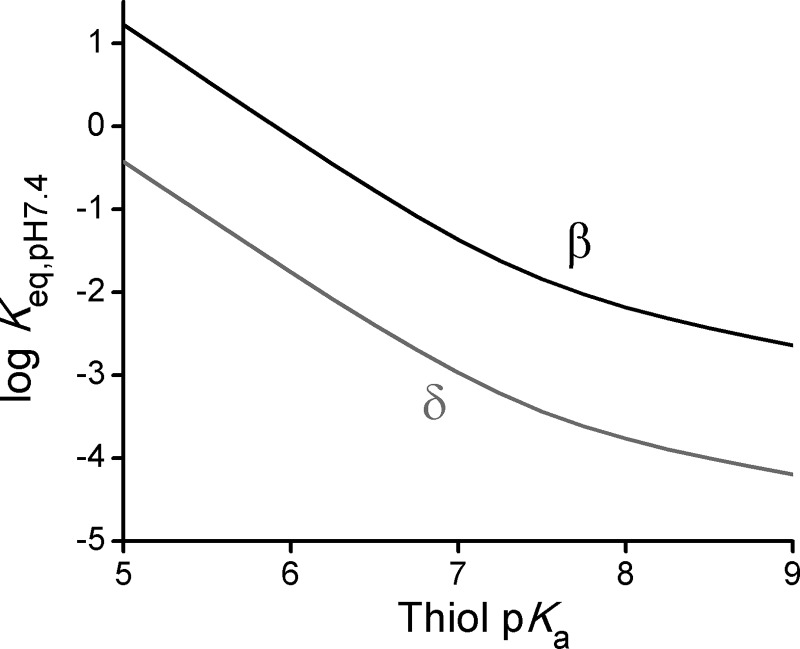
Nitroalkene fatty acids are formed in vivo and exert protective and anti-inflammatory effects via reversible Michael addition to thiol-containing proteins in key signaling pathways. Nitro-conjugated linoleic acid (NO2-CLA) is preferentially formed, constitutes the most abundant nitrated fatty acid in humans, and contains two carbons that could potentially react with thiols, modulating signaling actions and levels. In this work, we examined the reactions of NO2-CLA with low molecular weight thiols (glutathione, cysteine, homocysteine, cysteinylglycine, and β-mercaptoethanol) and human serum albumin. Reactions followed reversible biphasic kinetics, consistent with the presence of two electrophilic centers in NO2-CLA located on the β- and δ-carbons with respect to the nitro group. The differential reactivity was confirmed by computational modeling of the electronic structure. The rates (kon and koff) and equilibrium constants for both reactions were determined for different thiols. LC-UV-Visible and LC-MS analyses showed that the fast reaction corresponds to β-adduct formation (the kinetic product), while the slow reaction corresponds to the formation of the δ-adduct (the thermodynamic product). The pH dependence of the rate constants, the correlation between intrinsic reactivity and thiol pKa, and the absence of deuterium solvent kinetic isotope effects suggested stepwise mechanisms with thiolate attack on NO2-CLA as rate-controlling step. Computational modeling supported the mechanism and revealed additional features of the transition states, anionic intermediates, and final neutral products. Importantly, the detection of cysteine-δ-adducts in human urine provided evidence for the biological relevance of this reaction. Finally, human serum albumin was found to bind NO2-CLA both non-covalently and to form covalent adducts at Cys-34, suggesting potential modes for systemic distribution. These results provide new insights into the chemical basis of NO2-CLA signaling actions.

Keywords: Michael addition; albumin; conjugated nitrolinoleic acid; elimination; fatty acid; kinetics; nitro fatty acid; nitroalkene fatty acid; sulfhydryl; thiol.


Figures

FIGURE 1.
FIGURE 1.
Reactions of NO2-CLA with thiols at pH 7.4. A, structures of 9- and 12-NO2-CLA and of 10-NO2-OA showing the electrophilic β- or δ-carbons. B, a mixture of 9- and 12-NO2-CLA (∼10 μm) was mixed with GSH (3 mm) in phosphate buffer (0.1 m) containing DTPA (0.1 mm) at pH 7.4 and 25 °C, and the absorbance at 330 nm was registered. The black trace represents the best fit to a bi-exponential function. Inset, purified 9-NO2-CLA (black trace) or 12-NO2-CLA (gray trace) were mixed with GSH as in B. C, NO2-OA (10 μm) was mixed with GSH (0.6 mm), and the absorbance at 285 nm was registered. Inset, kobs values at increasing GSH concentrations (0.2–2 mm) were determined from the best fit to single exponential functions. The symbols represent the means ± S.E. (n = 4). Some error bars are smaller than the symbols. D, NO2-CLA (∼10 μm) was mixed with TNB (90 μm), and the absorbance at 412 nm was recorded. E, kobs values for the fast phase of the reaction between NO2-CLA and GSH were determined from kinetic traces as in B. Different symbols represent the means ± S.E. of representative independent experiments; squares, n = 3; circles, n = 4. F, same as in E but kobs correspond to the slow phase; circles, n = 1; squares, means ± S.E., n ≥ 3.
SCHEME 1.
SCHEME 1.
Reactions between NO2-CLA and low molecular weight thiols. R1 = (CH2)5CH3 for 9-NO2-CLA or (CH2)7CO2H for 12-NO2-CLA; R2 = (CH2)7CO2H for 9-NO2-CLA or (CH2)5CH3 for 12-NO2-CLA, RS = thiolate.
FIGURE 2.
FIGURE 2.
Electrophilic centers in 9-/12-NO2-CLA regioisomers. Fukui f+(r) function for nucleophilic attack mapped on a total electron density surface of 0.0004 au as determined in aqueous solution at the PCM(IEF)-ωB97X-D/6-31+G(d,p) level of theory. Positive areas depicted in blue represent the electrophilic regions. The coloring scheme spans from −6.0 × 10⁻⁷ au in red to 1.1 × 10⁻⁴ au in blue.
FIGURE 3.
FIGURE 3.
UV-Visible analysis of the reaction between NO2-CLA and thiols. A, time course changes in absorbance at 330 (open circles), 290 (black circles), and 250 nm (open triangles) for the reaction between NO2-CLA (10 μm) and GSH (3 mm). B, representative LC-UV-visible traces of the reaction between purified 9-NO2-CLA (100 μm) and BME (1.76 mm). Aliquots were obtained at the indicated time points before LC-UV-visible analysis. C, UV-visible spectra for 9-NO2-CLA (panel 1) and both β- (panel 2) and δ-adducts (panel 3). Asterisks indicate minor peaks derived from contaminant 12-NO2-CLA.
FIGURE 4.
FIGURE 4.
LC-MS/MS analysis of the reaction between NO2-CLA and BME. A, purified 9-NO2-CLA (10 μm) was reacted with BME (1.76 mm), and aliquots were obtained at 10 s (top), 5 min (middle), and 60 min (bottom) for analysis of free NO2-CLA (right) and BME-NO2-CLA adducts (left). B, representative time course for 9-NO2-CLA reaction with BME. C and D, aliquots collected at the indicated times were incubated with NEM (100 mm), and the percentage of free NO2-CLA with respect to that at time 0 (C) and the percentage of BME-NO2-CLA adduct with respect to NEM-untreated controls (D) were determined. Data are representative of three independent experiments.
FIGURE 5.
FIGURE 5.
pH-dependence and correlations with thiol pKa. A and B, fast reaction between GSH and NO2-CLA was studied at different pH values using three-component constant ionic strength buffers. Apparent konβ (A) and koffβ (B) values were obtained as in Fig. 1E and Equation 1 from the fit of plots of kobs versus GSH concentration to a straight line; the error bars represent the standard error of the fit. C and D, Brønsted plots for fast (C) and slow (D) reactions. The logarithm of kon, pH-indep rate constants (circles, calculated from kon values at pH 7.4) and koff (squares) were plotted against thiol pKa values. Data are from Table 1; a, cysteinylglycine; b, cysteine; c, GSH; d, homocysteine; e, BME.
FIGURE 6.
FIGURE 6.
Structural features of the species involved in β- and δ-adduction as determined by PCM-DFT modeling in aqueous solution using CH3S as representative thiol and a model 2-nitrohexa-2,4-diene compound containing the reactive region of NO2-CLA. A and B, reactants complex, transition state, and nitronate intermediate, respectively, characterized for thiolate β-adduction (RCβ, TSβ, and Iβ) or δ-adduction (RCδ, TSδ, and Iδ). Atoms are colored by element, and a selection of relevant bond lengths, WBI, and NPA atomic/group charges labeled as qX (X represents an atom or group of atoms) featuring geometrical and electronic reorganization along each reaction channel is highlighted in proximity to the structures. Net charge transfer between reactants is evidenced at each TS. C, relevant properties toward Iβ/Iδ nitronate protonation: MEP mapped on a total electron density surface of 0.004 au (notice that the underlying structures retain the orientation shown immediately above in A and B for each species), NPA atomic charges, and proton affinities (PA) at each O/C protonation site. All properties calculated at the PCM(IEF)-ωB97X-D/6–31+G(d,p) level in aqueous solution. MEP coloring scheme spans from −0.245 (red) to −0.04 au (cyan-blue). Although electrostatics favor a faster protonation at NO2 oxygens in both cases, Cα/γ targets lead to more stable products, displaying mostly anti stereochemistry due to steric restrictions, as evidenced in red labels.
FIGURE 7.
FIGURE 7.
Structural features of the possible neutral products characterized at the PCM(IEF)-ωB97X-D/6-31+G(d,p) level in aqueous solution. A, O-protonated aci-Nitro and Cα-protonated nitroalkane β-adducts. B, O-protonated aci-Nitro, Cα-protonated nitroalkane, and Cγ-protonated nitroalkene δ-adducts. Atoms are colored by element, and a selection of the more relevant bond lengths and angles, WBIs, and NPA atomic charges on O, Cα, and Cγ obtained at the same level of theory are reported in the proximity of relevant bonds and atoms at each structure. The expected kinetic and thermodynamic prevalent products (Cα-protonated nitroalkane β-adduct and Cγ-protonated nitroalkene δ-adduct, respectively) are framed in orange.
FIGURE 8.
FIGURE 8.
LC-MS/MS profile of endogenous δ-Cys-NO2-CLA addition products in human urine. Comparison of isotopically labeled standards generated from the δ-addition of cysteine to 9-NO2-CLA (A), 12-NO2-CLA (B), a 1:1 mixture of both standards (C), and urine Cys-NO2-CLA (D). Data were obtained from a single urine donor with LC-MS/MS profiles consistent with published reports (1, 2).
FIGURE 9.
FIGURE 9.
NO2-CLA binding to HSA. A, UV-Visible spectra of 16 μm thiol-blocked delipidated HSA (gray trace), 10 μm NO2-CLA (black trace), and the combination of both reagents (dashed trace). B, thiol-blocked delipidated HSA (0.2–10 μm) was mixed with NO2-CLA (10 μm), and UV-visible spectra were recorded. The absorbance at 310 nm was plotted against HSA concentration, and the amount of NO2-CLA bound was determined from the change in the slope (open circles). A control without NO2-CLA was included (black circles).
FIGURE 10.
FIGURE 10.
Predicted stability of the adducts at pH 7.4 as a function of thiol pKa. The logarithm of the apparent dissociation equilibrium constant (Keq) at pH 7.4 of β- (black) and δ- (gray) adducts was calculated from Eq. 6 using parameters obtained from Fig. 5.

References

    1. Delmastro-Greenwood M., Hughan K. S., Vitturi D. A., Salvatore S. R., Grimes G., Potti G., Shiva S., Schopfer F. J., Gladwin M. T., Freeman B. A., and Gelhaus Wendell S. (2015) Nitrite and nitrate-dependent generation of anti-inflammatory fatty acid nitroalkenes. Free Radic. Biol. Med. 89, 333–341 - PMC - PubMed
    1. Salvatore S. R., Vitturi D. A., Baker P. R., Bonacci G., Koenitzer J. R., Woodcock S. R., Freeman B. A., and Schopfer F. J. (2013) Characterization and quantification of endogenous fatty acid nitroalkene metabolites in human urine. J. Lipid Res. 54, 1998–2009 - PMC - PubMed
    1. Vitturi D. A., Minarrieta L., Salvatore S. R., Postlethwait E. M., Fazzari M., Ferrer-Sueta G., Lancaster J. R. Jr, Freeman B. A., and Schopfer F. J. (2015) Convergence of biological nitration and nitrosation via symmetrical nitrous anhydride. Nat. Chem. Biol. 11, 504–510 - PMC - PubMed
    1. Schopfer F. J., Cipollina C., and Freeman B. A. (2011) Formation and signaling actions of electrophilic lipids. Chem. Rev. 111, 5997–6021 - PMC - PubMed
    1. Vitturi D. A., Chen C. S., Woodcock S. R., Salvatore S. R., Bonacci G., Koenitzer J. R., Stewart N. A., Wakabayashi N., Kensler T. W., Freeman B. A., and Schopfer F. J. (2013) Modulation of nitro-fatty acid signaling: prostaglandin reductase-1 is a nitroalkene reductase. J. Biol. Chem. 288, 25626–25637 - PMC - PubMed

Publication types

LinkOut - more resources