. 2017 Feb 15;77(4):982-995.
doi: 10.1158/0008-5472.CAN-16-1589. Epub 2016 Dec 6.

RB Loss Promotes Prostate Cancer Metastasis

Affiliations

RB Loss Promotes Prostate Cancer Metastasis

Chellappagounder Thangavel et al. Cancer Res. .

Abstract

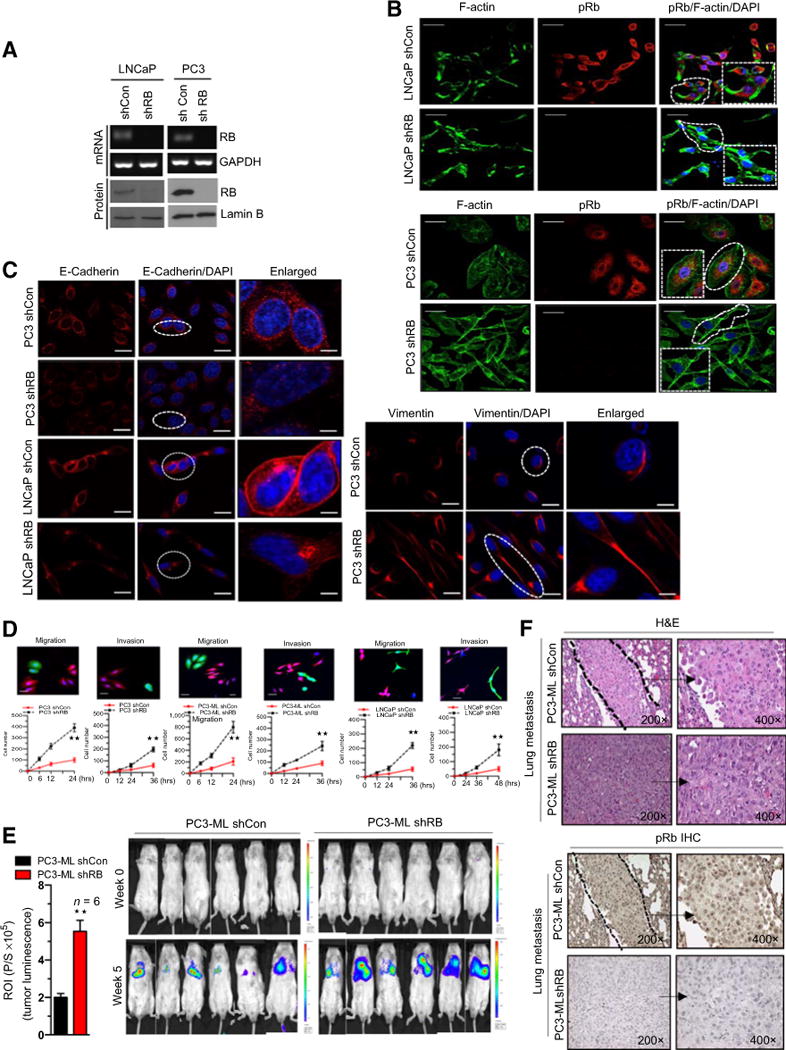
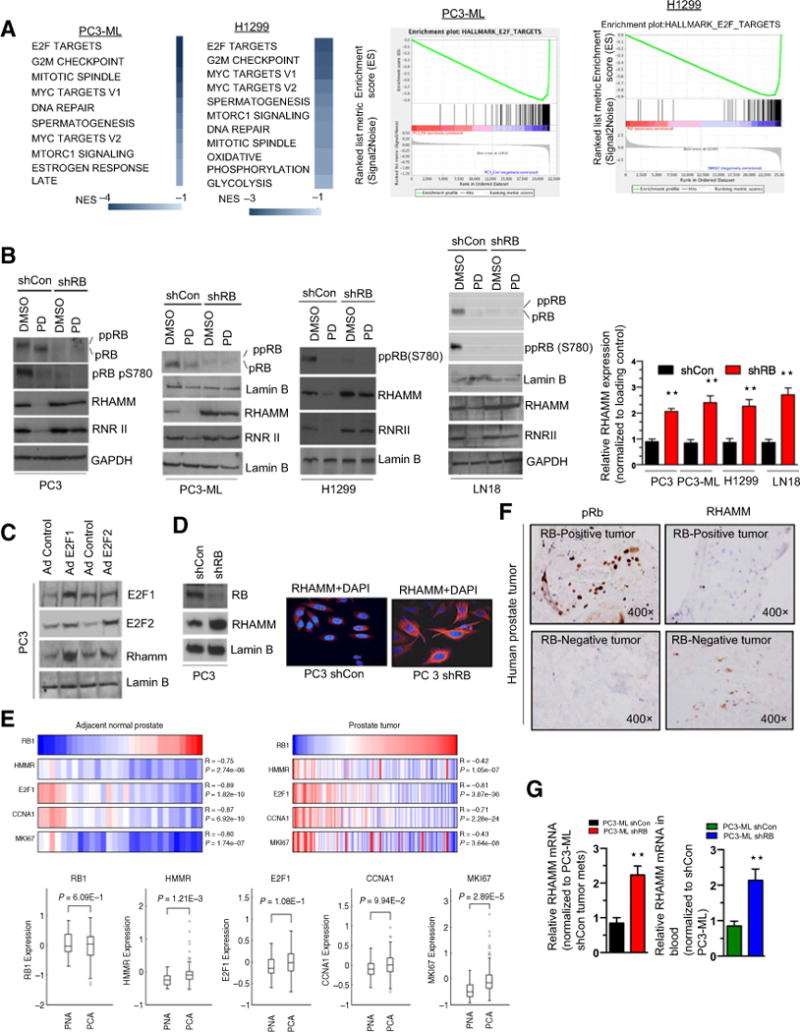
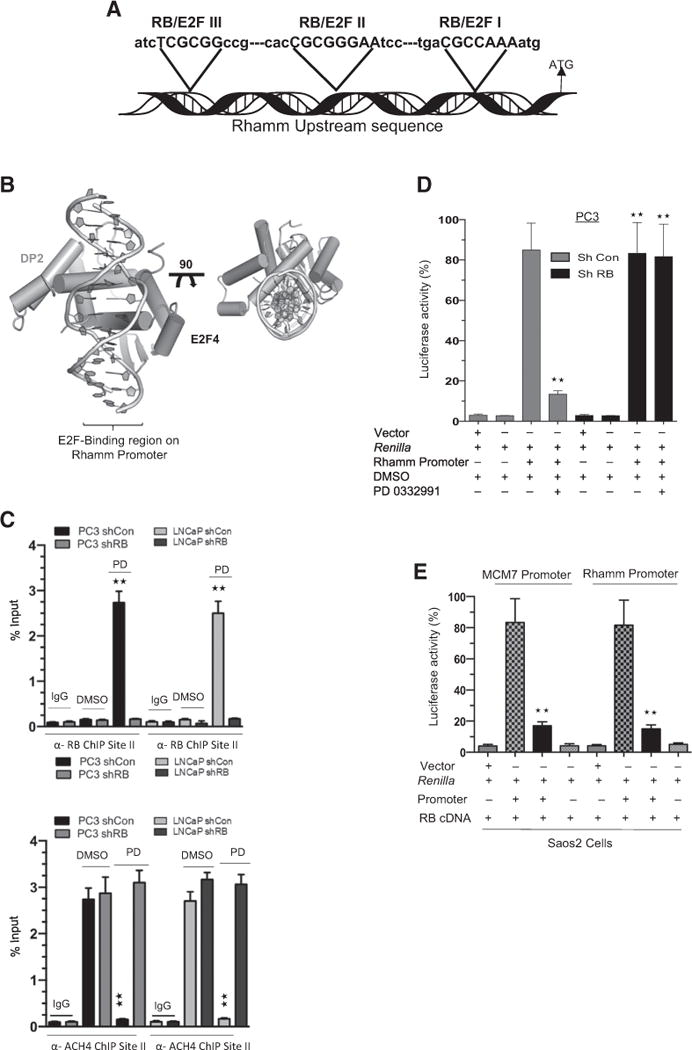
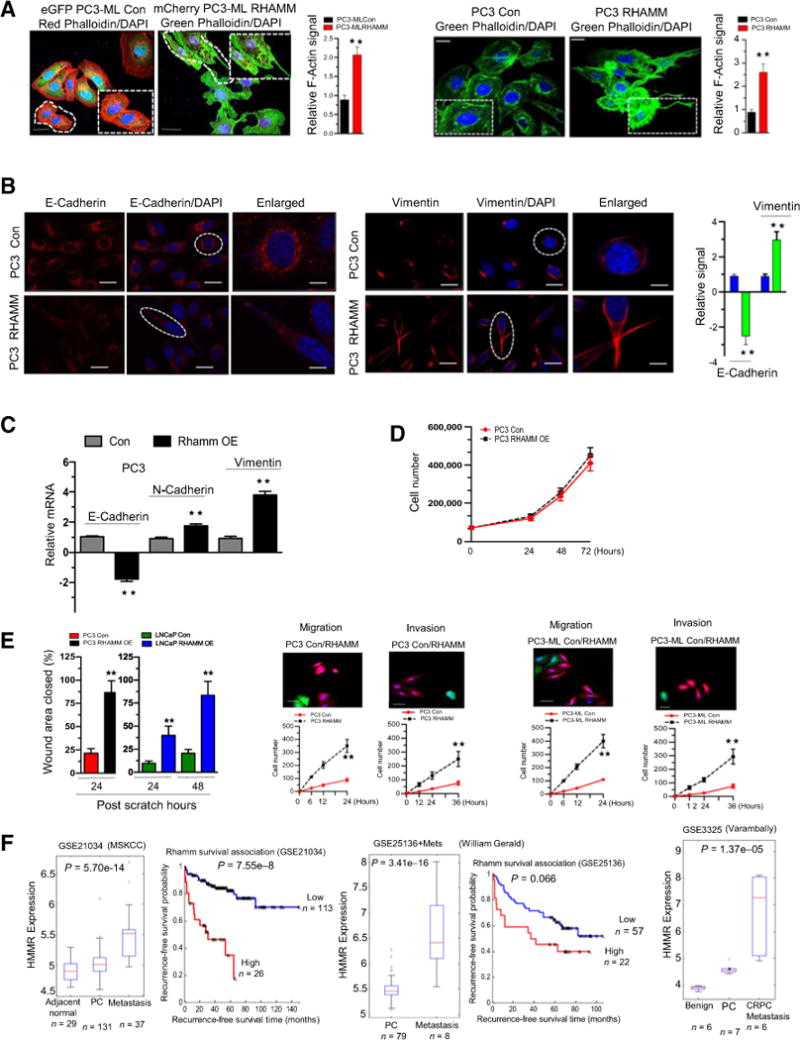
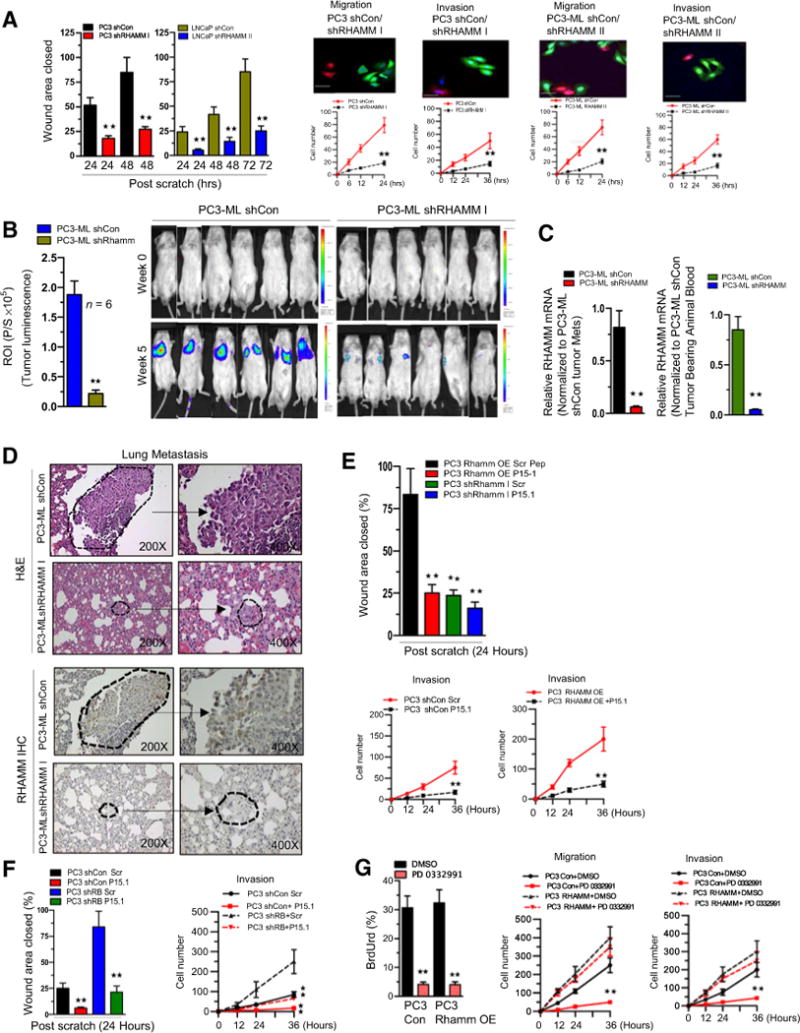
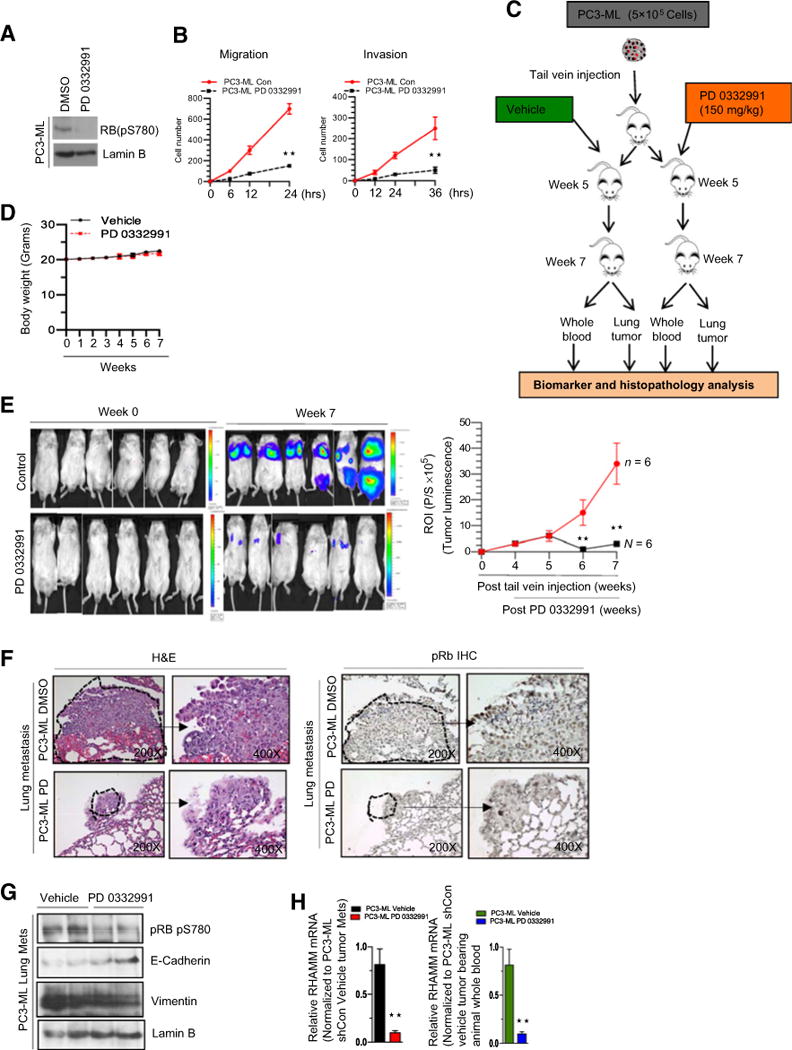
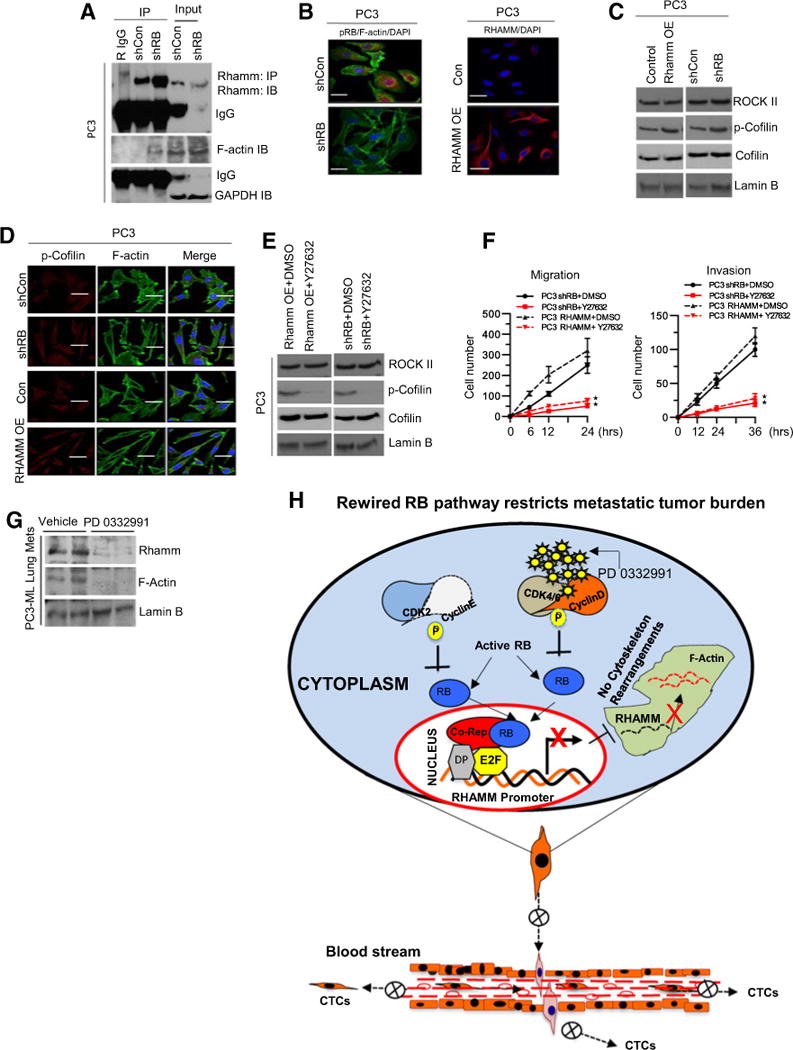
RB loss occurs commonly in neoplasia but its contributions to advanced cancer have not been assessed directly. Here we show that RB loss in multiple murine models of cancer produces a prometastatic phenotype. Gene expression analyses showed that regulation of the cell motility receptor RHAMM by the RB/E2F pathway was critical for epithelial-mesenchymal transition, motility, and invasion by cancer cells. Genetic modulation or pharmacologic inhibition of RHAMM activity was sufficient and necessary for metastatic phenotypes induced by RB loss in prostate cancer. Mechanistic studies in this setting established that RHAMM stabilized F-actin polymerization by controlling ROCK signaling. Collectively, our findings show how RB loss drives metastatic capacity and highlight RHAMM as a candidate therapeutic target for treating advanced prostate cancer. Cancer Res; 77(4); 982-95. ©2016 AACR.


Conflict of interest statement

Disclosure of Potential: No potential conflicts of interest were disclosed by the other authors.

Figures

Figure 1
Figure 1
RB loss promotes cancer metastasis. A, RT-PCR analysis of RB, GAPDH mRNA, RB, and lamin B immunoblot in shCon and shRB LNCaP and PC3 cells. B, Confocal microscopic images of F-actin, pRb, and DAPI immunofluorescence in shCon and shRB LNCaP and PC3 cells. C, Confocal microscopic images of E-cadherin in shCon and shRB PC3 and LNCaP cells (left) and confocal microscopic images of vimentin in shCon and shRB PC3 cells (right). D, Graphic representation of quantitative migration kinetics with noncoated Boyden chamber and cell invasion kinetics with Matrigel-coated Boyden chamber in RB-proficient and -deficient PC3, PC3-ML, and LNCaP cells. E, Graphic representation of tumor luminescence from shCon and shRB PC3-ML tumor metastases in male SCIDs, with representative images (left and right). F, hematoxylin and eosin (H&E) and pRb staining of RB-proficient and -deficient PC3-ML tumor metastases at ×200 and ×400 (right). Each group contained a minimum of 6 animals. Each data point is a mean ± SD from three or more independent experiments. **, P < 0.05 was considered as statistically significant. Scale bar, 50 μm.
Figure 2
Figure 2
Transcriptome array predicts RHAMM as an E2F target gene and RHAMM expression inversely correlates with RB status. A, KEGG pathway analysis of differentially expressed transcripts from microarray analysis of RB-proficient parental PC3-ML and H1299 cells treated with either DMSO or PD 0332991 (left). GSEA analysis of the E2F target hallmarks in PC3-ML and H1299 cells (right). B, Western blotting analysis of RB, phospho RB pS780, RHAMM, RNRII, and lamin B in shCon and shRB PC3-ML, PC3, H1299, LN18 cells (left) and quantitation of RHAMM protein analysis in response to DMSO or PD 0332991 (right). C, Immunoblotting analysis of E2F1, E2F2, RHAMM, and lamin B in control and ectopically expressed adenovirus harboring E2F1 or E2F2 cDNA in PC3 cells. D, Immunoblotting analysis of RB, RHAMM, and lamin B in shCon and shRB PC3 cells (left) with immunofluorescence confocal microscopic images of RHAMM in shCon and shRB PC3 cells (right). E, In silico analysis and heatmap of HMMR, E2F1, CCNA1, and MKI67 with respect to RB1 transcript status in normal prostate (top left) and prostate tumor clinical specimens (top right) and quantitation (box plot) of HMMR, E2F1, CCNA1, and MKI67 with respect to RB1 transcript in normal and prostate tumors specimens (bottom). F, IHC analysis of pRb and RHAMM in RB-proficient and RB-deficient human prostate clinical specimens; representative samples are shown (×400). G, qRT-PCR analysis of RHAMM mRNA from lung metastases and whole blood of shCon and shRB PC3-ML tumor–bearing animals. Each data point is a mean ± SD from three or more independent experiments. **, P < 0.05 was considered as statistically significant. Scale bar, 50 μm.
Figure 3
Figure 3
RB/E2F complex transcriptionally regulates RHAMM. A, Schematic illustration shows the location of three putative RB/E2F–binding sites on the RHAMM promoter. B, Docking model shows the RB/E2F binding region on the RHAMM promoter. C, Anti-RB (top) and anti-ACH4 (bottom) chromatin immunoprecipitation (ChIP) analysis at the RB/E2F–binding site II on the RHAMM promoter. shCon and shRB PC3 cells were treated with either DMSO or PD 0332991. D, Transcription analysis of RHAMM promoter via luciferase assay in shCon and shRB PC3 cells in response to PD 0332991 or DMSO. E, RB-specific transcription activation of RHAMM promoter and known RB target promoter MCM7 in RB-deficient Saos2 cells in response to ectopic expression of RB-cDNA or vector control. Each data point is a mean ± SD from three or more independent experiments. **, P < 0.05 was considered as statistically significant.
Figure 4
Figure 4
RHAMM overexpression mimics the RB loss metastatic phenotype and is a clinically meaningful marker of metastatic disease. A, Confocal microscopic images of F-actin staining (phalloidin) in control and RHAMM-overexpressing PC3-ML and PC3 cells with quantification (left and right). B, Immunofluorescence of confocal microscopic images of E-cadherin (left) and vimentin (middle) in control and RHAMM-overexpressing PC3 cells with quantification (right). C, qRT-PCR analysis of E-cadherin, N-cadherin, and vimentin mRNA. D, Short-term growth assay in control and RHAMM-overexpressing PC3 cells. E, Graphic representation of scratch assay in control and RHAMM-overexpressing PC3 and LNCaP cells (left), quantitative cell migration, and invasion kinetics in control and RHAMM-overexpressing PC3 and PC3-ML (right). F, Analysis of differential expression of HMMR transcript in human prostate metastatic samples versus primary tumor samples (GSE21034, ref. ; GSE25136, ref. ; GSE3225, ref. 14) and Kaplan–Meier survival curve (P values are presented in figure). For each data point, there is a mean ± SD from three or more independent experiments. **, P < 0.05 was considered as statistically significant except in silico analysis. Scale bar, 50 μm.
Figure 5
Figure 5
Inhibition of RHAMM activity reverses the RB loss prometastatic phenotype. A, Graphic representation of scratch assay (left), confocal microscopic images and quantitative cell migration and invasion kinetics in RHAMM-proficient and -deficient PC3 and PC3-ML (right). B, Graphic representation of tumor luminescence in shCon and shRHAMM PC3 cells tumor lung metastases (left) and representative images (right). Each group contained at least 6 animals per treatment condition. C, qRT-PCR analysis of RHAMM mRNA from lung metastases and whole blood of shCon and shRHAMM PC3-ML tumor–bearing animals. D, hematoxylin and eosin (H&E) and RHAMM protein IHC staining of lung metastases at ×200 and ×400 (middle). E, Graphic representation of scratch assay in control, shRHAMM I, and RHAMM-overexpressing PC3 cells in response to RHAMM peptide mimetic (top) and quantitative cell invasion kinetics in control and RHAMM-overexpressing PC3 cells in response to RHAMM peptide mimetic (bottom). F, Graphic representation of scratch assay (left) and quantitative invasion kinetics (right) in shCon and shRB PC3 cells in response to RHAMM peptide mimetic. G, Bromodeoxyuridine (BrdUrd) incorporation (left), quantitative cell migration and invasion kinetics (right) in RHAMM-overexpressing PC3 or control cells in response to DMSO or PD 0332991. For each data point, there is a mean ± SD from three or more independent experiments. **, P < 0.05 was considered as statistically significant. Scale bar, 50 μm.
Figure 6
Figure 6
Reprogramming of RB/E2F pathway via CDK4/6 inhibition restricts metastases. A, Western blotting analysis of phospho RB pS780 and lamin B. B, Quantitative cell migration and invasion kinetics in PC3-ML cells treated with DMSO or PD 0332991. C, Schematic representation of experimental design showing experimental metastasis and timing of drug treatments and endpoint analysis. D, Graphic representation of weekly body weights in response to PD 0332991 treatment. E, Representative images with indicated time points (left) and graphic representation of tumor luminescence (right). F, Hematoxylin and eosin (H&E) and pRb IHC staining (×200 and ×400) of lung metastases in response to vehicle or PD 0332991. Arrow, enlarged region. G, Western blotting analysis of phospho RB pS780, E-cadherin, vimentin, and lamin B in PC3-ML–induced lung metastases in response to DMSO or PD 0332991. H, qRT-PCT analysis of RHAMM mRNA from lung tissue and whole blood of PC3-ML tumor–bearing animals treated with DMSO or PD 0332991. Each experimental group used 6 or more animals. Each data point is a mean ± SD from three or more independent experiments. **, P < 0.05 was considered as statistically significant.
Figure 7
Figure 7
RHAMM signaling via Rho-associated protein kinase impacts the prometastatic phenotype. A, Coimmunoprecipitation of RHAMM and immunoblotting of RHAMM, F-actin, and loading control GAPDH in control and RB-deficient PC3 cells. B, Immunofluorescence confocal images of pRB and F-actin in RB-proficient and -deficient PC3 cells (left) and confocal images of RHAMM in control and RHAMM-overexpressing PC3 cells (right). C, Western blot analysis of ROCK II, p-Cofilin, cofilin, and lamin B in control, RHAMM-overexpressing, and RB-deficient PC3 cells. D, Immunoflourescence confocal images of localized F-actin, pRb, p-Cofilin, and RHAMM in control, RHAMM-overexpressing, and RB-deficient PC3 cells. E, Immunoblotting analysis of ROCK II, p-Cofilin, cofilin, and lamin B in RHAMM-overexpressing and RB-deficient PC3 cells treated with DMSO or Rho kinase inhibitor (Y27632). F, Quantitative cell migration and invasion kinetics in RB-deficient and RHAMM-overexpressing PC3 cells in response to DMSO or Y27632. G, Immunoblotting analysis of RHAMM, F-actin, and lamin B in PC3-ML–induced lung metastases treated with control or PD 0332991. H, Schematic illustration of the proposed working model. Each data point is a mean ± SD from three or more independent experiments. **, P < 0.05 was considered as statistically significant. Scale bar, 50 μm.

References

    1. Chen HZ, Tsai SY, Leone G. Emerging roles of E2Fs in cancer: an exit from cell cycle control. Nat Rev Cancer. 2009;9:785–97. - PMC - PubMed
    1. Manning AL, Dyson NJ. RB: mitotic implications of a tumour suppressor. Nat Rev Cancer. 2012;12:220–6. - PMC - PubMed
    1. Knudsen ES, McClendon AK, Franco J, Ertel A, Fortina P, Witkiewicz AK. RB loss contributes to aggressive tumor phenotypes in MYC-driven triple negative breast cancer. Cell Cycle. 2015;14:109–22. - PMC - PubMed
    1. Sharma A, Comstock CE, Knudsen ES, Cao KH, Hess-Wilson JK, Morey LM, et al. Retinoblastoma tumor suppressor status is a critical determinant of therapeutic response in prostate cancer cells. Cancer Res. 2007;67:6192–203. - PMC - PubMed
    1. Kim KJ, Godarova A, Seedle K, Kim MH, Ince TA, Wells SI, et al. Rb suppresses collective invasion, circulation and metastasis of breast cancer cells in CD44-dependent manner. PLoS One. 2013;8:e80590. - PMC - PubMed

Publication types

MeSH terms