. 2016 Dec 6;7(6):e01991-16.
doi: 10.1128/mBio.01991-16.

Antiviral Innate Immune Response Interferes with the Formation of Replication-Associated Membrane Structures Induced by a Positive-Strand RNA Virus

Affiliations

Antiviral Innate Immune Response Interferes with the Formation of Replication-Associated Membrane Structures Induced by a Positive-Strand RNA Virus

Diede Oudshoorn et al. mBio. .

Abstract

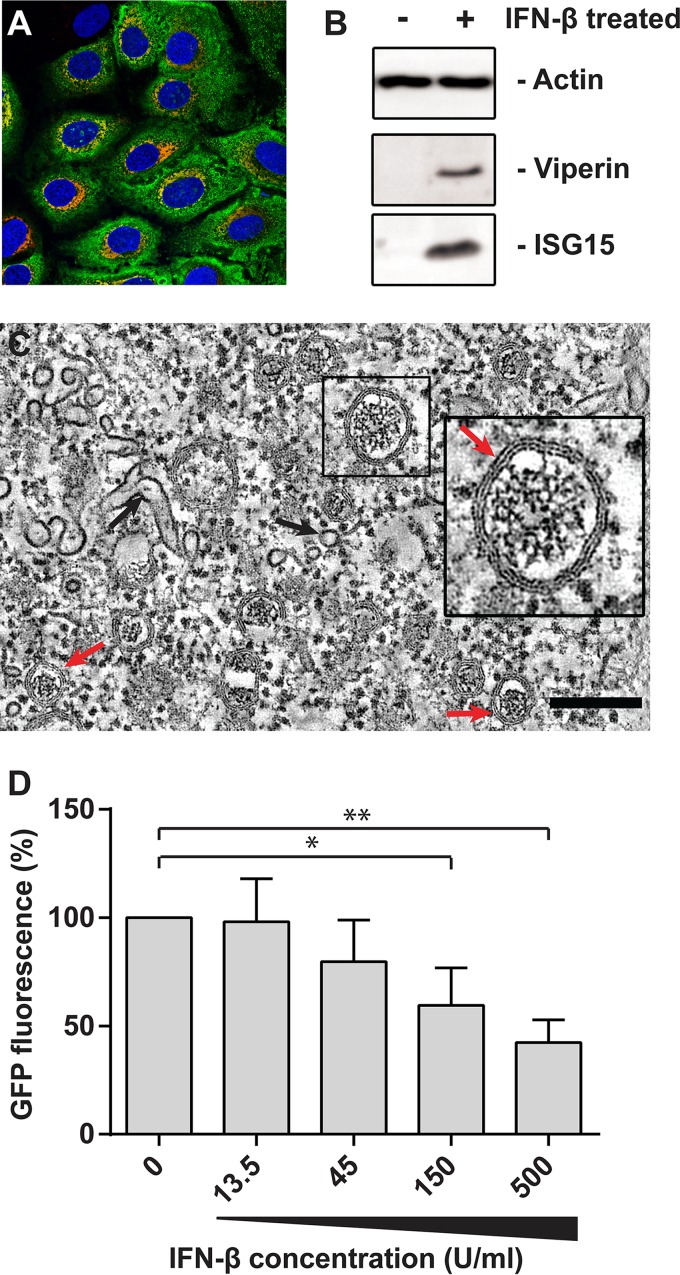
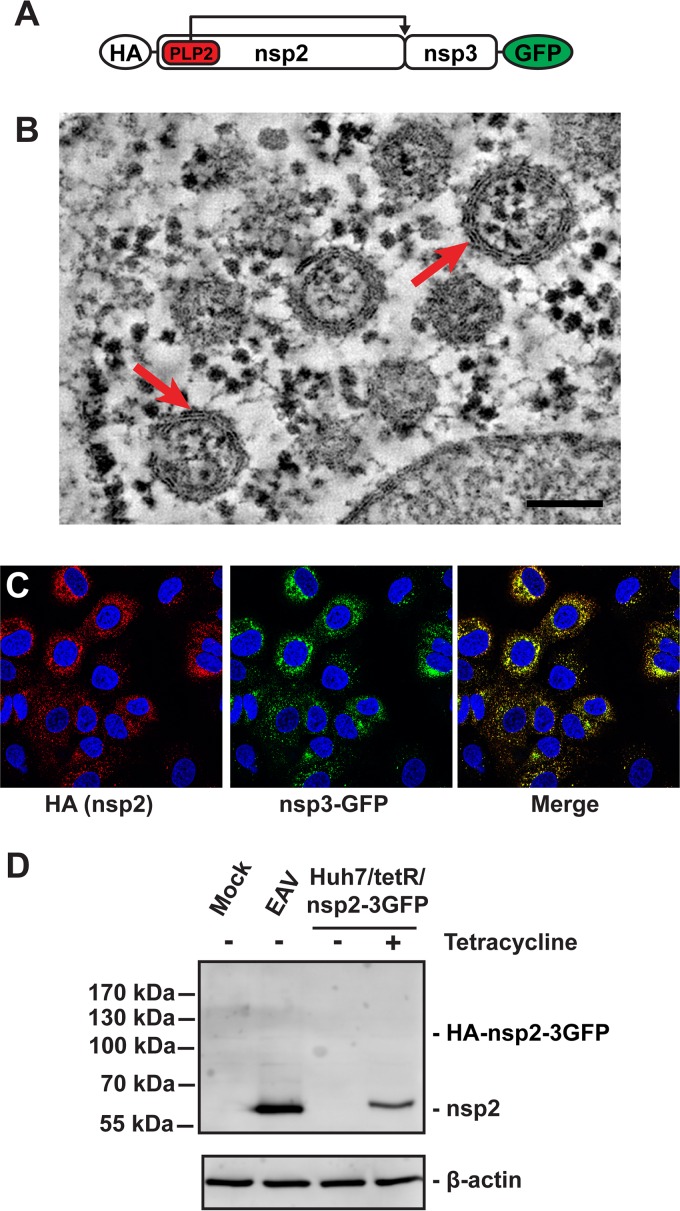
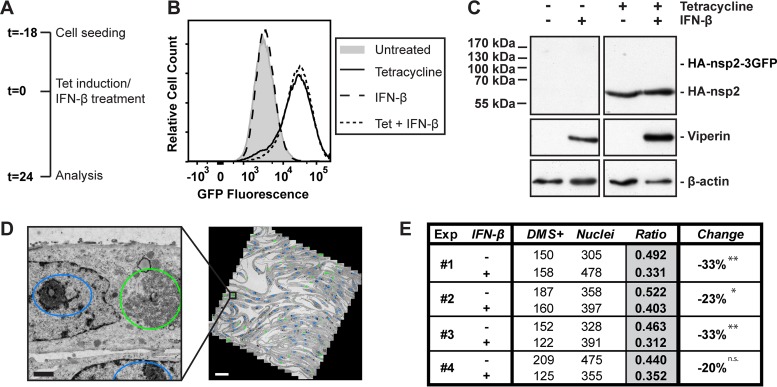
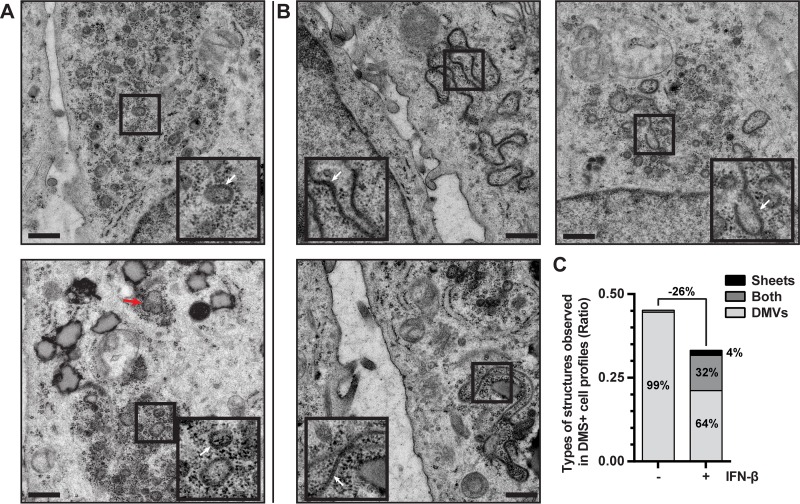
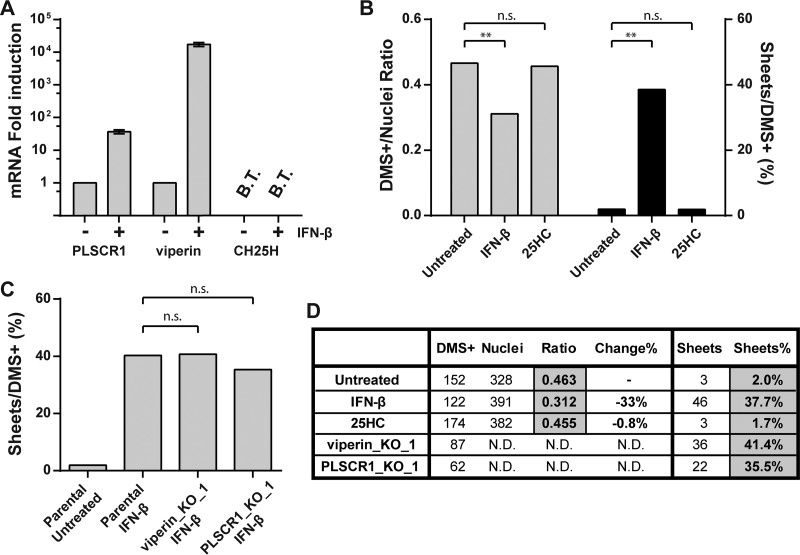
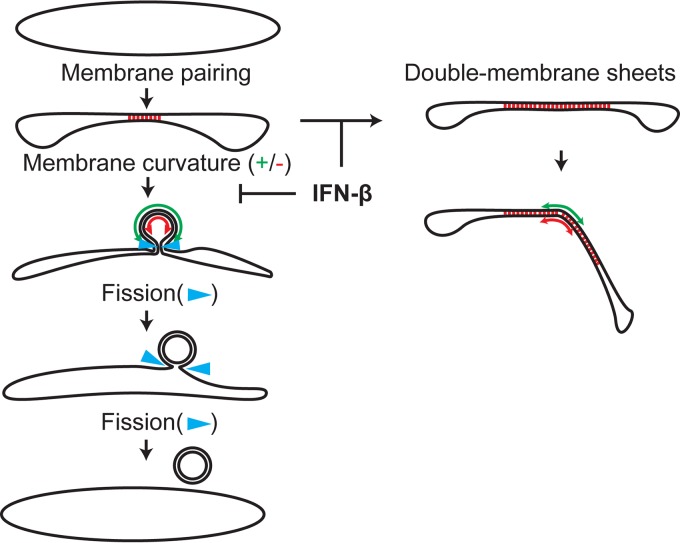
Infection with nidoviruses like corona- and arteriviruses induces a reticulovesicular network of interconnected endoplasmic reticulum (ER)-derived double-membrane vesicles (DMVs) and other membrane structures. This network is thought to accommodate the viral replication machinery and protect it from innate immune detection. We hypothesized that the innate immune response has tools to counteract the formation of these virus-induced replication organelles in order to inhibit virus replication. Here we have investigated the effect of type I interferon (IFN) treatment on the formation of arterivirus-induced membrane structures. Our approach involved ectopic expression of arterivirus nonstructural proteins nsp2 and nsp3, which induce DMV formation in the absence of other viral triggers of the interferon response, such as replicating viral RNA. Thus, this setup can be used to identify immune effectors that specifically target the (formation of) virus-induced membrane structures. Using large-scale electron microscopy mosaic maps, we found that IFN-β treatment significantly reduced the formation of the membrane structures. Strikingly, we also observed abundant stretches of double-membrane sheets (a proposed intermediate of DMV formation) in IFN-β-treated samples, suggesting the disruption of DMV biogenesis. Three interferon-stimulated gene products, two of which have been reported to target the hepatitis C virus replication structures, were tested for their possible involvement, but none of them affected membrane structure formation. Our study reveals the existence of a previously unknown innate immune mechanism that antagonizes the viral hijacking of host membranes. It also provides a solid basis for further research into the poorly understood interactions between the innate immune system and virus-induced replication structures.

Importance: Viruses with a positive-strand RNA genome establish a membrane-associated replication organelle by hijacking and remodeling intracellular host membranes, a process deemed essential for their efficient replication. It is unknown whether the cellular innate immune system can detect and/or inhibit the formation of these membrane structures, which could be an effective mechanism to delay viral RNA replication. In this study, using an expression system that closely mimics the formation of arterivirus replication structures, we show for the first time that IFN-β treatment clearly reduces the amount of induced membrane structures. Moreover, drastic morphological changes were observed among the remaining structures, suggesting that their biogenesis was impaired. Follow-up experiments suggested that host cells contain a hitherto unknown innate antiviral mechanism, which targets this common feature of positive-strand RNA virus replication. Our study provides a strong basis for further research into the interaction of the innate immune system with membranous viral replication organelles.


Figures

FIG 1
FIG 1
EAV infection in HuH-7 cells is productive and sensitive to IFN-β treatment. (A) HuH-7 cells infected with EAV were fixed and stained with antibodies specific for nsp2 (red) and nucleocapsid protein (N; green) at 12 hpi. The nuclei were stained with Hoechst 33258 (blue). (B) Protein levels in HuH-7 cells were analyzed by SDS-PAGE followed by Western blotting after 12 h of stimulation with 500 U/ml IFN-β or were analyzed in untreated control cells. (C) EAV-infected HuH-7 cells were high-pressure frozen at 12 hpi. Samples were freeze substituted and analyzed by electron tomography as previously described (23). A virtual slice (2 nm thick) of a reconstructed tomogram is shown. The red arrows point at some of the multiple DMVs present in the field of view. The boxed DMV is enlarged in the inset to make the two tightly apposed DMV membranes more apparent. Black arrows indicate some of the N-containing tubules. The scale bar represents 200 nm. (D) HuH-7 cells were infected with EAV-GFP in 96-well black plates for 1 h, and after removal of the inoculum, they were treated with the indicated dose of IFN-β. Cells were fixed at 16 hpi, and GFP fluorescence was measured and normalized to a control infection. Error bars represent the standard deviation from 3 independent experiments, and statistical analysis was done with an unpaired Student’s t test. *, P < 0.05; **, P < 0.01.
FIG 2
FIG 2
Validation of the HuH-7/tetR/HA-nsp2-3GFP cell line. (A) Schematic overview of the HA-nsp2-3GFP protein. (B) HuH-7/tetR/HA-nsp2-3GFP cells were high-pressure frozen, followed by freeze substitution and subsequently analyzed by electron tomography as described before (23). A 2-nm-thick virtual slice of a reconstructed tomogram is shown. The red arrows indicate some of the DMVs that can be clearly observed. The scale bar represents 100 nm. (C) Immunofluorescence microscopy of HuH-7/tetR/HA-nsp2-3GFP cells treated with tetracycline for 24 h to induce expression. Cells were stained with mouse anti-HA and the HA-nsp2 signal was detected using a Cy3-conjugated antibody, whereas as nsp3GFP could be visualized by virtue of its fluorescent tag. (D) EAV nsp2 expression was analyzed by Western blotting during infection (12 hpi) and in induced HuH-7/tetR/HA-nsp2-3GFP cells (24 h after induction).
FIG 3
FIG 3
IFN-β treatment reduces the number of double-membrane structures formed by EAV nsp2-3, while protein levels and nsp2-3 cleavage efficiency are not affected. (A) Schematic overview of the experimental setup. (B) HuH-7/tetR/HA-nsp2-3GFP cells were analyzed by flow cytometry for GFP fluorescence after 24 h of the indicated treatments. (C) Levels of the indicated proteins in HuH-7/tetR/HA-nsp2-3GFP cells were analyzed 24 h after the indicated treatments, using Western blotting. The expected position of the HA-nsp2-3GFP precursor is indicated. (D) Example of a mosaic map (right) of a single mesh of an EM grid (tetracycline-treated HuH-7/tetR/HA-nsp2-3GFP cells) composed of 1,164 images (2,048 by 2,048 pixels each) acquired at 6,800× magnification and binning 2, which corresponded to a pixel size of 3.2 nm. The closeup (left) was extracted from the mosaic map as indicated. Coloring represents annotations of nuclei (blue ovals) and EAV nsp2-3-induced DMS (green ovals) in this mesh. Scale bars represent 500 nm (left) and 20 µm (right), respectively. (E) In four independent experiments, the number of cell profiles positive for DMS (DMS+) was quantified as well as the number of cell profiles containing a nucleus (Nuclei). Multiple mosaic maps were analyzed for each sample. Ratios are calculated as the number of DMS+ cell profiles divided by the number of cell profiles containing a nucleus, and P values were calculated using chi-square tests for each experiment. *, P < 0.05; **, P < 0.01. n.s., not significant. The average reduction over 4 experiments was 27% ± 7% (P = 0.001).
FIG 4
FIG 4
IFN-β treatment blocks DMV formation and leads to the accumulation of double-membrane sheets. (A and B) EM images of HuH-7/tetR/HA-nsp2-3GFP cells in which expression is induced with tetracycline for 24 h. Cells represented in images of panel B were simultaneously treated with 500 U/ml IFN-β for 24 h. Images were extracted from mosaic maps used for quantifications, and scale bars represent 500 nm. Insets are 2× magnifications of areas where DMVs (A) or double-membrane sheets (B) are visible (indicated with white arrows). The different appearance of these samples relative to the data shown in Fig. 2 is the result of the different sample preparation approaches (chemical fixation versus HPF-FS, respectively). (C) The occurrence of the different types of DMS (DMVs, double-membrane sheets, or both) in the cell profiles is shown in control or IFN-β-treated HuH-7/tetR/HA-nsp2-3GFP cells that were tetracycline induced.
FIG 5
FIG 5
CH25H, PLSCR1, and viperin are not involved in the inhibition of EAV nsp2-3 DMV formation by IFN-β. (A) Relative induction of indicated ISG mRNAs in HuH-7 cells treated with IFN-β for 16 h compared to untreated control cells, using reverse transcriptase quantitative PCR (RT-qPCR) analysis. Indicated genes were amplified with gene-specific primers, error bars were based on three independent experiments. CH25H mRNA was below the threshold of detection (B.T.) in HuH-7 cells. The CH25H RT-qPCR was validated using cDNA of lipopolysaccharide-treated human dendritic cells. (B) Tetracycline-induced HuH-7/tetR/HA-nsp2-3GFP cells were treated with 500 U/ml IFN-β or 10 µM 25HC or untreated and analyzed by EM for the total number of cells positive for DMS (DMS+) as well as cell profiles positive for a nucleus (Nuclei). A section covering 300 to 500 cell profiles with a nucleus was analyzed for each sample. Ratios are calculated as the number of DMS+ cell profiles divided by the number of nucleus-positive cell profiles as well as the percentage of difference from the untreated control. The number of cell profiles positive for double-membrane sheets was also quantified, and the ratio of sheet-positive cell profiles compared to the total number DMS+ cell profiles was determined. (C) Tetracycline-induced CRISPR/Cas9 knockout cell lines of indicated genes were treated with 500 U/ml IFN-β and compared to the parental control cells. The analysis was similar to that for panel B, except that the DMS+/nucleus ratio was not determined. (D) A table of the quantifications shown in panels B and C. Statistical analyses were done using chi-square tests. **, P < 0.01. n.s., not significant; ND, not determined.
FIG 6
FIG 6
Model for the inhibition of DMV formation by IFN-β treatment. The enwrapping model for DMV formation is shown. Membrane pairing is indicated with red dashes between the membranes. Positive and negative membrane curvatures (green and red, respectively) are indicated with double arrows. The step proposed to be inhibited by IFN-β treatment and resulting in the formation of double-membrane sheets is indicated. Adapted from van der Hoeven et al. (23).

Similar articles

Cited by

References

    1. Miller S, Krijnse-Locker J. 2008. Modification of intracellular membrane structures for virus replication. Nat Rev Microbiol 6:363–374. doi:10.1038/nrmicro1890. - DOI - PMC - PubMed
    1. den Boon JA, Diaz A, Ahlquist P. 2010. Cytoplasmic viral replication complexes. Cell Host Microbe 8:77–85. doi:10.1016/j.chom.2010.06.010. - DOI - PMC - PubMed
    1. Neuman BW, Angelini MM, Buchmeier MJ. 2014. Does form meet function in the coronavirus replicative organelle? Trends Microbiol 22:642–647. doi:10.1016/j.tim.2014.06.003. - DOI - PMC - PubMed
    1. Romero-Brey I, Bartenschlager R. 2016. Endoplasmic reticulum: the favorite intracellular niche for viral replication and assembly. Viruses 8:E160. doi:10.3390/v8060160. - DOI - PMC - PubMed
    1. Diaz A, Ahlquist P. 2012. Role of host reticulon proteins in rearranging membranes for positive-strand RNA virus replication. Curr Opin Microbiol 15:519–524. doi:10.1016/j.mib.2012.04.007. - DOI - PMC - PubMed

Publication types

MeSH terms

Substances

LinkOut - more resources