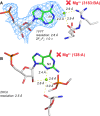
Mg2+ ions: do they bind to nucleobase nitrogens?
- PMID: 27923930
- PMCID: PMC5314772
- DOI: 10.1093/nar/gkw1175
Mg2+ ions: do they bind to nucleobase nitrogens?
Abstract
Given the many roles proposed for Mg2+ in nucleic acids, it is essential to accurately determine their binding modes. Here, we surveyed the PDB to classify Mg2+ inner-sphere binding patterns to nucleobase imine N1/N3/N7 atoms. Among those, purine N7 atoms are considered to be the best nucleobase binding sites for divalent metals. Further, Mg2+ coordination to N7 has been implied in several ribozyme catalytic mechanisms. We report that Mg2+ assigned near imine nitrogens derive mostly from poor interpretations of electron density patterns and are most often misidentified Na+, K+, NH4+ ions, water molecules or spurious density peaks. Consequently, apart from few documented exceptions, Mg2+ ions do not bind to N7 atoms. Without much of a surprise, Mn2+, Zn2+ and Cd2+, which have a higher affinity for nitrogens, may contact N7 atoms when present in crystallization buffers. In this respect, we describe for the first time a potential Zn2+ ribosomal binding site involving two purine N7 atoms. Further, we provide a set of guidelines to help in the assignment of Mg2+ in crystallographic, cryo-EM, NMR and model building practices and discuss implications of our findings related to ion substitution experiments.
© The Author(s) 2016. Published by Oxford University Press on behalf of Nucleic Acids Research.
Figures


Similar articles
-
Nucleobase carbonyl groups are poor Mg2+ inner-sphere binders but excellent monovalent ion binders-a critical PDB survey.RNA. 2019 Feb;25(2):173-192. doi: 10.1261/rna.068437.118. Epub 2018 Nov 8. RNA. 2019. PMID: 30409785 Free PMC article.
-
Mechanistic characterization of the HDV genomic ribozyme: classifying the catalytic and structural metal ion sites within a multichannel reaction mechanism.Biochemistry. 2003 Mar 18;42(10):2982-94. doi: 10.1021/bi026815x. Biochemistry. 2003. PMID: 12627964
-
Theoretical calculation of the NMR spin-spin coupling constants and the NMR shifts allow distinguishability between the specific direct and the water-mediated binding of a divalent metal cation to guanine.J Am Chem Soc. 2004 Jan 21;126(2):663-72. doi: 10.1021/ja036942w. J Am Chem Soc. 2004. PMID: 14719966
-
Complex formation of cadmium with sugar residues, nucleobases, phosphates, nucleotides, and nucleic acids.Met Ions Life Sci. 2013;11:191-274. doi: 10.1007/978-94-007-5179-8_8. Met Ions Life Sci. 2013. PMID: 23430775 Review.
-
Structural and catalytic roles for divalent magnesium in nucleic acid biochemistry.Biometals. 2002 Sep;15(3):211-23. doi: 10.1023/a:1016070614042. Biometals. 2002. PMID: 12206388 Review. No abstract available.
Cited by
-
Structure and thermodynamics of a UGG motif interacting with Ba2+ and other metal ions: accommodating changes in the RNA structure and the presence of a G(syn)-G(syn) pair.RNA. 2022 Nov 1;29(1):44-54. doi: 10.1261/rna.079414.122. Online ahead of print. RNA. 2022. PMID: 36319090 Free PMC article.
-
Deducing putative ancestral forms of GNRA/receptor interactions from the ribosome.Nucleic Acids Res. 2019 Jan 10;47(1):480-494. doi: 10.1093/nar/gky1111. Nucleic Acids Res. 2019. PMID: 30418638 Free PMC article.
-
Reanalysis of a μ opioid receptor crystal structure reveals a covalent adduct with BU72.BMC Biol. 2023 Oct 10;21(1):213. doi: 10.1186/s12915-023-01689-w. BMC Biol. 2023. PMID: 37817141 Free PMC article.
-
Importance of potassium ions for ribosome structure and function revealed by long-wavelength X-ray diffraction.Nat Commun. 2019 Jun 7;10(1):2519. doi: 10.1038/s41467-019-10409-4. Nat Commun. 2019. PMID: 31175275 Free PMC article.
-
Unique anticodon loop conformation with the flipped-out wobble nucleotide in the crystal structure of unbound tRNAVal.RNA. 2021 Nov;27(11):1330-1338. doi: 10.1261/rna.078863.121. Epub 2021 Jul 27. RNA. 2021. PMID: 34315814 Free PMC article.
References
-
- Erat M.C., Sigel R.K. Methods to detect and characterize metal ion binding sites in RNA. Met. Ions Life Sci. 2011;9:37–100. - PubMed
-
- Pechlaner M., Sigel R.K. Characterization of metal ion-nucleic acid interactions in solution. Met. Ions Life Sci. 2012;10:1–42. - PubMed
-
- Pyle A.M. Metal ions in the structure and function of RNA. J. Biol. Inorg. Chem. 2002;7:679–690. - PubMed
-
- Woodson S.A. Metal ions and RNA folding: a highly charged topic with a dynamic future. Curr. Opin. Chem. Biol. 2005;9:104–109. - PubMed
Publication types
MeSH terms
Substances
LinkOut - more resources
Full Text Sources
Other Literature Sources

