

Next-generation systematics: An innovative approach to resolve the structure of complex prokaryotic taxa
- PMID: 27924912
- PMCID: PMC5141411
- DOI: 10.1038/srep38392
Next-generation systematics: An innovative approach to resolve the structure of complex prokaryotic taxa
Abstract
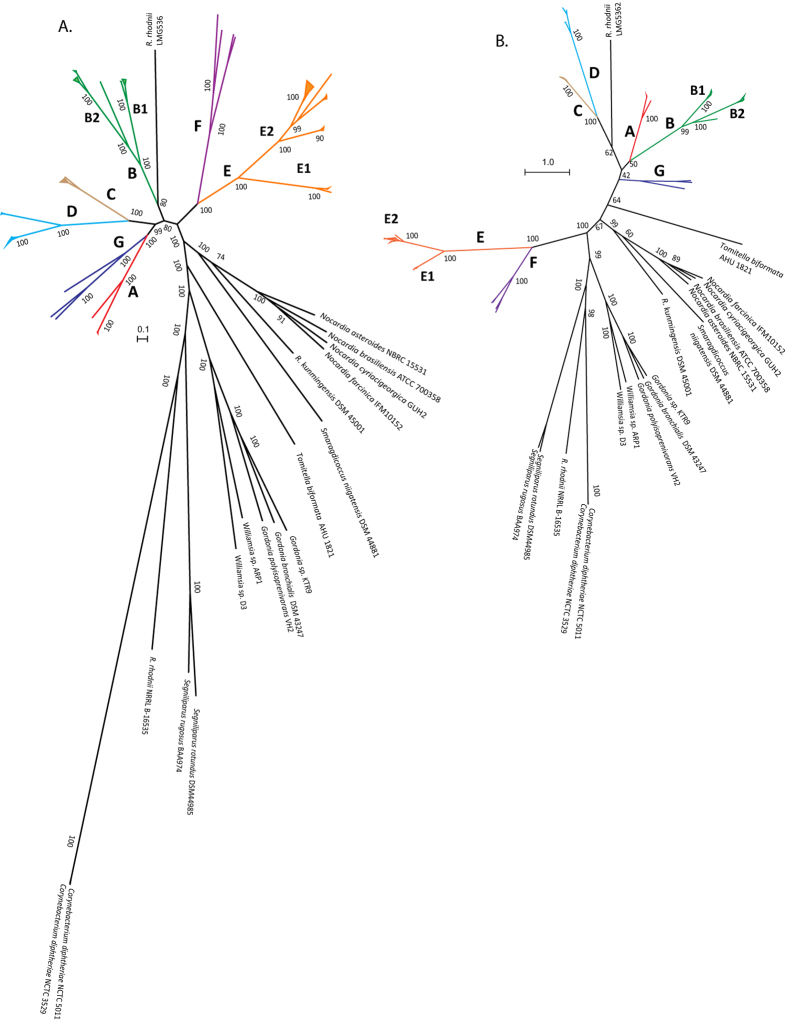
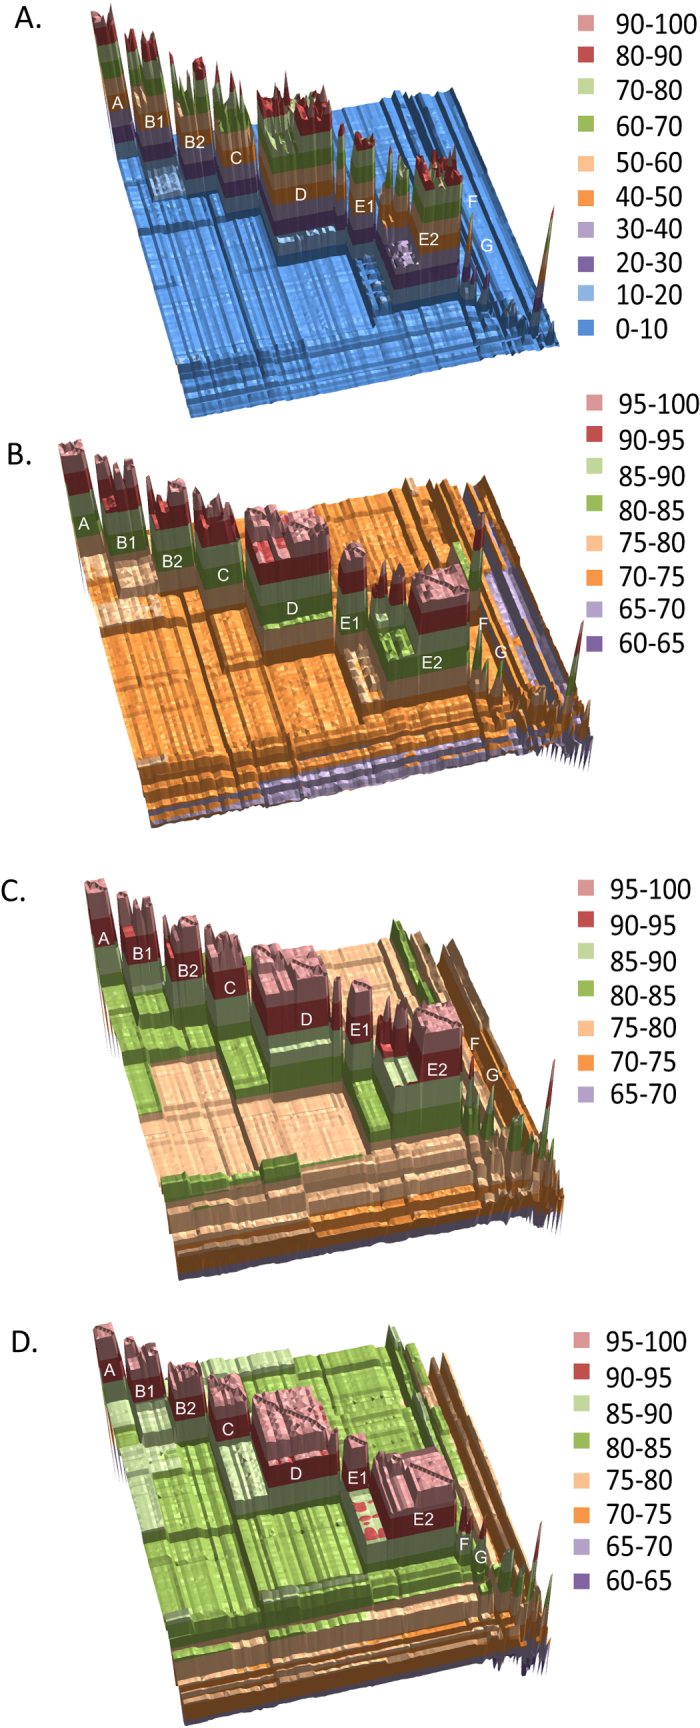
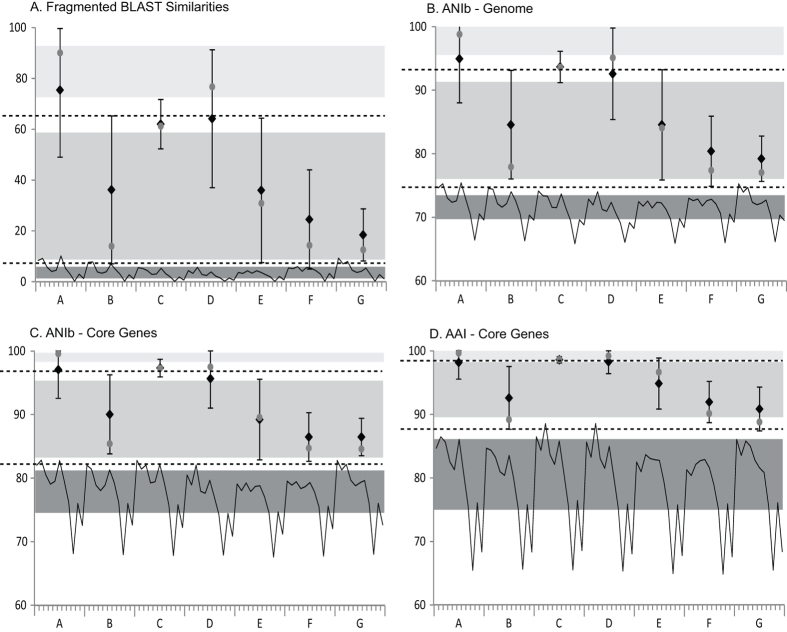
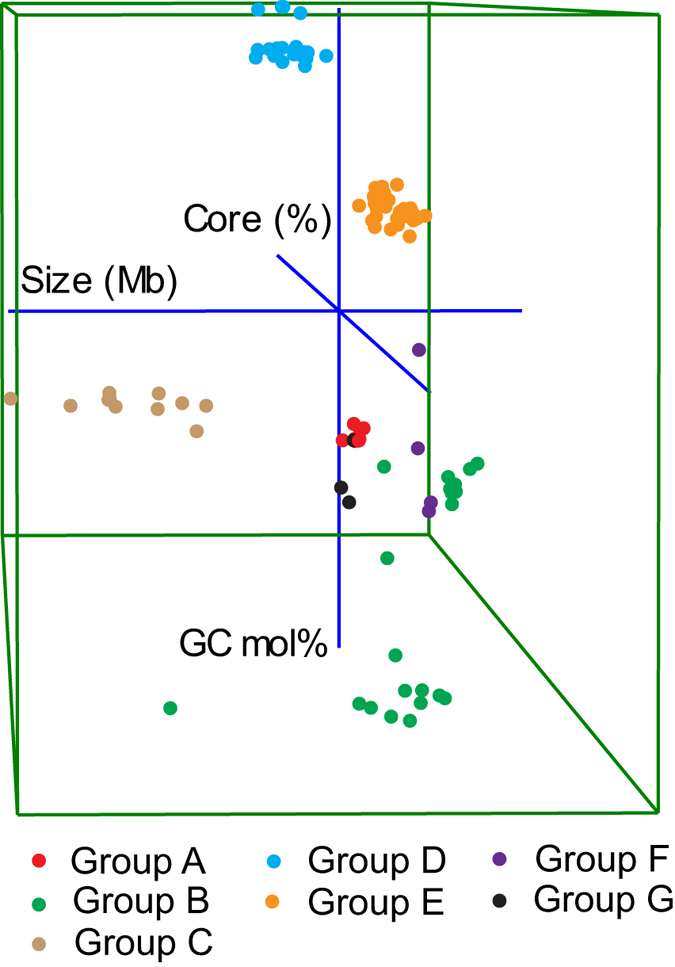
Prokaryotic systematics provides the fundamental framework for microbiological research but remains a discipline that relies on a labour- and time-intensive polyphasic taxonomic approach, including DNA-DNA hybridization, variation in 16S rRNA gene sequence and phenotypic characteristics. These techniques suffer from poor resolution in distinguishing between closely related species and often result in misclassification and misidentification of strains. Moreover, guidelines are unclear for the delineation of bacterial genera. Here, we have applied an innovative phylogenetic and taxogenomic approach to a heterogeneous actinobacterial taxon, Rhodococcus, to identify boundaries for intrageneric and supraspecific classification. Seven species-groups were identified within the genus Rhodococcus that are as distantly related to one another as they are to representatives of other mycolic acid containing actinobacteria and can thus be equated with the rank of genus. It was also evident that strains assigned to rhodococcal species-groups are underspeciated with many misclassified using conventional taxonomic criteria. The phylogenetic and taxogenomic methods used in this study provide data of theoretical value for the circumscription of generic and species boundaries and are also of practical significance as they provide a robust basis for the classification and identification of rhodococci of agricultural, industrial and medical/veterinary significance.
Figures
Similar articles
-
Rhodococcus jostii: a home for Rhodococcus strain RHA1.Antonie Van Leeuwenhoek. 2013 Sep;104(3):435-40. doi: 10.1007/s10482-013-9958-5. Epub 2013 Jul 13. Antonie Van Leeuwenhoek. 2013. PMID: 23851715
-
Rhodococcal systematics: problems and developments.Antonie Van Leeuwenhoek. 1998 Jul-Oct;74(1-3):3-20. doi: 10.1023/a:1001730725003. Antonie Van Leeuwenhoek. 1998. PMID: 10068784 Review.
-
Can whole genome analysis refine the taxonomy of the genus Rhodococcus?FEMS Microbiol Rev. 2004 Jun;28(3):377-403. doi: 10.1016/j.femsre.2004.01.001. FEMS Microbiol Rev. 2004. PMID: 15449609 Review.
-
Rhodococcus biphenylivorans sp. nov., a polychlorinated biphenyl-degrading bacterium.Antonie Van Leeuwenhoek. 2015 Jan;107(1):55-63. doi: 10.1007/s10482-014-0303-4. Epub 2014 Oct 15. Antonie Van Leeuwenhoek. 2015. PMID: 25315102
-
Sequence analysis of 16S rRNA, gyrB and catA genes and DNA-DNA hybridization reveal that Rhodococcus jialingiae is a later synonym of Rhodococcus qingshengii.Int J Syst Evol Microbiol. 2014 Jan;64(Pt 1):298-301. doi: 10.1099/ijs.0.059097-0. Int J Syst Evol Microbiol. 2014. PMID: 24408950
Cited by
-
Development of the SeqCode: A proposed nomenclatural code for uncultivated prokaryotes with DNA sequences as type.Syst Appl Microbiol. 2022 Sep;45(5):126305. doi: 10.1016/j.syapm.2022.126305. Epub 2022 Jul 20. Syst Appl Microbiol. 2022. PMID: 36049255 Free PMC article. Review.
-
Genome-Based Taxonomic Classification of the Phylum Actinobacteria.Front Microbiol. 2018 Aug 22;9:2007. doi: 10.3389/fmicb.2018.02007. eCollection 2018. Front Microbiol. 2018. PMID: 30186281 Free PMC article.
-
Revisiting the Taxonomic Status of the Biomedically and Industrially Important Genus Amycolatopsis, Using a Phylogenomic Approach.Front Microbiol. 2018 Sep 27;9:2281. doi: 10.3389/fmicb.2018.02281. eCollection 2018. Front Microbiol. 2018. PMID: 30319584 Free PMC article.
-
Antibiotic resistance genes in the Actinobacteria phylum.Eur J Clin Microbiol Infect Dis. 2019 Sep;38(9):1599-1624. doi: 10.1007/s10096-019-03580-5. Epub 2019 Jun 27. Eur J Clin Microbiol Infect Dis. 2019. PMID: 31250336 Review.
-
Optimization of Rhodococcus erythropolis JCM3201T Nutrient Media to Improve Biomass, Lipid, and Carotenoid Yield Using Response Surface Methodology.Microorganisms. 2023 Aug 24;11(9):2147. doi: 10.3390/microorganisms11092147. Microorganisms. 2023. PMID: 37763991 Free PMC article.
References
MeSH terms
Substances
LinkOut - more resources
Full Text Sources
Other Literature Sources
Molecular Biology Databases
Research Materials
