

Genome-wide Analysis of Phosphoenolpyruvate Carboxylase Gene Family and Their Response to Abiotic Stresses in Soybean
- PMID: 27924923
- PMCID: PMC5141416
- DOI: 10.1038/srep38448
Genome-wide Analysis of Phosphoenolpyruvate Carboxylase Gene Family and Their Response to Abiotic Stresses in Soybean
Abstract
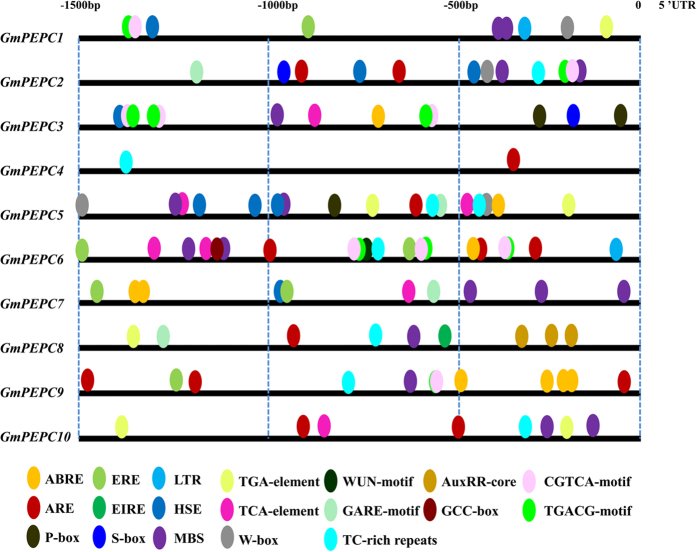
Phosphoenolpyruvate carboxylase (PEPC) plays an important role in assimilating atmospheric CO2 during C4 and crassulacean acid metabolism photosynthesis, and also participates in various non-photosynthetic processes, including fruit ripening, stomatal opening, supporting carbon-nitrogen interactions, seed formation and germination, and regulation of plant tolerance to stresses. However, a comprehensive analysis of PEPC family in Glycine max has not been reported. Here, a total of ten PEPC genes were identified in soybean and denominated as GmPEPC1-GmPEPC10. Based on the phylogenetic analysis of the PEPC proteins from 13 higher plant species including soybean, PEPC family could be classified into two subfamilies, which was further supported by analyses of their conserved motifs and gene structures. Nineteen cis-regulatory elements related to phytohormones, abiotic and biotic stresses were identified in the promoter regions of GmPEPC genes, indicating their roles in soybean development and stress responses. GmPEPC genes were expressed in various soybean tissues and most of them responded to the exogenously applied phytohormones. GmPEPC6, GmPEPC8 and GmPEPC9 were significantly induced by aluminum toxicity, cold, osmotic and salt stresses. In addition, the enzyme activities of soybean PEPCs were also up-regulated by these treatments, suggesting their potential roles in soybean response to abiotic stresses.
Figures


Similar articles
-
Cloning of PEPC-1 from a C4 halophyte Suaeda aralocaspica without Kranz anatomy and its recombinant enzymatic activity in responses to abiotic stresses.Enzyme Microb Technol. 2016 Feb;83:57-67. doi: 10.1016/j.enzmictec.2015.11.006. Epub 2015 Nov 22. Enzyme Microb Technol. 2016. PMID: 26777251
-
Genome-wide analysis of MATE transporters and expression patterns of a subgroup of MATE genes in response to aluminum toxicity in soybean.BMC Genomics. 2016 Mar 11;17:223. doi: 10.1186/s12864-016-2559-8. BMC Genomics. 2016. PMID: 26968518 Free PMC article.
-
Evolution of PEPC gene family in Gossypium reveals functional diversification and GhPEPC genes responding to abiotic stresses.Gene. 2019 May 25;698:61-71. doi: 10.1016/j.gene.2019.02.061. Epub 2019 Feb 28. Gene. 2019. PMID: 30825597
-
The remarkable diversity of plant PEPC (phosphoenolpyruvate carboxylase): recent insights into the physiological functions and post-translational controls of non-photosynthetic PEPCs.Biochem J. 2011 May 15;436(1):15-34. doi: 10.1042/BJ20110078. Biochem J. 2011. PMID: 21524275 Review.
-
Genome-wide identification, evolution, and expression analysis of carbonic anhydrases genes in soybean (Glycine max).Funct Integr Genomics. 2023 Jan 14;23(1):37. doi: 10.1007/s10142-023-00966-9. Funct Integr Genomics. 2023. PMID: 36639600 Review.
Cited by
-
Conservation and Divergence of PEPC Gene Family in Different Ploidy Bamboos.Plants (Basel). 2024 Aug 30;13(17):2426. doi: 10.3390/plants13172426. Plants (Basel). 2024. PMID: 39273910 Free PMC article.
-
Transcriptomic and Metabolomic Analyses Reveal the Key Genes Related to Shade Tolerance in Soybean.Int J Mol Sci. 2023 Sep 18;24(18):14230. doi: 10.3390/ijms241814230. Int J Mol Sci. 2023. PMID: 37762532 Free PMC article.
-
Conservation and Divergence of Phosphoenolpyruvate Carboxylase Gene Family in Cotton.Plants (Basel). 2022 May 31;11(11):1482. doi: 10.3390/plants11111482. Plants (Basel). 2022. PMID: 35684256 Free PMC article.
-
An advanced systems biology framework of feature engineering for cold tolerance genes discovery from integrated omics and non-omics data in soybean.Front Plant Sci. 2022 Sep 30;13:1019709. doi: 10.3389/fpls.2022.1019709. eCollection 2022. Front Plant Sci. 2022. PMID: 36247545 Free PMC article.
-
The Original Form of C4-Photosynthetic Phosphoenolpyruvate Carboxylase Is Retained in Pooids but Lost in Rice.Front Plant Sci. 2022 Jul 25;13:905894. doi: 10.3389/fpls.2022.905894. eCollection 2022. Front Plant Sci. 2022. PMID: 35958195 Free PMC article.
References
-
- Izui K., Matsumura H., Furumoto T. & Kai Y. Phosphoenolpyruvate carboxylase: a new era of structural biology. Annu. Rev. Plant Biol. 55, 69–84 (2004). - PubMed
-
- O’Leary B., Park J. & Plaxton W. C. The remarkable diversity of plant PEPC (phosphoenolpyruvate carboxylase): recent insights into the physiological functions and post-translational controls of non-photosynthetic PEPCs. Biochem. J. 436, 15–34 (2011). - PubMed
-
- Nakagawa T. et al.. Characterization and expression analysis of genes encoding phosphoenolpyruvate carboxylase and phosphoenolpyruvate carboxylase kinase of Lotus japonicas, a model legume. Mol. Plant Microbe Interact. 16, 281–288 (2003). - PubMed
Publication types
MeSH terms
Substances
LinkOut - more resources
Full Text Sources
Other Literature Sources
Miscellaneous
