. 2016 Dec 7:6:38609.
doi: 10.1038/srep38609.

New principle for measuring arterial blood oxygenation, enabling motion-robust remote monitoring

Affiliations

New principle for measuring arterial blood oxygenation, enabling motion-robust remote monitoring

Mark van Gastel et al. Sci Rep. .

Abstract

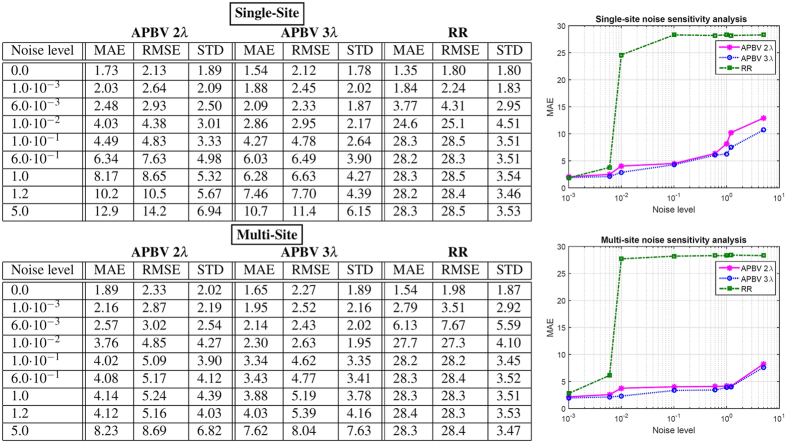
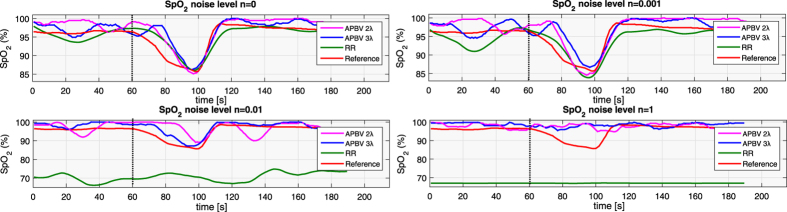
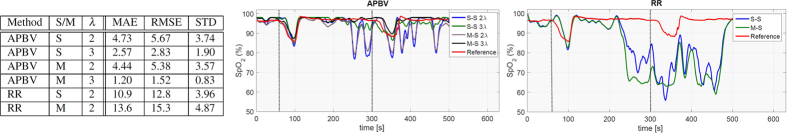
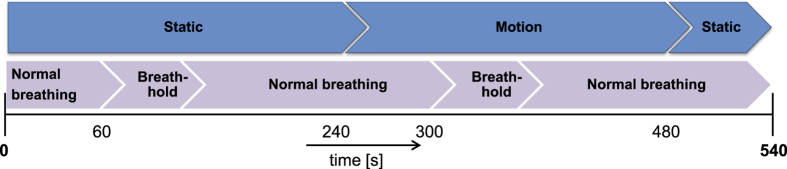
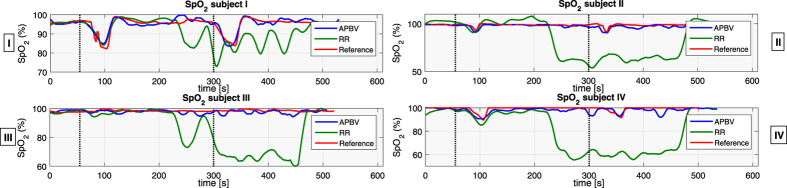
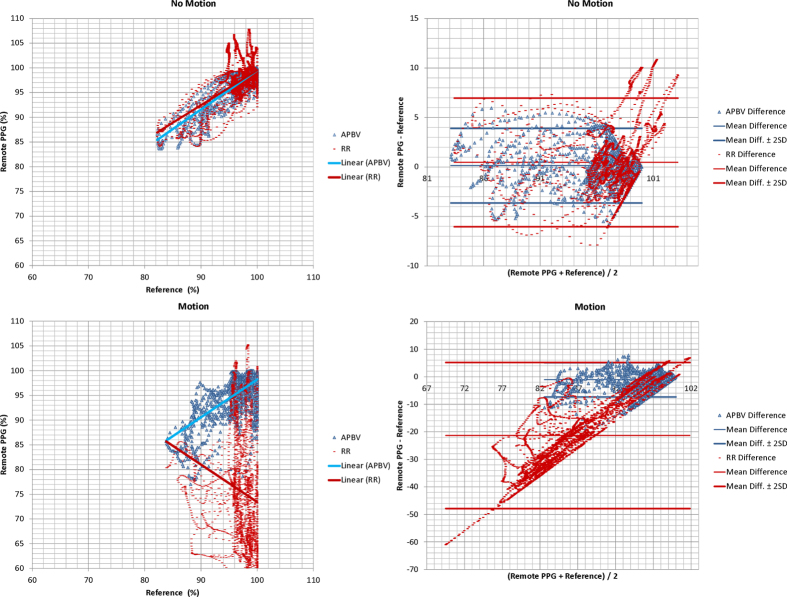
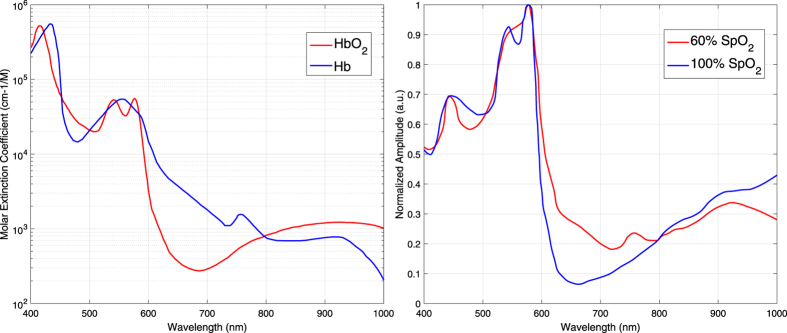
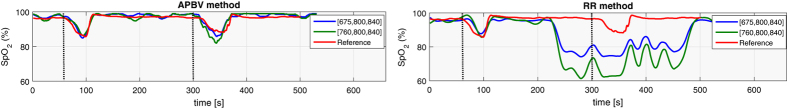
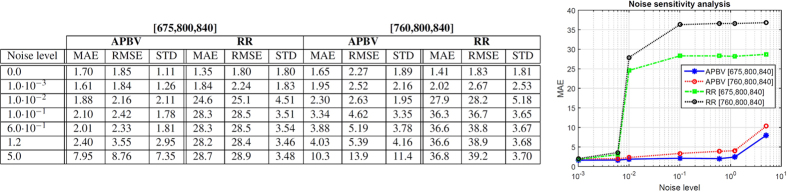
Finger-oximeters are ubiquitously used for patient monitoring in hospitals worldwide. Recently, remote measurement of arterial blood oxygenation (SpO2) with a camera has been demonstrated. Both contact and remote measurements, however, require the subject to remain static for accurate SpO2 values. This is due to the use of the common ratio-of-ratios measurement principle that measures the relative pulsatility at different wavelengths. Since the amplitudes are small, they are easily corrupted by motion-induced variations. We introduce a new principle that allows accurate remote measurements even during significant subject motion. We demonstrate the main advantage of the principle, i.e. that the optimal signature remains the same even when the SNR of the PPG signal drops significantly due to motion or limited measurement area. The evaluation uses recordings with breath-holding events, which induce hypoxemia in healthy moving subjects. The events lead to clinically relevant SpO2 levels in the range 80-100%. The new principle is shown to greatly outperform current remote ratio-of-ratios based methods. The mean-absolute SpO2-error (MAE) is about 2 percentage-points during head movements, where the benchmark method shows a MAE of 24 percentage-points. Consequently, we claim ours to be the first method to reliably measure SpO2 remotely during significant subject motion.


Figures

Figure 1
Figure 1. Results of the noise sensitivity analysis on a recording without motion including a hypoxemic event.
We compare the performance of our method, both with two and three wavelengths, with the benchmark RR method for different noise levels. The top row contains the results using a single-site measurement, the bottom row that of using multi-site measurements.
Figure 2
Figure 2. Noise sensitivity results after adding multiplicative Gaussian distributed random noise to a stationary sequence with a breath-holding event, whose start is indicated with the dotted line.
It can be observed that the proposed method is much less sensitive to noise compared to the standard ratio-of-ratios (RR) method, and three wavelengths yield better robustness compared to two.
Figure 3
Figure 3. Results on a 9 minutes motion sequence including two hypoxemic events (indicated with dotted lines).
We compare the performance of our method, both with two and three wavelengths (λ), with the benchmark RR method. Furthermore, we investigate the gain in performance when using multi-site measurements (M-S) compared to a single-site measurement (S-S).
Figure 4
Figure 4. Overview of the protocol for the dataset of motion robust oxygen saturation measurements.
Figure 5
Figure 5. Performance results of the four (I–IV) subjects present in our dataset, where the dotted lines indicate the beginning of the breath-holding events.
It can be observed that the RR-based method achieves satisfactory results in the first static part of the recordings, but completely fails in the presence of motion artifacts. The proposed APBV method is capable to estimate SpO2 during motion, although a decrease in accuracy can be identified compared to the static part.
Figure 6
Figure 6. Correlation plots (left) and Bland-Altman analysis (right) of our method compared to the benchmark method, which are split in static and motion sequences.
The red and blue lines in the correlation plots indicate the linear fit.
Figure 7
Figure 7. Left: Optical extinction spectra of oxygenated haemoglobin (HbO2) and deoxygenated haemoglobin (Hb).
Right: The relative PPG amplitude spectra for 60% and 100% SpO2.
Figure 8
Figure 8. Visualization of the comparative results for the wavelength combinations [675,800,840] and [760,800,840] nm on a sequence with motion.
The dotted lines indicate the beginning of the breath-holding events.
Figure 9
Figure 9. Comparative results of the noise sensitivity analysis for the wavelength combinations [675,800,840] and [760,800,840] nm.
Figure 10
Figure 10. Illustration of the ability of the PBV method to suppress non-cardiac related distortions present in the PPG signals.
(Left) artifact-polluted PPG signals with corresponding spectra where the distortions are dominant in energy compared to the pulse signal. (Right) the resulting pulse signal and corresponding spectrum after applying PBV. The black dash-dotted lines indicate the pulse rate.
Figure 11
Figure 11. Illustrative example to demonstrate the principle of the adaptive PBV method.
Synthetic data with added noise (Apulse = 2 · 10−3, Anoise = 1 · 10−2) is generated to simulate a slow, linear, desaturation event with oxygenation levels in the range 60-100 percent and a constant pulse rate of 70 BPM. Within this range, nine PBV vectors are uniformly sampled (1 = 100%, 9 = 60%). It can be observed from the spectrograms and the PBV indices (red), that the PBV vector corresponding with the pulse signal with the highest SNR, can be mapped to the correct oxygenation level. The PBV indices (red) indicate the PBV vector with the highest SNR for each time-window of 8 seconds.
Figure 12
Figure 12. The four operations in the proposed framework.
(1) the selected ROI (forehead) is tracked over time and divided into rectangular sub-regions for which the spatial average is calculated (2) the pulse signal is calculated for a collection of PBV vectors each reflecting a oxygen saturation level (3) spatiotemporal features are calculated from the pulse signals to prune distorted regions, and (4) the PBV vector is selected from the pulse signals of the non-pruned regions.
Figure 13
Figure 13. Visualization of the features and quality measure for different scenarios with nine PBV vectors uniformly sampled in the range 60–100 SpO2, where PBV 1 corresponds to 100% and PBV 9 to 60% SpO2.
This quality measure calculated for each sub-region is used to prune sub-regions with low SNR, which could corrupt the SpO2 measurements.

References

    1. Fanaroff A., Fanaroff J. & Klaus M. Klaus and Fanaroff’s Care of the High-Risk Neonate, Expert Consult - Online and Print,6: Klaus and Fanaroff’s Care of the High-Risk Neonate. ClinicalKey 2012 (Elsevier/Saunders, 2012).
    1. Aoyagi T., Kishi M., Yamaguchi K. & Watanabe S. Improvement of the earpiece oximeter. Japanese Society of Medical Electronics and Biological Engineering 974, 90–91 (1974).
    1. Allen J. Photoplethysmography and its application in clinical physiological measurement. Physiological Measurement 28, R1–R39 (2007). - PubMed
    1. Eichenfield L. E. & Hardaway C. A. Neonatal dermatology. Current opinion in pediatrics 11, 471–474 (1999). - PubMed
    1. Wieringa F., Mastik F. & Van der Steen A. Contactless multiple wavelength photoplethysmographic imaging: a first step toward “SpO2 camera” technology. Annals of biomedical engineering 33, 1034–1041 (2005). - PubMed