. 2017 Mar 15;140(6):1293-1305.
doi: 10.1002/ijc.30551.

To expand coverage, or increase frequency: Quantifying the tradeoffs between equity and efficiency facing cervical cancer screening programs in low-resource settings

Affiliations

To expand coverage, or increase frequency: Quantifying the tradeoffs between equity and efficiency facing cervical cancer screening programs in low-resource settings

Nicole G Campos et al. Int J Cancer. .

Abstract

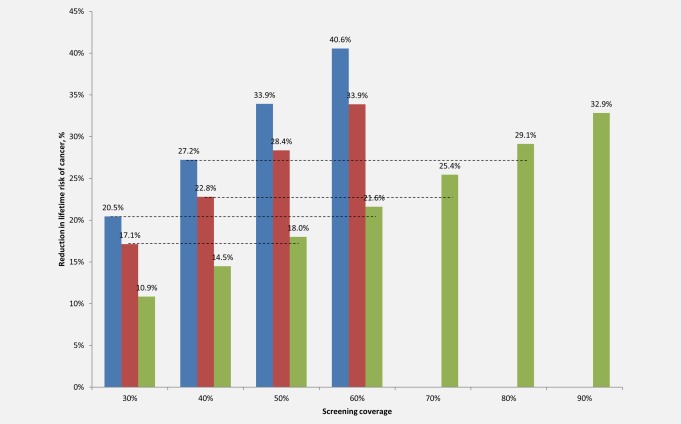
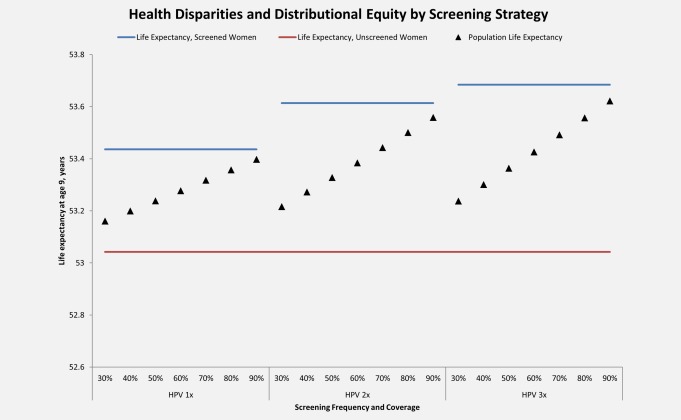
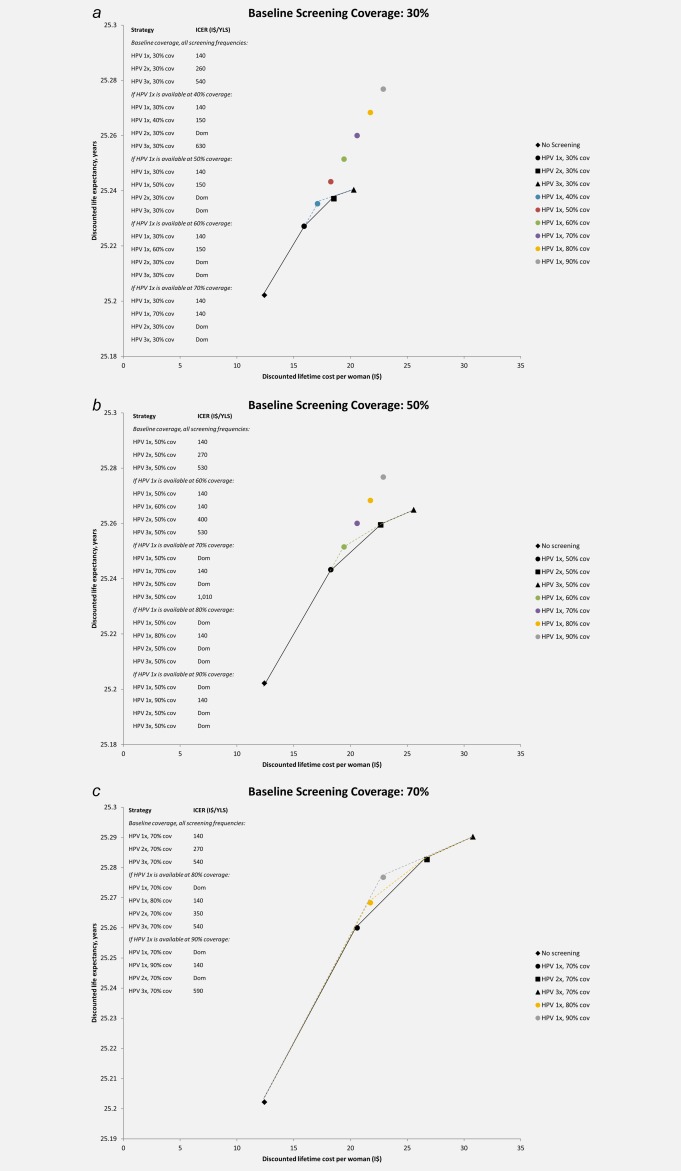
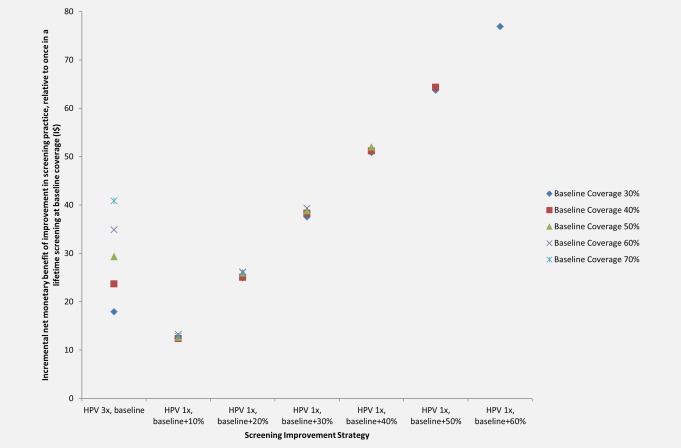
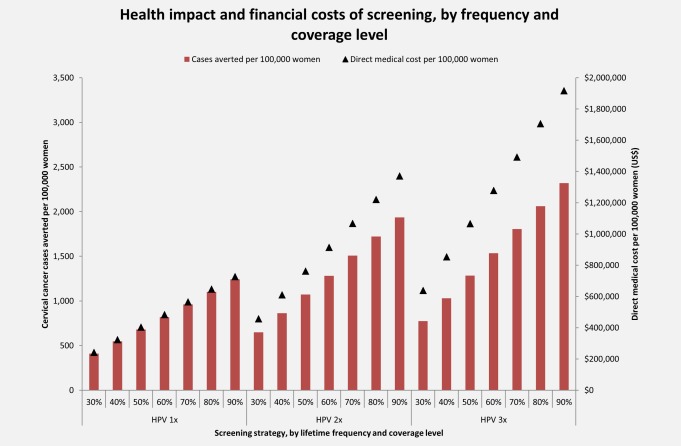
Cervical cancer is a leading cause of cancer death worldwide, with 85% of the disease burden residing in less developed regions. To inform evidence-based decision-making as cervical cancer screening programs are planned, implemented, and scaled in low- and middle-income countries, we used cost and test performance data from the START-UP demonstration project in Uganda and a microsimulation model of HPV infection and cervical carcinogenesis to quantify the health benefits, distributional equity, cost-effectiveness, and financial impact of either (1) improving access to cervical cancer screening or (2) increasing the number of lifetime screening opportunities for women who already have access. We found that when baseline screening coverage was low (i.e., 30%), expanding coverage of screening once in a lifetime to 50% can yield comparable reductions in cancer risk to screening two or three times in a lifetime at 30% coverage, lead to greater reductions in health disparities, and cost 150 international dollars (I$) per year of life saved (YLS). At higher baseline screening coverage levels (i.e., 70%), screening three times in a lifetime yielded greater health benefits than expanding screening once in a lifetime to 90% coverage, and would have a cost-effectiveness ratio (I$590 per YLS) below Uganda's per capita GDP. Given very low baseline coverage at present, we conclude that a policy focus on increasing access for previously unscreened women appears to be more compatible with improving both equity and efficiency than a focus on increasing frequency for a small subset of women.

Keywords: HPV DNA test; Uganda; cancer screening; cervical cancer; economic evaluation; health disparities; human papillomavirus.


Figures

Figure 1
Figure 1
Reduction in the lifetime risk of cervical cancer, by screening coverage level and frequency. Reduction in lifetime risk of cervical cancer (y‐axis) is displayed by screening coverage level (x‐axis) for screening once, twice or three times in a lifetime with careHPV testing. Screening three times in a lifetime at ages 30, 40 and 50 years is displayed by the blue bars; screening twice in a lifetime at ages 30 and 40 years by the red bars; and screening once in a lifetime at age 30 years by the green bars. Dashed lines indicate the higher coverage level at which screening once in a lifetime (green bars) yields equal or greater reductions in cancer risk relative to baseline coverage levels of screening two (red bars) or three (blue bars) times in a lifetime. [Color figure can be viewed at wileyonlinelibrary.com]
Figure 2
Figure 2
Health disparities and distributional equity, by screening coverage level and frequency. Life expectancy at age 9 (y‐axis) is displayed for each screening coverage and frequency considered. Life expectancy for unscreened women is represented by the red lines, life expectancy for screened women (100% coverage) is represented by the blue lines, and average female life expectancy for the general population with a specified screening coverage level and frequency is represented by the black triangles. 1x: screening once in a lifetime at age 30 years; 2x: screening twice in a lifetime at ages 30 and 40 years; 3x: screening three times in a lifetime at ages 30, 40, and 50 years. [Color figure can be viewed at wileyonlinelibrary.com]
Figure 3
Figure 3
Cost‐effectiveness of screening for cervical cancer. The discounted lifetime costs (in 2011 international dollars) and life expectancy associated with selected screening coverage levels and frequency are shown for baseline coverage levels of (a) 30%; (b) 50%; and (c) 70%. Black markers represent the discounted costs and life expectancy for no screening (diamond), screening once in a lifetime (circle), twice in a lifetime (square), or three times in a lifetime (triangle) at the specified baseline coverage level. The cost‐effectiveness associated with a change from one strategy to a more costly alternative is represented by the difference in cost divided by the difference in life expectancy associated with the two strategies. Strategies that lie on the efficiency curve dominate those to the right of the curve because they are more effective and either cost less or have a more attractive cost‐effectiveness ratio than less effective options. An incremental cost‐effectiveness ratio is shown for each non‐dominated strategy and is the reciprocal of the slope of the line connecting the two screening strategies under comparison. This slope is steeper when the incremental gain in life expectancy per international dollar is greater. The black line represents the efficiency frontier when screening once, twice, or three times in a lifetime is available at baseline coverage levels only. In panel (a), the blue dashed line represents the efficiency frontier when once in a lifetime screening is also available at 40% coverage; when once in a lifetime screening is also available at coverage levels of 50% or higher, screening once in a lifetime is more effective and less costly than screening two or three times in a lifetime at baseline coverage (efficiency frontiers not shown). In panel (b), the green dashed line indicates the efficiency frontier when once in a lifetime screening is also available at 60% coverage; when once in a lifetime screening is also available at coverage levels of 70% or higher, screening once in a lifetime is more effective and less costly than screening twice in a lifetime (efficiency frontiers not shown). In panel (c), the yellow and gray dashed lines indicate the efficiency frontiers when once in a lifetime screening coverage is also available at 80% or 90% coverage, respectively. 1x: once in a lifetime screening at age 30 years; 2x: twice in a lifetime screening at ages 30 and 40 years; 3x: three times in a lifetime screening at ages 30, 40, and 50 years; cov: screening coverage level; dom: dominated strategy, defined as either more costly and less effective or having a higher incremental cost‐effectiveness ratio than a more effective strategy; I$: 2011 international dollars; ICER: incremental cost‐effectiveness ratio; YLS: year of life saved. Uganda GDP per capita: I$1,690. [Color figure can be viewed at wileyonlinelibrary.com]
Figure 4
Figure 4
Incremental net monetary benefit of increasing screening coverage versus increasing screening frequency. The incremental net monetary benefit (INMB) of an improvement in screening practice relative to once in a lifetime screening at baseline coverage (y‐axis) is shown for each improvement (x‐axis), including increasing screening frequency to three times in a lifetime at baseline coverage or increasing screening coverage of once in a lifetime screening. INMB values are shown for baseline coverage levels of 30% (dark blue markers), 40% (red markers), 50% (green markers), 60% (purple markers), and 70% (turquoise markers). Uganda GDP per capita: I$1,690. 1x: once in a lifetime screening at age 30 years; 2x: twice in a lifetime screening at ages 30 and 40 years; 3x: three times in a lifetime screening at ages 30, 40, and 50 years; I$: 2011 international dollars. [Color figure can be viewed at wileyonlinelibrary.com]
Figure 5
Figure 5
Health impact and financial costs of screening, by screening coverage level and frequency. The number of cervical cancer cases (red bars) averted per 100,000 women are shown on the primary y‐axis for each screening coverage level and frequency (x‐axis). The undiscounted direct medical costs (US$) (black triangles) per 100,000 women are displayed on the secondary y‐axis. 1x: once in a lifetime screening at age 30 years; 2x: twice in a lifetime screening at ages 30 and 40 years; 3x: three times in a lifetime screening at ages 30, 40, and 50 years; US$: 2013 US dollars. [Color figure can be viewed at wileyonlinelibrary.com]

References

    1. Ferlay J, Soerjomataram I, Ervik M, et al. GLOBOCAN 2012 v1.0, Cancer Incidence and Mortality Worldwide: IARC CancerBase No. 11 [Internet], 2013, International Agency for Research on Cancer: Lyon, France.
    1. “FDA approves Gardasil 9 for prevention of certain cancers caused by five additional types of HPV.” FDA News Release December 11, 2014; Available from: http://www.fda.gov/NewsEvents/Newsroom/PressAnnouncements/ucm426485.htm.
    1. De Carvalho N, Teixeira J, Roteli‐Martins CM, et al. Sustained efficacy and immunogenicity of the HPV‐16/18 AS04‐adjuvanted vaccine up to 7.3 years in young adult women. Vaccine 2010;28:6247–55. - PubMed
    1. Herrero R, Wacholder S, Rodriguez AC, et al. Prevention of persistent human papillomavirus infection by an HPV16/18 vaccine: a community‐based randomized clinical trial in Guanacaste, Costa Rica. Cancer Discov 2011;1:408–19. - PMC - PubMed
    1. Villa LL, Costa RL, Petta CA, et al. High sustained efficacy of a prophylactic quadrivalent human papillomavirus types 6/11/16/18 L1 virus‐like particle vaccine through 5 years of follow‐up. Br J Cancer 2006;95:1459–66. - PMC - PubMed

MeSH terms