. 2017 Jan:22:850-862.
doi: 10.2119/molmed.2016.00108. Epub 2016 Dec 6.

Shock Wave Enhances Angiogenesis through VEGFR2 Activation and Recycling

Affiliations

Shock Wave Enhances Angiogenesis through VEGFR2 Activation and Recycling

Tien-Hung Huang et al. Mol Med. 2017 Jan.

Abstract

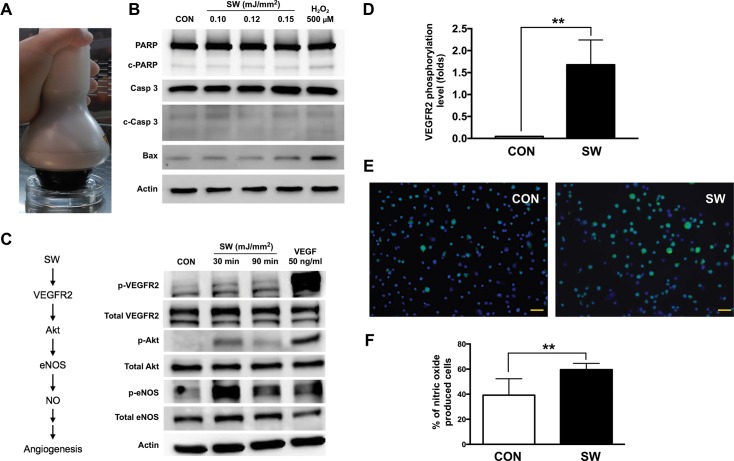
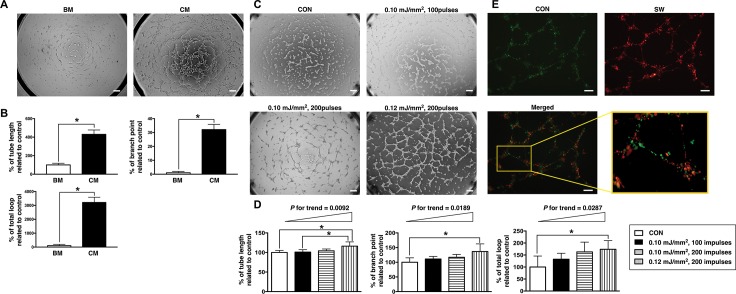
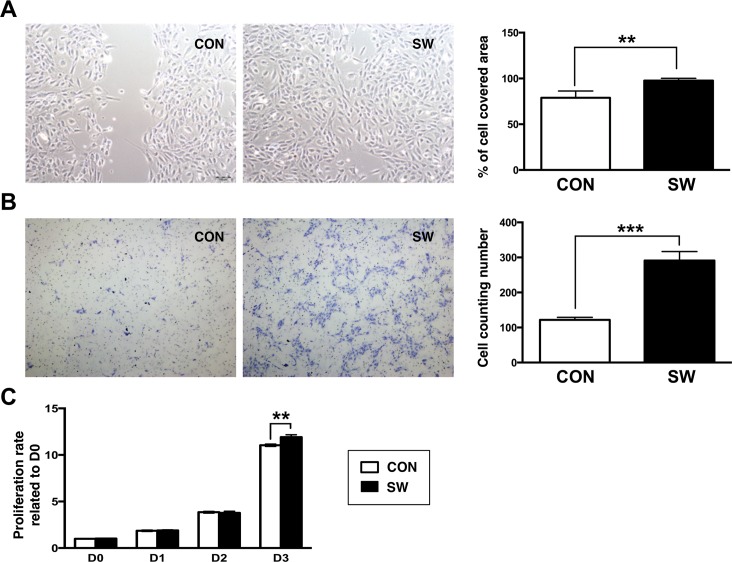
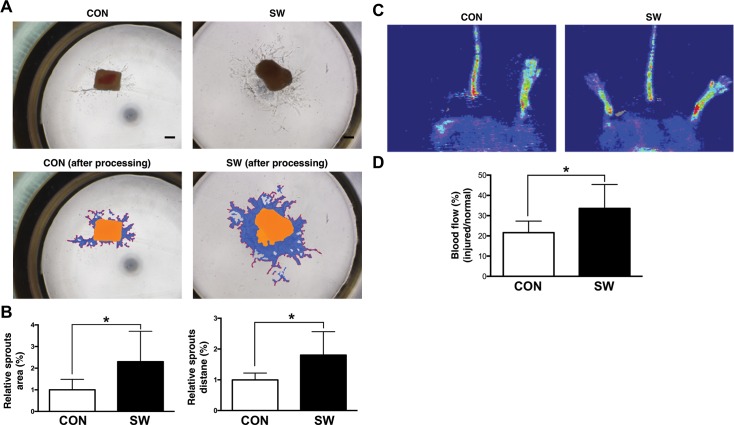
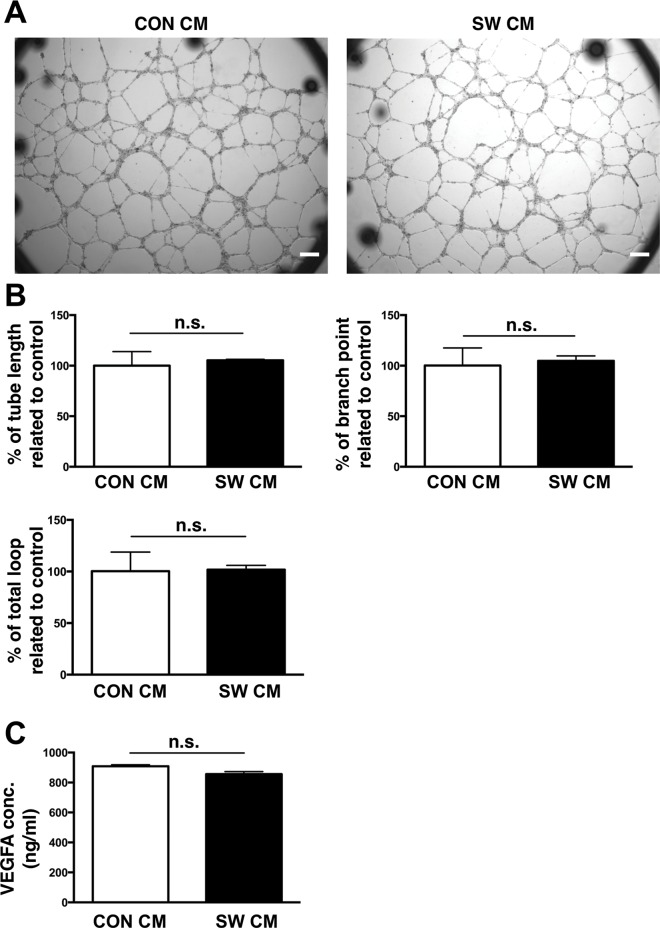
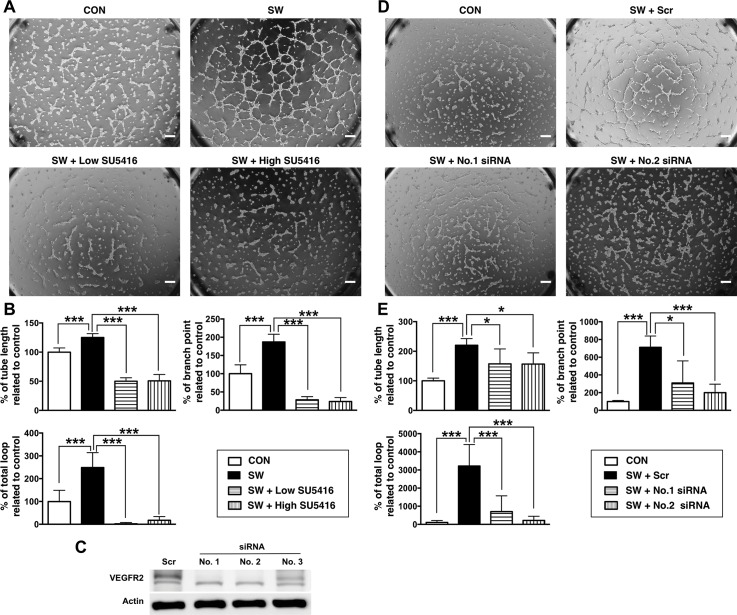
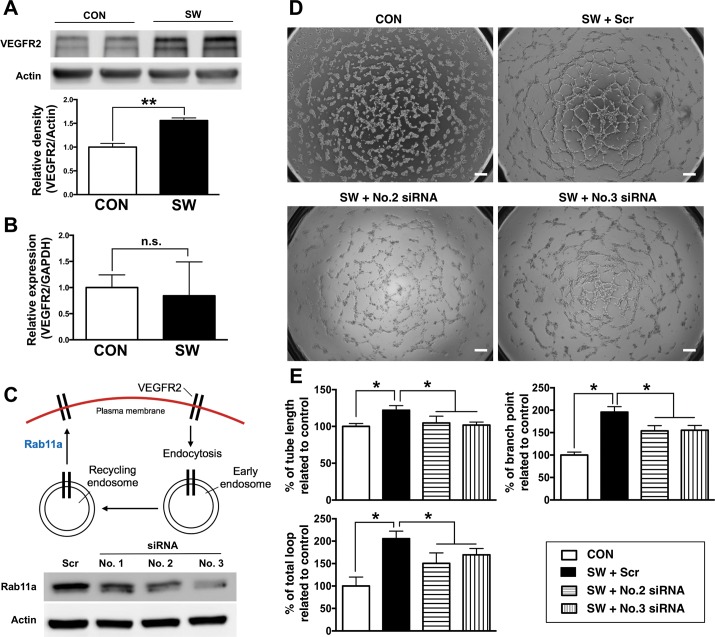
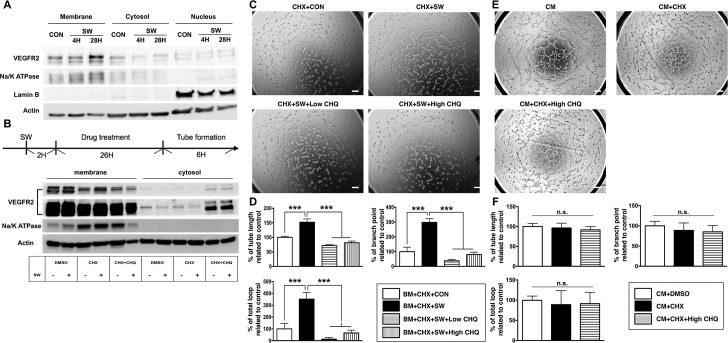
Although low-energy shock wave (SW) is adopted to treat ischemic diseases because of its pro-angiogenic properties, the underlying mechanism remains unclear. This study aimed at testing whether SW-induced angiogenesis may be through endothelial vascular endothelial growth factor receptor 2 (VEGFR2) signaling and trafficking. Phosphorylation of VEGFR2-Akt-eNOS axis and production of nitric oxide (NO) were determined in human umbilical vein endothelial cells (HUVECs) treated with SW. Carotid artery in ob/ob mice was treated with SW before evaluation with sprouting assay. Critical limb ischemia was induced in ob/ob mice to evaluate blood flow recovery after SW treatment. Tube formation and migration assays were also performed with/without SW treatment in the presence/absence of SU5416 (VEGFR2 kinase inhibitor) and siRNA-driven silencing of VEGFR2. Chloroquine was used for disrupting endosome, and Rab11a controlling slow endocytic recycling was silenced with siRNA in vitro. Following SW treatment, augmented ligand-independent phosphorylation in VEGFR2-Akt-eNOS axis and endogenous NO production, increased cellular migration and tube formation, elevated sprouting of carotid artery and blood flow in ischemic limb in ob/ob mice were noted. Moreover, SU5416 and VEGFR2 silencing both inhibited SW-induced angiogenesis. SW-induced angiogenesis, which was accompanied by increased VEGFR2 protein expression without transcriptional change, was suppressed by chloroquine and Rab11a silencing. We concluded that SW enhanced angiogenesis via ligand-independent activation of VEGFR2 and further prolonged through endosome-to-plasma membrane recycling in endothelial cells.

Keywords: VEGFR2; angiogenesis; endocytic recycling; endothelial cell; shock wave.


Conflict of interest statement

DISCLOSURE

The authors declare they have no competing interests as defined by Molecular Medicine, or other interests that might be perceived to influence the results and discussion reported in this paper.

Figures

Figure 1.
Figure 1.
Activation of VEGFR2-Akt-eNOS signaling pathway by shock wave treatment in HUVECs. (A) Demonstration of shock wave delivery to culture dish. (B) Expressions of cellular apoptosis-related proteins in HUVECs 28 h post-SW treatment assessed by Western blot, including cleavage PARP (c-PARP), cleavage caspase 3 (c-Casp 3) and Bax. Treatment of H2O2 (500 μmol/L) used as positive control. (C) Illustration showed that SW-induced angiogenesis may be achieved through VEGFR2-Akt-eNOS signaling pathway. Phosphorylation of VEGFR2, Akt and eNOS in HUVECs at 30 min and 90 min post-SW treatment compared with those in the control (CON) without SW treatment and with vascular endothelial growth factor A (VEGFA) treatment (50 ng/mL) in serum- and growth factor-free medium being used as positive control. (D) Quantification of VEGFR2 phosphorylation in HUVECs without (that is, CON) or with SW treatment (n = 4 in each group). (E) Representative fluorescent images of DAF-FM diacetate-treated HUVECs post-nitric oxide activation without (CON) or with SW treatment. Comparison of the percentage of fluorescence-positive cells between the two groups (n = 7 in each group). (F) Measurement of carotid artery contraction without (CON) and with SW treatment. Left pane: Potassium chloride (KCl)-induced vessel contraction. Right panel: Phenylephrine (PE)-induced vessel contraction. Data shown as means ± S.D. **P < 0.005 and *P < 0.05 determined by Student t test.
Figure 2.
Figure 2.
Shock wave (SW)-induced angiogenesis in vitro. (A) Representative images of tube formation assay with basal medium (BM, defined as serum- and growth factors-free) and complete medium (CM). (B) Parameters of tube formation assay, including tube length, branch point and the number of loops (n = 5 in each group). (C) Representative images of tube formation assay in control (CON) group and a dose-dependent increase of SW treatment in HUVECs (scale bar, 200 μm). (D) Parameters of tube formation assay, including tube length, branch point and the number of loop (n = 5 in each group). P for trend in those parameters showing a dose-dependent increased order. (E) Control (CON) and SW-treated HUVECs labeled with PKH67 (green) and PKH26 (red), respectively. Representative images of fluorescence signals (scale bar, 100 μm). Merged image with magnification indicated by yellow line showing amalgamation in tube formation assay. Data shown as mean ± S.D. *P < 0.05 determined by Student t test.
Figure 3.
Figure 3.
Enhancement of cellular migration and proliferation by shock wave (SW) treatment. (A) Representative images of wound healing assay without (CON) and with SW treatment. Computation of cell-covered area by WimScratch image analysis for cell motility determination (n = 4 in each group). (B) Representative images of transwell migration assay without (CON) and with SW treatment. Counting of hematoxylin-stained migrated cells by ImageJ for the cell motility determination (n = 5 in each group). (C) For cellular proliferation determination, HUVECs collected from d 0 to d 3 post-SW treatment subjected to MTT assay (n = 4 in each group/per d). Data shown as means ± S.D. *P < 0.05, **P < 0.005, ***P < 0.0005 by Student t test.
Figure 4.
Figure 4.
Shock wave (SW)-induced angiogenesis ex vivo and in vivo. (A) Representative sprouting morphology in ob/ob mice carotid artery with (n = 8) and without (n = 9) SW treatment (scale bar, 200 μm). Upper panel: Original images; Lower panel: Computer-processed images by WimSprout image analysis for sprouting determination. (B) Parameters of sprouting assay, including sprout area and sprout distance. (C) Representative images of laser Doppler flowmetry in ob/ob mice without (CON) and with SW treatment 14 d post-critical limb ischemia (CLI). (D) Measurement of blood flow post-CLI without (CON, n = 9) and with (n = 7) SW treatment by laser Doppler flowmetry. Data presented as mean ± S.D. *P < 0.05 determined by Student t test.
Figure 5.
Figure 5.
No vascular endothelial growth factor-A (VEGFA) increase post-shock wave (SW) administration. (A) Conditioned medium from control (CON CM) and SW-treated HUVECs (SW CM) applied to normal HUVECs for observation of tube formation (n = 3 in each group). (B) Parameters of tube formation assay, including tube length, branch point and loop number. (C) VEGFA in the conditioned medium from control and SW-treated HUVECs quantitated by ELISA (n = 4 in each group). Data shown as mean ± S.D. No significance (n.s.) determined by Student t test.
Figure 6.
Figure 6.
Importance of vascular endothelial growth factor receptor 2 (VEGFR2) in shock wave (SW)-induced angiogenesis. (A) Treatment with low-dose (5 μmol/L) (SW + Low SU5416) and high-dose (15 μmol/L) (SW + High SU5416) of SU5416 (VEGFR2 kinase inhibitor) in SW-treated HUVECs during tube formation assay. Morphology of tube-like structure at 6 h post seeding. (B) Parameters of tube formation assay, including tube length, branch point and the number of loops (n = 7 in each group). (C) Three different small interfering RNAs (siRNAs) for VEGFR2 silencing in HUVECs, evaluated by Western blot. (D) No.1 and No. 2 siRNAs-transfected HUVECs applied in tube formation assay, and (E) Quantification (n = 6 in each group). Data shown as mean ± S.D. ***P < 0.0005, *P < 0.05 determined by Student t test.
Figure 7.
Figure 7.
Expression of vascular endothelial growth factor receptor 2 (VEGFR2) in shock wave (SW)-induced angiogenesis. (A) Protein expression of VEGFR2 in HUVECs with (SW) and without (CON) SW treatment determined by Western blot (n = 4 in each group). (B) Expression of VEGFR2 mRNA in HUVECs at the end of 28 h without (CON) and with SW treatment determined by RT-qPCR (n = 3 in each group). (C) Illustration showed the endocytic route of endothelial VEGFR2 from early endosome to recycling endosome and ship back to the plasma membrane through Rab11a. Rab11a silencing in HUVECs by three different small interfering RNAs (siRNAs) evaluated by Western blot. (D) Tube formation assay posttransfection of scramble (Scr), No.2, and No.3 siRNAs with SW compared with those in the control (CON) without SW treatment. (E) Changes in parameters of tube formation assay, including tube length, branch point and the number of loops (n = 5 in each group) post Rab11a silencing with No.2 and No.3 siRNAs. Data shown as mean ± S.D. *P < 0.05 determined by Student t test.
Figure 8.
Figure 8.
Endocytic recycling of vascular endothelial growth factor receptor 2 (VEGFR2) post-shock wave (SW) treatment. (A) VEGFR2, Na/K ATPase (marker of membrane protein), Lamin B (marker of nucleus protein) and actin in protein fraction of HUVECs (including membrane, cytosol and nucleus parts) at the end of the first 4 and 28 h post-SW treatment compared with control (CON) assessed by Western blot. (B) The workflow noted three time points for SW, drug treatment and tube formation. Protein expressions of VEGFR2 (with short and long exposure time), Na/K ATPase and actin in HUVECs (fractionized into membrane and cytosol parts) assessed by Western blot 26 h following DMSO, cycloheximide (CHX) and chloroquine (CHQ) treatment with and without SW administration. (C) Tube formation assay for HUVECs 26 h post being treated with cycloheximide (CHX) and chloroquine (CHQ, 5 & 20 μmol/L) in basal medium (BM, without FBS and growth factors) with and without SW treatment. (D) Parameters of tube formation assay, including tube length, branch point and the number of loops (n = 6 in each group). (E) Tube formation assay for HUVECs 26 h after being treated with DMSO, cycloheximide (CHX) and high concentration of chloroquine (CHQ, 20 μmol/L) in complete medium (CM, that is, contained FBS and growth factors). (F) Parameters of tube formation assay, including tube length, branch point and the number of loops (n = 5 in each group). Data shown as mean ± S.D. ***P < 0.0001 determined by Student t test.

References

    1. Langer PR. Two emerging technologies for Achilles tendinopathy and plantar fasciopathy. Clin Podiatr Med Surg. 2015;32:183–93. - PubMed
    1. Wang CJ. Extracorporeal shockwave therapy in musculoskeletal disorders. J Orthop Surg Res. 2012;7:11. - PMC - PubMed
    1. Mani-Babu S, Morrissey D, Waugh C, Screen H, Barton C. The effectiveness of extracorporeal shock wave therapy in lower limb tendinopathy: a systematic review. Am J Sports Med. 2015;43:752–61. - PubMed
    1. Wang CJ, Wang FS, Yang KD, Weng LH, Ko JY. Long-term results of extracorporeal shockwave treatment for plantar fasciitis. Am J Sports Med. 2006;34:592–6. - PubMed
    1. Gruenwald I, Appel B, Kitrey ND, Vardi Y. Shockwave treatment of erectile dysfunction. Ther Adv Urol. 2013;5:95–9. - PMC - PubMed

LinkOut - more resources