. 2016 Oct-Dec;42(8-10):425-439.
doi: 10.1080/01902148.2016.1258442. Epub 2016 Dec 7.

Analysis of the intestinal microbial community and inferred functional capacities during the host response to Pneumocystis pneumonia

Affiliations

Analysis of the intestinal microbial community and inferred functional capacities during the host response to Pneumocystis pneumonia

Derrick R Samuelson et al. Exp Lung Res. 2016 Oct-Dec.

Abstract

Background: Pneumocystis pneumonia is a major cause of morbidity and mortality in patients infected with HIV/AIDS. In this study, we evaluated the intestinal microbial communities associated with the development of experimental Pneumocystis pneumonia, as there is growing evidence that the intestinal microbiota is critical for host defense against fungal pathogens.

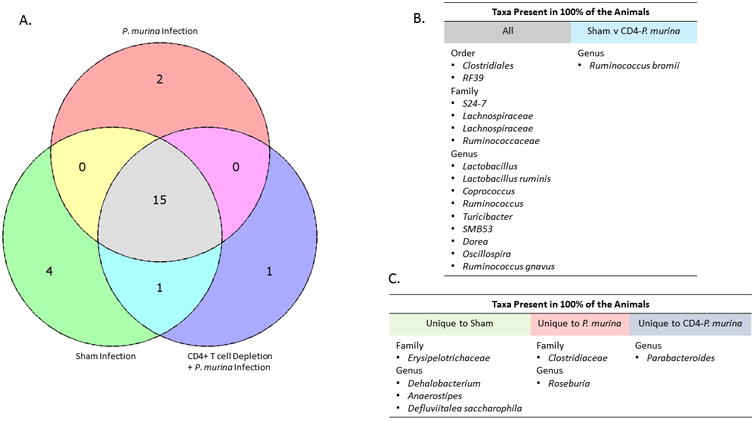
Methods: C57BL/6 mice were infected with live Pneumocystis murina (P. murina) via intratracheal inoculation and sacrificed 7 and 14 days postinfection for microbiota analysis. In addition, we evaluated the intestinal microbiota from CD4+ T cell depleted mice infected with P. murina.

Results: We found that the diversity of the intestinal microbial community was significantly altered by respiratory infection with P. murina. Specifically, mice infected with P. murina had altered microbial populations, as judged by changes in diversity metrics and relative taxa abundances. We also found that CD4+ T cell depleted mice infected with P. murina exhibited significantly altered intestinal microbiota that was distinct from immunocompetent mice infected with P. murina, suggesting that loss of CD4+ T cells may also affects the intestinal microbiota in the setting of Pneumocystis pneumonia. Finally, we employed a predictive metagenomics approach to evaluate various microbial features. We found that Pneumocystis pneumonia significantly alters the intestinal microbiota's inferred functional potential for carbohydrate, energy, and xenobiotic metabolism, as well as signal transduction pathways.

Conclusions: Our study provides insight into specific-microbial clades and inferred microbial functional pathways associated with Pneumocystis pneumonia. Our data also suggest a role for the gut-lung axis in host defense in the lung.

Keywords: Pneumocystis; metagenomics; microbiota; pneumonia.


Conflict of interest statement

The authors report no conflicts of interest. The authors alone are responsible for the content and writing of the paper.

Figures

Figure 1
Figure 1. Schematic outline of the experimental protocol used in this study
C57BL/6 mice were infected intratracheally with live P. murina (∼2 × 10⁵ cysts in 100 μl of PBS) and sacrificed at 7 and 14 days post infection. Mice were grouped into the following categories; uninfected animals (designated Sham Infected), P. murina infected immune intact animals (P. murina Infected), and mice depleted of CD4+ T cells and infected with P. murina (CD4+ T cell Depletion + P. murina Infection). CD4-depletion started three days prior to infection with P. murina and was maintained continuously throughout the experiment.
Figure 2
Figure 2. Pneumocystis pneumonia significantly alters the intestinal microbiota community 7 days post infection
Immune intact mice and CD4-depleted mice were infected intratracheally with live P. murina (∼2 × 10⁵ cysts in 100 μl of PBS), control animals were given a naïve lung homogenate. Animals were then sacrificed seven days post infection and P. murina lung burden and microbiota community structures were assessed. (A) P. murina lung burden 7 days post infection. (B) IFN-y levels in the lung and (C) IFN-y levels in the serum 7 days post infection. Principal coordinate analysis of the Unifrac metric (D unweighted and E weighted). (F) Observed species alpha diversity and (G) taxonomy classification were analyzed using QIIME software to determine differences in microbial community structures. The sequences from 10 animals per treatment are shown in each analysis. The taxonomy summary (G) represents taxa with greater than 1% total representation. Each dot represents an individual mouse, bars represent mean ± SEM, N=10. For taxonomic classifications * indicates P < 0.05 for control infected v. P. murina infected animals, + indicates P < 0.05 for control infected animals v. P. murina infected CD4-depleted mice, and # indicates P< 0.05 for P. murina infected v. P. murina infected CD4-depleted mice by two-way ANOVA with Bonferroni multiple comparisons corrected posttest. Mice with no detectable P. murina in the lung were given a count of 1 for visualization on a log scale.
Figure 3
Figure 3. Core microbiome of sham infected mice, P. murina infected mice, and CD4-depleted mice infected with P. murina 7 days post infection
Core taxa present in 100% of each treatment condition were compared. Taxa in gray were found in all of the animals, taxa in red were only found in P. murina infected animals, taxa in green were only found in sham infected animals, taxa in blue were only found in CD4-depleted animals infected with P. murina, taxa in yellow were only found in P. murina infected animals and sham infected mice, taxa in purple were found in P. murina infected animals and CD4-depleted animals infected with P. murina, and taxa in teal were found in sham infected animals and CD4-depleted animals infected with P. murina. Taxa found in each section are shown in the breakout tables.
Figure 4
Figure 4. Pneumocystis pneumonia significantly alters the inferred functional capacity of the intestinal microbiota community 7 days post infection
Immune intact mice and CD4-depleted mice were infected intratracheally with live P. murina (∼2 × 10⁵ cysts in 100 μl of PBS), control animals were given a naïve lung homogenate. Animals were then sacrificed seven days post infection and P. murina lung burden and inferred functional capacity of the microbiota communities were assessed. (A) The relative abundance of seven functional categories during P. murina infection. (B) Relative abundance of specific pathways involved in carbohydrate metabolism. (C) Relative abundance of specific pathways involved in signal transduction. (D) Relative abundance of specific pathways involved in energy metabolism. (E) Relative abundance of specific pathways involved in xenobiotic metabolism. Boxplots denote top quartile and bottom quartile, whiskers are plotted by min to max, N=10, * indicates P < 0.05 for control infected v. P. murina infected animals, by two-way ANOVA with Bonferroni multiple comparisons corrected posttest.
Figure 5
Figure 5. Pneumocystis pneumonia significantly alters the intestinal microbiota community 14 days post infection
Immune intact mice and CD4-depleted mice were infected intratracheally with live P. murina (∼2 × 10⁵ cysts in 100 μl of PBS), control animals were given a naïve lung homogenate. Animals were then sacrificed fourteen days post infection and P. murina lung burden and microbiota community structures were assessed. (A) P. murina lung burden 14 days post infection. (B) IFN-y levels in the lung and (C) IFN-y levels in the serum 14 days post infection. Principal coordinate analysis of the Unifrac metric (D unweighted and E weighted). (F) Observed species alpha diversity and (G) taxonomy classification were analyzed using QIIME software to determine differences in microbial community structures. The sequences from 10 animals per treatment are shown in each analysis. The taxonomy summary (G) represents taxa with greater than 1% total representation. Each dot represents an individual mouse, bars represent mean ± SEM, N=10. For taxonomic classifications * indicates P < 0.05 for control infected v. P. murina infected animals, + indicates P < 0.05 for control infected animals v. P. murina infected CD4-depleted mice, and # indicates P< 0.05 for P. murina infected v. P. murina infected CD4-depleted mice by two-way ANOVA with Bonferroni multiple comparisons corrected posttest. Mice with no detectable P. murina in the lung were given a count of 1 for visualization on a log scale.
Figure 6
Figure 6. Core microbiome of sham infected mice, P. murina infected mice, and CD4-depleted mice infected with P. murina 14 days post infection
Core taxa present in 100% of each treatment condition were compared. Taxa in gray were found in all of the animals, taxa in red were only found in P. murina infected animals, taxa in green were only found in sham infected animals, taxa in blue were only found in CD4-depleted animals infected with P. murina, taxa in yellow were only found in P. murina infected animals and sham infected mice, taxa in purple were found in P. murina infected animals and CD4-depleted animals infected with P. murina, and taxa in teal were found in sham infected animals and CD4-depleted animals infected with P. murina. Taxa found in each section are shown in the breakout tables.
Figure 7
Figure 7. Pneumocystis pneumonia significantly alters the inferred functional capacity of the intestinal microbiota community 14 days post infection
Immune intact mice and CD4-depleted mice were infected intratracheally with live P. murina (∼2 × 10⁵ cysts in 100 μl of PBS), control animals were given a naïve lung homogenate. Animals were then sacrificed fourteen days post infection and P. murina lung burden and inferred functional capacity of the microbiota communities were assessed. (A) The relative abundance of seven functional categories during P. murina infection. (B) Relative abundance of specific pathways involved in cell motility. (C) Relative abundance of specific pathways involved in signal transduction. (D) Relative abundance of specific pathways involved in biosynthesis of secondary metabolites. (E) Relative abundance of specific pathways involved in energy metabolism. (F) Relative abundance of specific pathways involved in carbohydrate metabolism. (G) Relative abundance of specific pathways involved in xenobiotic metabolism. (H) Relative abundance of specific pathways involved in lipid metabolism. Boxplots denote top quartile and bottom quartile, whiskers are plotted by min to max, N=10, * indicates P < 0.05 for control infected v. P. murina infected animals or for P. murina infected v. P. murina infected CD4-depleted mice. # indicates P< 0.05 for Sham infected v. P. murina infected CD4-depleted mice by two-way ANOVA with Bonferroni multiple comparisons corrected posttest.

References

    1. Beck JM, Warnock ML, Kaltreider HB, Shellito JE. Host defenses against Pneumocystis carinii in mice selectively depleted of CD4+ lymphocytes. Chest. 1993;103(2 Suppl):116s–8s. - PubMed
    1. Shellito J, Suzara VV, Blumenfeld W, Beck JM, Steger HJ, Ermak TH. A new model of Pneumocystis carinii infection in mice selectively depleted of helper T lymphocytes. J Clin Invest. 1990;85(5):1686–93. - PMC - PubMed
    1. Morris A, Lundgren JD, Masur H, Walzer PD, Hanson DL, Frederick T, et al. Current epidemiology of Pneumocystis pneumonia. Emerg Infect Dis. 2004;10(10):1713–20. - PMC - PubMed
    1. Autran B, Carcelain G, Li TS, Blanc C, Mathez D, Tubiana R, et al. Positive effects of combined antiretroviral therapy on CD4+ T cell homeostasis and function in advanced HIV disease. Science. 1997;277(5322):112–6. - PubMed
    1. Connors M, Kovacs JA, Krevat S, Gea-Banacloche JC, Sneller MC, Flanigan M, et al. HIV infection induces changes in CD4+ T-cell phenotype and depletions within the CD4+ T-cell repertoire that are not immediately restored by antiviral or immune-based therapies. Nat Med. 1997;3(5):533–40. - PubMed

Publication types