. 2017 Jan 3;8(1):70-82.
doi: 10.18632/oncotarget.13783.

High salt diet stimulates gut Th17 response and exacerbates TNBS-induced colitis in mice

Affiliations

High salt diet stimulates gut Th17 response and exacerbates TNBS-induced colitis in mice

Yingfeng Wei et al. Oncotarget. .

Abstract

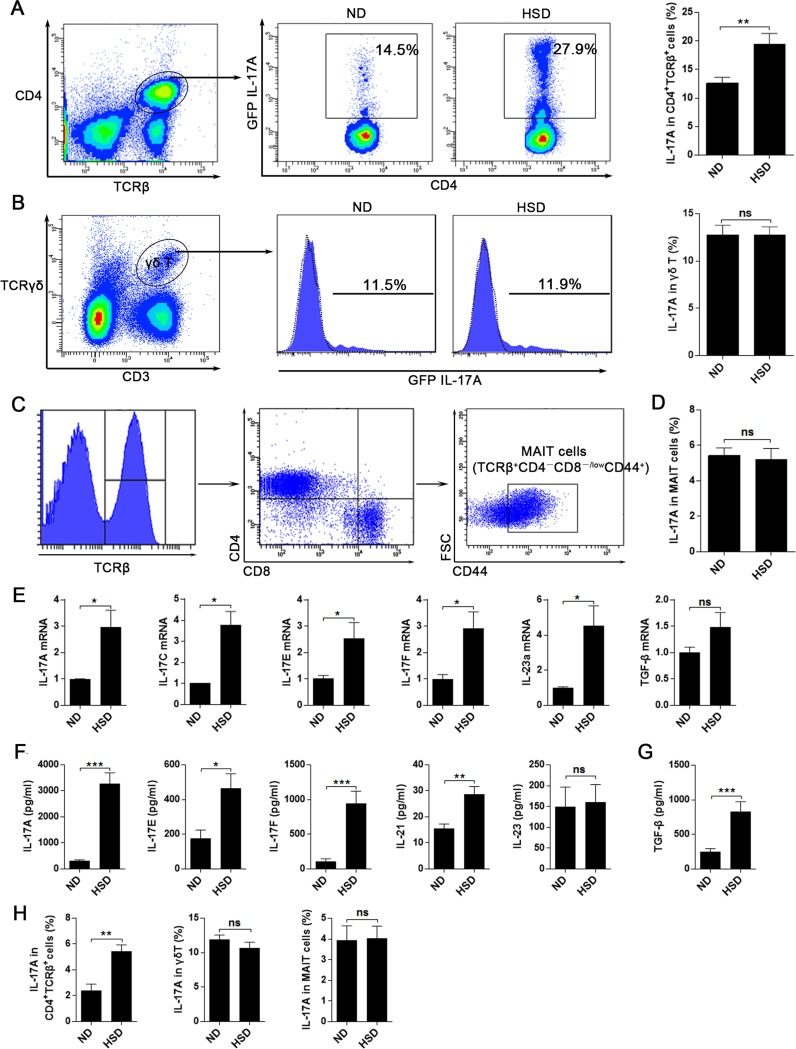
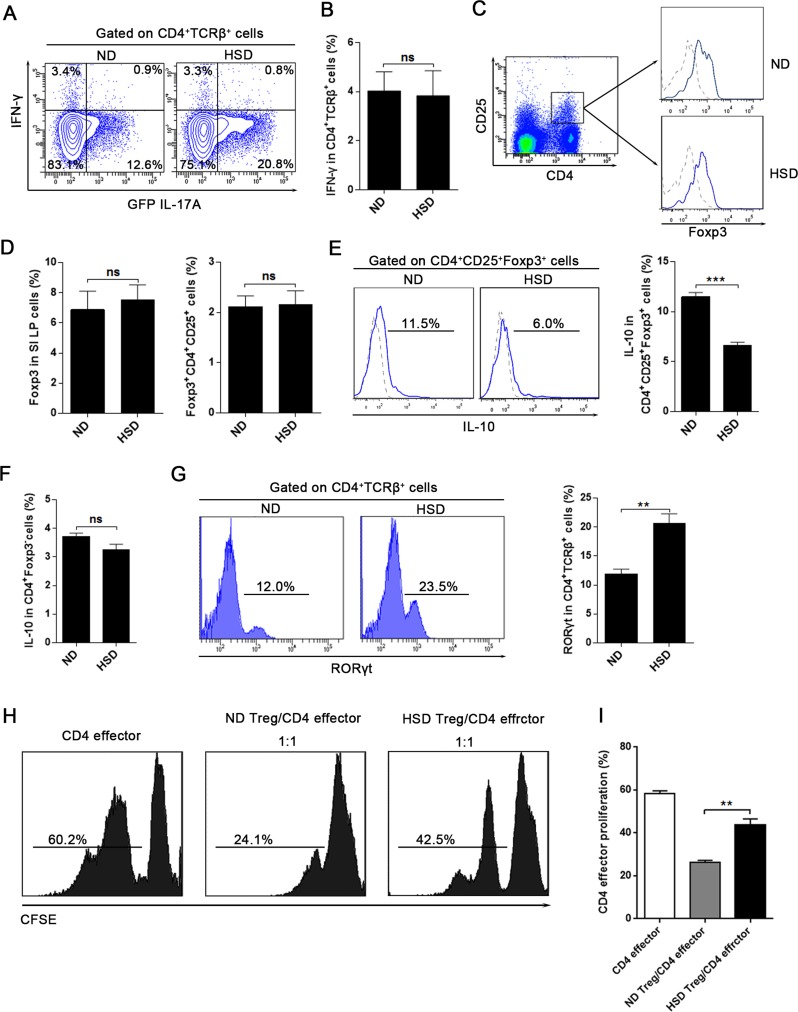
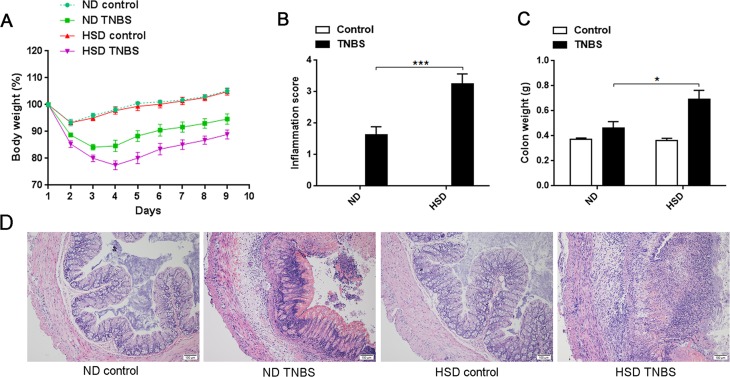
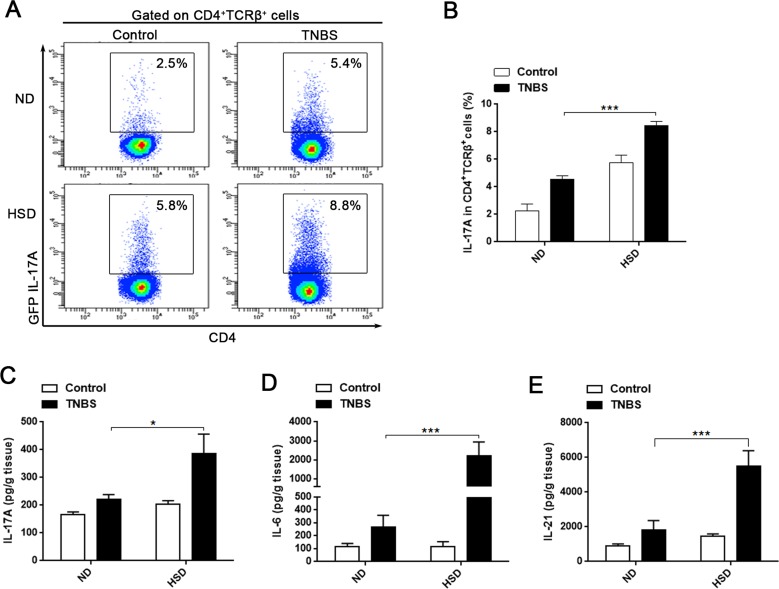
This study focuses on characterizing the effect of a high salt diet (HSD) on intestinal immunity and the risk of inflammatory bowel diseases (IBD). We found that mice on a HSD had an increased frequency of IL-17A producing cells in the intestinal lamina propria (LP) compared to mice on a normal diet (ND). Furthermore, most intestinal IL-17A producing cells were CD4+TCRβ+ cells. A HSD increased the LP T helper 17 (Th17) responses in both the small and large intestines but did not increase the Th17 response of other gut-associated lymphoid organ. Although, HSD did not change the percentage of regulatory T (Treg) cells, HSD significantly inhibit secretion of IL-10 and the suppressive function of Treg cells. Moreover, we found that HSD exacerbates trinitrobenzenesulfonic acid (TNBS) induced colitis, and Th17 response was significantly increased in the colonic LP of HSD TNBS-treated mice compared with the ND TNBS-treated mice. This study demonstrates that HSD stimulates the intestinal Th17 response but inhibits the function of Treg cells. Moreover, HSD exacerbates TNBS induced mice colitis, suggesting that HSD disrupts the intestinal immunity and increases the risk of IBD.

Keywords: Immune response; Immunity; Immunology and Microbiology Section; Th17 cells; high salt diet; inflammatory bowel diseases; intestinal immunity; regulatory T cells.


Conflict of interest statement

CONFLICTS OF INTEREST

The authors declare that there are no conflicts of interest.

Figures

Figure 1
Figure 1. HSD stimulates IL-17A producing cells in intestinal lamina propria (LP)
We isolated lymphocytes from small intestinal LP (SI LP), large intestinal LP (LI LP), small intestinal intraepithelial (SI IEL), large intestinal intraepithelial (LI IEL), mesenteric lymph node (MLN), and Peyer's patch (PP), the mice include ND WT mice and IL-17A-GFP mice that accept 3 weeks ND or HSD. Immediately following isolation, cells were incubated for 4 hr with PMA/Ionomycin and GolgiPlug, and analyzed by flow cytometry. A. Representative flow cytometric scatterplot of GFP IL-17A+ cells in the SI LP and LI LP, data were gated on lymphocytes. B. The proportion of GFP IL-17A+ cells within the lymphocytes obtained from different locations (n = 8). C. After gated on the SI LP IL-17A+ cell, the cell fraction of CD4+TCRβ+ cells, γδ T cells, MAIT cells and NKT cells was measured (n = 8). D. The absolute number of CD4+TCRβ+ cells, γδ T, MAIT and NKT cells of the SI LP, data were acquired by flow cytometry and is expressed as cell number per gram of the small intestine (n = 8). E. The representative flow cytometric scatterplot of GFP IL-17A production of ILCs (lineageCD45+CD90.2+) from the SI LP, MLN and spleen cells, the gated program was showed in Supplementary Figure 2. F. Summative histogram of GFP IL-17A expression in ILCs (n = 6). G. The percentages of ILCs in the lymphocytes from SI LP, MLN, PP and spleen (n = 6). H. Of IL-17A producing cells, the percentage of ILCs in the SI LP was analyzed (n = 6). Data are expressed as mean ± SEM from three independent experiments.
Figure 2
Figure 2. HSD leads to an increased Th17 response in intestinal lamina propria
A.-D. Fresh isolated SI LP lymphocytes from specified diet (3 weeks) mice were incubated for 4 hr with PMA/Ionomycin and GolgiPlug, and intracellular GFP IL-17A expression was evaluated by flow cytometry. A, proportion of IL-17A+ cells within the CD4+TCRβ+ SI LP lymphocytes from specified diet IL-17A-GFP mice (n = 8). B, proportion of IL-17A+ cells within the SI LP γδ T cells (n = 6), filled flow cytometric histograms represent the IL-17A-GFP mice and the dashed line histograms represent the WT mice. C, the flow cytometric gated program of the MAIT cells. D, proportion of IL-17A+ cells within the SI LP MAIT cells (n = 6). E. the mRNA expression of IL-17A, IL-17C, IL-17E, IL-17F, IL-23a and TGF-β, data were acquired from the fresh isolated SI LP cell from the mice exposed to 3 weeks of ND or HSD (n = 8). F.-G. comparison of the IL-17A, IL-17E, IL-17F, IL-21, IL-23 and TGF-β secreting levels of the SI LP cells from the mice exposed to 3 weeks of ND or HSD, fresh isolated SI LP cells were cultured in vitro with the stimulation of PMA and Con A for 12hr, than the supernatant were collected and analyzed (n = 8). H. fresh isolated LI LP lymphocytes from specified diet (3 weeks) mice were incubated for 4 hr with PMA/Ionomycin and GolgiPlug, and intracellular GFP IL-17A expression of CD4+TCRβ+ cells, γδ T cells and MAIT cells were evaluated by flow cytometry (n = 6). Data are expressed as mean ± SEM from three independent experiments.
Figure 3
Figure 3. HSD does not alter T helper 1 (Th1) response but impairs the Th17:Treg balance
A. and B. IL-17A-GFP mice were exposed to 3 weeks of ND or HSD before sacrifice, the proportion of IFN-γ+ and GFP IL-17A+ cells within the CD4+TCRβ+ SI LP lymphocytes were analyzed (n = 6), data were acquired by intracellular staining from the SI LP lymphocytes which were incubated for 4 hr with PMA/Ionomycin and GolgiPlug. C.-G. Measurements of the SI LP cells that isolated from the mice on a ND or HSD diet for 3 weeks. C, the flow cytometric gating strategy for CD4+CD25+Foxp3+ Treg cells, the Foxp3 level was analyzed after gated on CD4+CD25+ cells, in the right panel, dash line represent the Foxp3 isotype control and the solid line represent the Foxp3 staining. D, the summative data of the Foxp3 expression and the percentages of CD4+CD25+Foxp3+ Treg cells in the SI LP cells (n = 8). E-F, the IL-10 production of the CD4+CD25+Foxp3+ cells and the CD4+Foxp3 cells, fresh isolated SI LP cells were incubated for 4 hr with PMA/Ionomycin and GolgiPlug before intracellular staining by True-NuclearTM Transcription Factor Buffer Set. G, the RORγt level of the SI LP CD4+TCRβ+ cells (n = 6). H-I, Treg suppression assay, the CD4 effector cells (CD4+CD62L+CD44) were sorted from mice exposed to 3 weeks of ND, the CD4+CD25+ Treg were sorted from mice exposed to 3 weeks of ND or HSD, CD4 effector cells were labeled with CFSE, stimulated with CD3/CD28 Dynabeads and cultured alone or co-cultured with Treg at ratios as indicated (with IL-2). H. CFSE dilution of CD4 effector cells was measured by flow cytometry after 3.5 days, and CFSE dilution was obtained after gating on CD62L+ cells (CD4 effector cells). I. Summary of the proliferation rate of the CD4 effector cells. Data are expressed as mean ± SEM from three independent experiments.
Figure 4
Figure 4. Actue TNBS-induced colitis was exacerbated in mice fed a HSD
A. Weight loss of mice after induction of TNBS colitis, IL-17A-GFP mice were subjected to a ND or HSD before (3 weeks) and after TNBS or ethanol treatment, and the mice were weighed daily after colitis induced (n = 8). B. Colon inflammation was graded on the basis of the criteria as described, and data was acquired 3 days after colitis induction (n = 6). C. The mice colon weight was acquired 3 days after colitis induction (n = 6). D. Representative H&E-stained colon cross-sections 3 days after colitis induction, scale bar = 100μm. Data are expressed as mean ± SEM from three independent experiments.
Figure 5
Figure 5. Th17 response was stimulated in acute TNBS-induced colitis of mice fed a HSD
A. and B. the proportion of GFP IL-17A+ cells within the CD4+TCRβ+ LI LP lymphocytes. Cells were isolated from specified diet IL-17A-GFP mice 3 days after colitis induction and incubated for 4 hr with PMA/Ionomycin and GolgiPlug (n = 8). C., D. and E. ELISA analysis of the colonic IL-17A (C), IL-6 (D) and IL-21 (E) of ND or HSD colitis-induced mice, colonic tissues were sampled from specified diet mice 3 days following induction of colitis (n = 8). Data are expressed as mean ± SEM from three independent experiments.

References

    1. Landsberg L, Aronne LJ, Beilin LJ, Burke V, Igel LI, Lloyd-Jones D, Sowers J. Obesity-related hypertension: pathogenesis, cardiovascular risk, and treatment—a position paper of the The Obesity Society and The American Society of Hypertension. Obesity (Silver Spring, Md) 2013;21(1):8–24. - PubMed
    1. McGuire S. Strategies to Reduce Sodium Intake in the United States. 1. Vol. 1. Washington, DC: The National Academies Press; 2010. 2010. Institute of Medicine; pp. 49–50. Advances in nutrition (Bethesda, Md) - PMC - PubMed
    1. Appel LJ, Frohlich ED, Hall JE, Pearson TA, Sacco RL, Seals DR, Sacks FM, Smith SC, Jr, Vafiadis DK, Van Horn LV. The importance of population-wide sodium reduction as a means to prevent cardiovascular disease and stroke: a call to action from the American Heart Association. Circulation. 2011;123(10):1138–1143. - PubMed
    1. Brown IJ, Tzoulaki I, Candeias V, Elliott P. Salt intakes around the world: implications for public health. International journal of epidemiology. 2009;38(3):791–813. - PubMed
    1. Savica V, Bellinghieri G, Kopple JD. The effect of nutrition on blood pressure. Annual review of nutrition. 2010;30:365–401. - PubMed

MeSH terms