. 2016 Dec 15;540(7633):400-405.
doi: 10.1038/nature20571. Epub 2016 Dec 7.

Electric-field-stimulated protein mechanics

Affiliations

Electric-field-stimulated protein mechanics

Doeke R Hekstra et al. Nature. .

Abstract

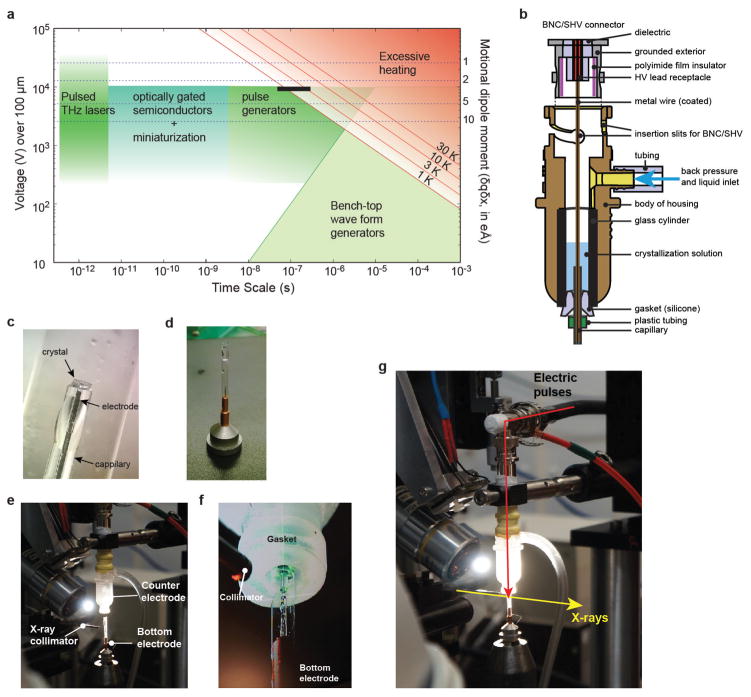
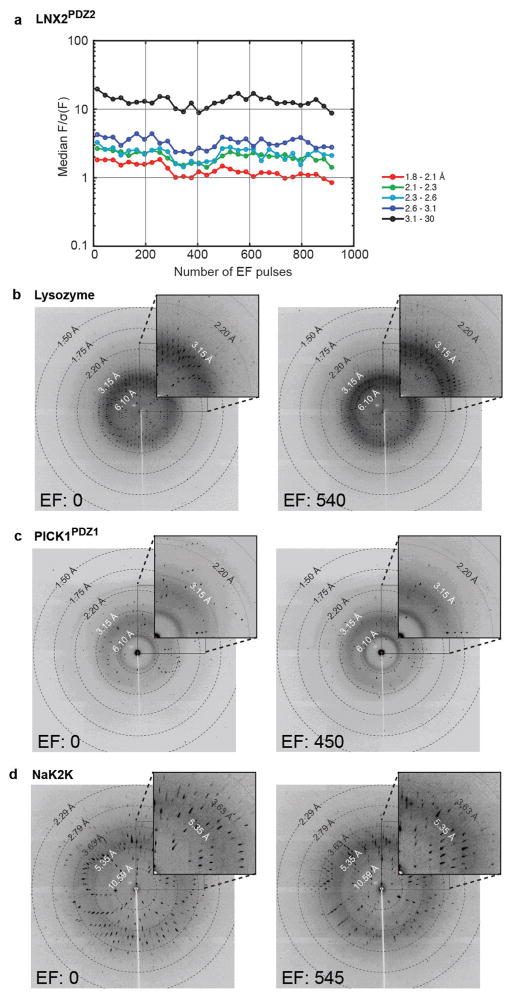
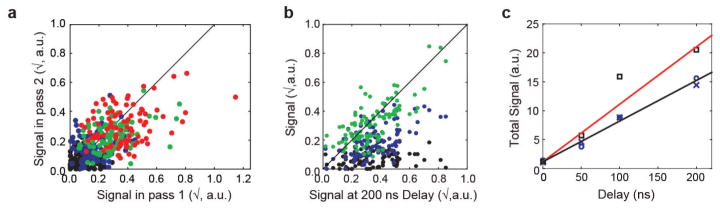
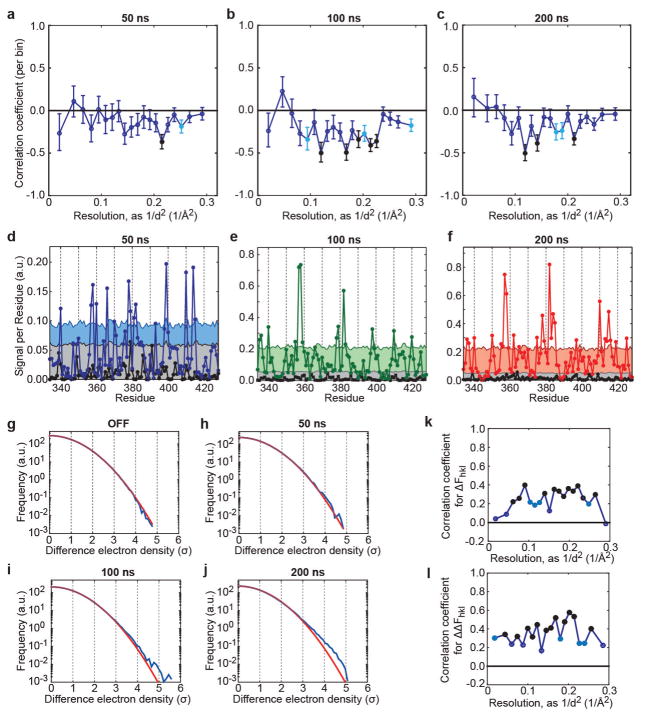
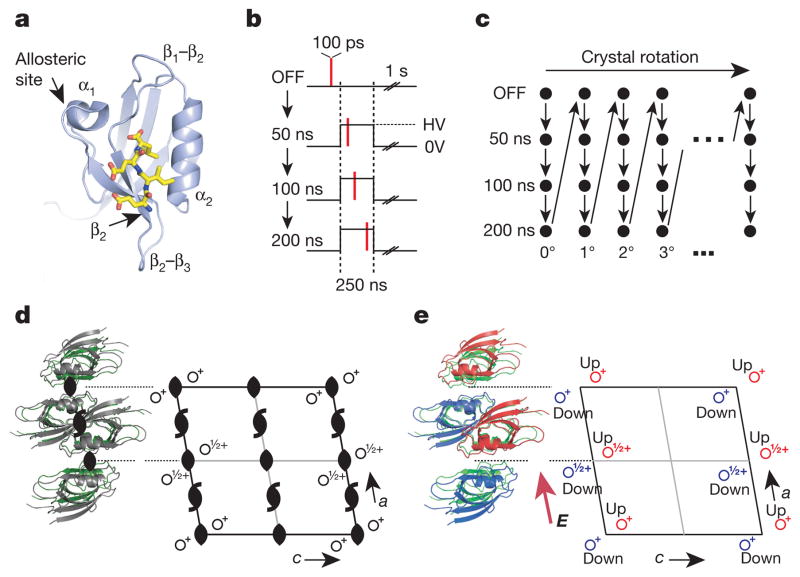
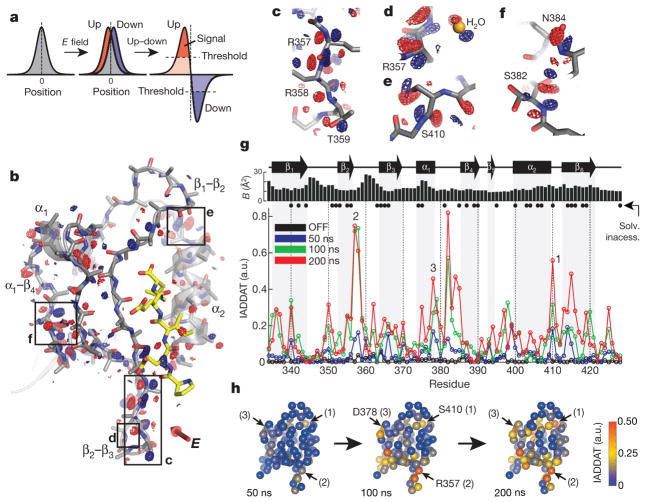
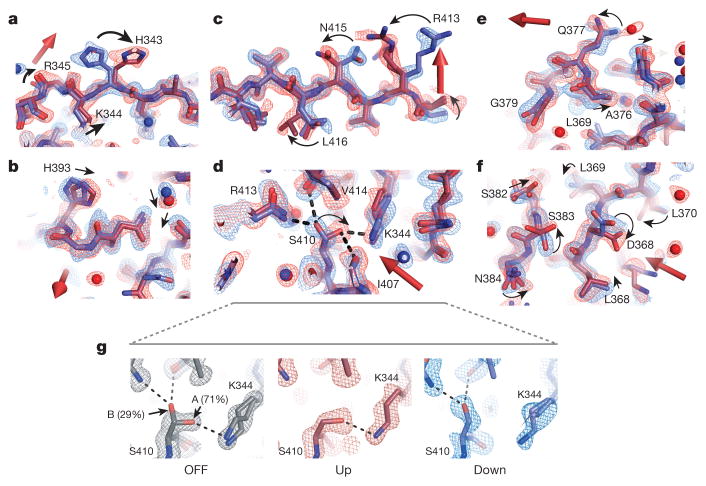
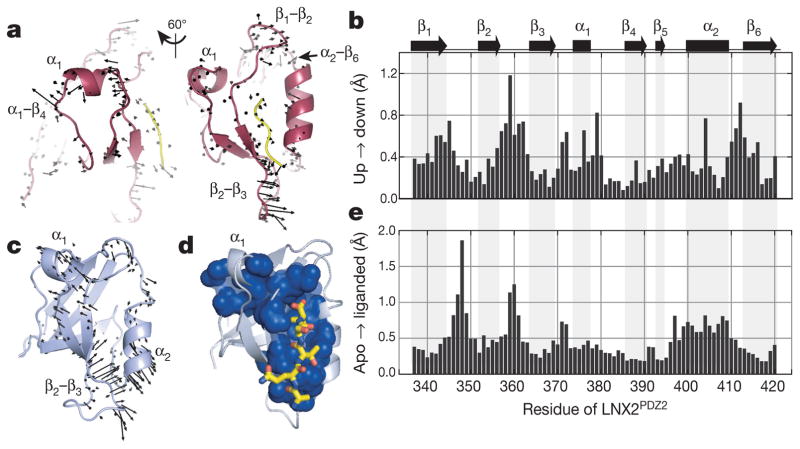
The internal mechanics of proteins-the coordinated motions of amino acids and the pattern of forces constraining these motions-connects protein structure to function. Here we describe a new method combining the application of strong electric field pulses to protein crystals with time-resolved X-ray crystallography to observe conformational changes in spatial and temporal detail. Using a human PDZ domain (LNX2PDZ2) as a model system, we show that protein crystals tolerate electric field pulses strong enough to drive concerted motions on the sub-microsecond timescale. The induced motions are subtle, involve diverse physical mechanisms, and occur throughout the protein structure. The global pattern of electric-field-induced motions is consistent with both local and allosteric conformational changes naturally induced by ligand binding, including at conserved functional sites in the PDZ domain family. This work lays the foundation for comprehensive experimental study of the mechanical basis of protein function.


Conflict of interest statement

The authors declare no competing financial interests.

Figures

Extended Data Figure 1
Extended Data Figure 1. The experimental setup of EF-X
a, A plot relating the applied voltage across a 100-μm-thick crystal (left axis) and the size of transition dipole moments of conformational changes that can be excited by 1kBT (right axis) to the duration of the applied electric field. Feasible methods of generating strong electric field pulses are indicated as green and cyan shaded areas. Waveform and pulse generators can provide pulses down to the nanosecond timescale. Faster pulses can be generated using terahertz pulsed lasers with strong electric field components or by optical gating of semiconductors; such systems are already present at third-generation synchrotron and X-ray free-electron laser facilities. The black bar indicates the approximate range covered by the current experiments. The calculation of temperature jumps caused by the electric field is described in Supplementary Information IA. b, Schematic cross-section of the counter electrode. The blue arrow indicates the path by which backpressure is applied to drive flow through the capillary (see Methods). c, Crystals are mounted on top of capillaries containing a metal electrode and soaked in crystallization solution. d, The capillary with crystal is mounted in a reusable goniometer base and protected from humidity fluctuations with a polyester sleeve (MiTeGen) containing 50% (v/v) crystallization solution. This assembly forms the bottom electrode. e, The counter and bottom electrodes are assembled at the beam line to allow rotation around the capillary axis. f, Once the sleeve is trimmed to just above the level of the crystal, the counter electrode is brought in using a translation stage (camera view of the approach) (Supplementary Video 2). g, Overview of the final set up with the direction of the X-ray and electric field pulses, reproduced from Fig. 1e.
Extended Data Figure 2
Extended Data Figure 2. Tolerance of electric field pulses in several protein crystals
a, Diffraction quality of a LNX2PDZ2 crystal (experiment 3-35, Supplementary Table 2), measured by the ratio of structure factor amplitude to noise (F/σ(F)) as a function of number of 250 ns, 6 kV electric field pulses and as a function of resolution bin (in colours, see legend). bd, Diffraction images for three other protein crystals before (left) and after (right) ~ 500 electric field pulses (precise value indicated). Crystal orientations are different between before and after frames. The data correspond to the following experiments in Supplementary Table 2: b, lysozyme, experiment 3-08; c, PDZ1 of PICK1, experiment 3-17; d, NaK2K, experiment 3-80. The data indicate that several protein crystals can tolerate the EF-X experiment.
Extended Data Figure 3
Extended Data Figure 3. Internal consistency and temporal evolution of internal difference map signal
ac, Analysis for the data presented in Fig. 3. a, Consistency of estimated signal per residue derived from two data collection passes on the same crystal (black: OFF; blue: 50 ns; green: 100 ns; red: 200 ns). Overall correlation coefficient 0.59. Signal is defined as the integrated absolute difference density above 2.5σOFF within 1.5 Å of the protein backbone, square-root transformed to stabilize variance. Per-time-point correlation coefficients are: − 0.07 (OFF, P > 0.1), 0.23 (50 ns; P = 0.01); 0.35 (100 ns; P < 10−3) and 0.34 (200 ns; P < 10−3). b, Consistency of the obtained signal per residue between time points. Correlation coefficients are: 0.17 (OFF; P = 0.05), 0.55 (50 ns; P = 1 × 10⁻⁹) and 0.72 (100 ns; P < 10−20). The diagonal is shown for reference. Note that slight correlation in the OFF data set may indicate imperfect correction for anisotropic absorption. c, Signal integrated along the entire protein backbone in passes 1 and 2 (blue crosses and circles, respectively) and over the entire data set (squares). The red line indicates a naive expectation of a 2-fold increase in signal-to-noise ratio.
Extended Data Figure 4
Extended Data Figure 4. Validation of signal in structure factors and difference maps
a–c, A negative correlation between ΔFhkl=ΔFhklON-ΔFhklOFF and ΔFh¯kl¯=ΔFh¯kl¯ON-ΔFh¯kl¯OFF is consistent with oppositely directed motions in the up and down states. Analysis is performed over 20 resolution bins to allow for statistical testing. Shown are the correlation coefficients per bin between ΔFhkl and ΔFh̄kl̄. In a linear response approximation and in the absence of measurement error, we expect ΔFhkl=−ΔFh̄kl̄. Reflections with |ΔFhkl| < σFhkl), |ΔFh̄kl̄| < σFh̄kl̄) or |ΔFhkl| > 10 were excluded from analysis, and likewise for ΔFh̄kl̄. Results at 50 ns (a), 100 ns (b) and 200 ns (c). To assess significance, each bin was considered statistically homogeneous, with observations considered independent. Bins with significant negative deviation from 0 (after Fisher Z-transform) are indicated as filled circles (P < 10−3: black; P < 10−2: light blue). Error bars indicate standard errors based on the assumption of a normal distribution after Fisher Z-transform. df, Statistical significance of Fig. 3g. Comparison of integrated absolute difference density above 2.5σ, within 1.5 Å of backbone C, N and O atoms (‘signal’; see also Fig. 3a). d, Comparison of signal in the OFF state and at 50 ns. The grey-shaded area indicates the 0–95th percentile for random sampling from the OFF map at the same probe volume (because the conformation of the backbone changes from residue to residue, the effective probe volume varies along the protein backbone) and threshold. The blue-shaded area indicates the 0–95th percentile for random sampling using the conservative sampling protocol described in test 4 of the statistical validation. e, Same analysis at 100 ns. f, Same analysis at 200 ns. Note that we were unable to scale all diffraction images at once, and instead scaled the OFF data with each time point separately. We compare each ON data set to the OFF data as scaled with that time point. As a result, there are small differences between the OFF traces in df. gj, Deviations from a normal distribution for internal difference maps. Shown are voxel histograms for internal difference electron density (DED) maps without applied field (OFF) (g), and at 50 ns (h), 100 ns (i) and 200 ns (j) of applied electric field. Red lines indicate fits to a normal distribution based on calculated variance. Blue lines are histograms of voxel internal DED values (map grids of 0.3 Å). Note that by construction, for internal DED maps the positive and negative sides of the histogram are the same, apart from discretization effects. To assess statistical significance of deviations from normality, we sampled C2 asymmetric units (ASUs) at the Nyquist sampling frequency (here, 0.9 Å). For the OFF map, we find no significant deviations from normality (P > 0.1 for the Jarque–Bera test, the Anderson–Darling test, and the Lilliefors test; all using default settings in Matlab). At 200 ns, each test rejects a normal distribution with P < 0.01. At 50 and 100 ns, the results of statistical testing depend on how the internal DED map is subsampled: for a single C2 ASU, none of the tests rejects the null hypothesis, but when the same number of points is sampled from two neighbouring ASUs, the Jarque–Bera test rejects normality (P < 0.01 at 50 and 100 ns), suggesting limited deviation from normality. k, l, Reproducibility of a structural response to electric field. Correlation of data set 2 (see Supplementary Table 7) to the data set presented in the text. On the basis of ordinary differences ΔFhkl (k) and internal differences ΔΔFhkl=(FhklON-Fh¯kl¯ON)-(FhklOFF-Fh¯kl¯OFF) (l), reflections with |ΔFhkl| < σFhkl)|, |ΔFh̄kl̄| < σFh̄kl̄), or |ΔFhkl| > 10 were excluded from analysis, and likewise for ΔFh̄kl̄. The standard error of correlation coefficient estimates is ~ 0.07 in k and ~ 0.10 in l. Each bin is statistically homogeneous and observations are considered independent. Resolution bins with significant positive deviation from 0 (after Fisher Z-transform) are indicated as filled circles (P < 10−3: black; P < 10−2: light blue).
Extended Data Figure 5
Extended Data Figure 5. Refinement, voltage-ON model at 200 ns
a, Progress of refinement against extrapolated structure factors. Rounds marked by asterisks involved automated refinement with mild stereochemistry constraints to reduce deviations from optimal geometry due to manual refinement in Coot. Fluctuations in Rwork appear to be mostly due to the PHENIX bulk solvent scaling calculation used in R factor calculation. b, R factor for comparison of extrapolated structure factors, as a function of the degree of extrapolation, N, as derived from data set 2 (150 ns; see Supplementary Table 7), against calculated structure factors (Fc) derived from (1) the OFF model (black), (2) the excited state model (ESM) (red), and (3) an ‘upside-down’ ESM obtained by 180° rotation around the C2 two-fold rotation axis (blue), all derived from data set 1 (Extended Data Table 2). N relates to the fraction f of OFF signal subtracted as N = 1/(1 − f). No refinement against data set 2 was performed except for bulk solvent scaling. No test set was assigned. c, For comparison, the same analysis as in b, comparing the OFF model and 200 ns ESM model to the 100 ns data (from the same crystal). df, Relationship between Cα displacements in the up and down conformations at 200 ns. d, e, Projection of the down displacement on the direction of the up displacement (d), and the up displacement on the down displacement direction (all displacements are relative to the OFF model (e); models were superimposed using PyMOL, using C, Cα and N atoms of the protein backbone and including only residues 338–356, 362–380, 384–408 and 412–419; this excludes N- and C-terminal regions and mobile parts of the β2–β3, α1–β4 and α2–β6 loops). Shown are, for example Δrdown · Δrup/||Δrup|| versus ||Δrup||, as illustrated in the inset. For small displacements, a simple inverse dependence is expected. This is tested by robust linear regression for (projected) displacements smaller than 0.4 Å (red line fits to data in grey boxes; using default settings in Matlab). d, Slope = − 0.80 ± 0.16, intercept = 0.081 ± 0.031 Å; correlation coefficient: − 0.44. e, Slope = − 0.41 ± 0.17, intercept = 0.012 ± 0.033 Å; correlation coefficient: − 0.27. f, Average cosine between displacements of nearby Cα atoms as a function of distance along the primary structure.
Extended Data Figure 6
Extended Data Figure 6. Additional views of conformational changes due to the electric field
a, Reference model indicating regions examined in bf. bf, Maps and models as in Fig. 4, with motions indicated by arrows and residues coupled to ligand binding in PDZ domains shown (as in Supplementary Table 1). b, Top view of the α1 helix, waters omitted and the side chain of Q377 truncated for clarity. c, Transverse shift of the α2–β6 loop, and perturbed down state of S410, forming new hydrogen bonds to R413 and N391 (dashed blue lines). d, Upward motion of the β2–β3 loop and change in dynamic disorder of protein and solvent. e, Conformational changes at the top of the ligand-binding pocket, with motion of the terminal amine of the K344 towards the ligand carboxylate group in the down state. f, Coupled rotameric changes of L402 (α2 helix), L395 and D394.
Extended Data Figure 7
Extended Data Figure 7. Biasing pre-existing conformational heterogeneity in the LNX2PDZ2 ground state structure by the external electric field: additional examples
a, b, A high-resolution (1.1 Å) room-temperature structure of the voltage-OFF ground state of LNX2PDZ2 (Extended Data Table 3), shows partial occupancy of N415 (a) and D368 (b) in two rotameric states (left). This pre-existing conformational equilibrium is biased in the presence of the electric field (6 kV, 200 ns delay), such that the up and down models each adopt one of the two ground state configurations (middle and right). This supports the result shown in Fig. 4g.
Figure 1
Figure 1. EF-X principles and implementation
a, A sampling of charged residues (in CPK colours) in LNX2PDZ2 (Protein Data Bank (PDB) accession 2VWR), exemplifying potential actuators for applied electric fields (E, in red). Ligand is in yellow. b, EF-X involves stimulation of motions in protein crystals by an applied electric field (E) of duration τ (the ‘pump’), and readout by much faster X-ray pulses (the ‘probe’). c, An LNX2PDZ2 crystal mounted across the orifice of a glass capillary, filled with crystallization solution and a metal electrode. The crystal is sealed onto the capillary by an electrically insulating glue. d, The crystal is mounted on the bottom electrode and the high voltage is delivered from a top electrode through a liquid junction composed of crystallization solution. Controlled back pressure on a reservoir of solution in the top electrode keeps the crystal continuously hydrated. e, A view of the assembled experimental apparatus.
Figure 2
Figure 2. An EF-X experiment in the LNX2PDZ2 domain
a, LNX2PDZ2 binds target ligands (in yellow) in a groove between the β2 and α2 segments. The binding site is coupled to allosteric sites on the β2–β3 segment and the α1–β4 segment (through the β1–β2 loop and α1 helix). b, Data collection involves four sequential X-ray exposures for each crystal orientation: no voltage (OFF), and three time delays (50, 100, 200 ns) after onset of the voltage pulse. One second is allowed between pulses for crystal cooling. HV, high voltage. c, The protocol in b is repeated for a series of crystal rotations to collect a full diffraction data set. d, LNX2PDZ2 crystallizes in the C2 space group, which includes two kinds of rotational symmetry (black symbols); this results in four molecules per unit cell and one molecule per asymmetric unit. e, With the electric field E (applied along the a dimension), all rotational symmetry is broken. This results in a new unit cell with two molecules per asymmetric unit (red and blue)—one experiencing + E, and one experiencing − E.
Figure 3
Figure 3. The up–down internal difference analysis
a, In the simplest case, the electric field will shift the electron density distribution for an atom in the up and down molecules (red and blue, respectively) in opposite directions around its centroid in the voltage-OFF molecule (grey) (left and middle). Subtracting the up and down densities and applying a noise threshold (right), we expect peaks of positive (red) and negative (blue) difference density surrounding an atom in the OFF state—the hallmark of an electric-field-induced motion. b, The up–down internal difference map for a ‘front’ view of LNX2PDZ2, with regions highlighted in cf boxed. The red three-dimensional arrow indicates the direction of the electric field, and bound ligand is in yellow. Maps are contoured at + 3.5 (red) and − 3.5 (blue) σOFF and, for clarity, are displayed within a 1.8 Å shell around main chain + Cβ atoms (see PyMOL session S1 for full map). cf, Examples of electric-field-induced motions—opposing red and blue density—for main-chain, side-chain and solvent atoms. g, The IADDAT for the up–down molecules as a function of LNX2PDZ2 primary structure and time (blue, green and red traces). The OFF difference density (black) indicates the noise in the analysis. The graphs above indicate buried residues (solvent accessibility < 0.15 (Solv. inaccess.)) and refined isotropic B-factor for the voltage-OFF model. a.u., arbitrary units. h, The time evolution of the electric-field-induced effects mapped on the tertiary structure of LNX2PDZ2. Spheres indicate Cα positions and colours IADDAT.
Figure 4
Figure 4. A gallery of electric field-induced structural effects
af, Refined models and associated 2FoFc electron density contoured at 1.5σ for the up (red) and down (blue) LNX2PDZ2 structures (6 kV, 200 ns delay); the direction of the electric field is indicated by the three-dimensional arrow. The data show examples of rotamer flips (H343; a), continuous displacements (H393; b), potentially coupled rotamer flips (R413, N415, L416; c), rearrangements of hydrogen bonding (S410; d), motions of secondary structure elements (the α1 helix; e), and complex combinations of these effects (f). Per sign convention, atoms coupled to a positive charge in the up model would move in the direction of the field and in the down model, against the field. Motions occur at solvent-exposed (ac, e) and -buried (d, f) regions (PyMOL sessions S2–S4 and Extended Data Fig. 6). g, S410 shows partial occupancy in two rotameric states (marked A and B) in a 1.1 Å room-temperature ground-state structure (OFF, Extended Data Table 3). These states are biased by the electric field such that the up and down models each adopt one of the two ground-state configurations (middle and right). Maps are contoured at 1.5σ. See Extended Data Fig. 7 for more examples.
Figure 5
Figure 5. The relationship between electric-field-induced conformational change and PDZ function
a, Two views of the electricfield-induced structural changes in LNX2PDZ2 (6 kV, 200 ns data set), with vectors representing the displacements of main-chain atoms transitioning from the up to down models (enlarged × 5 for clarity). The motions are most prominent in the β1–β2, β2–β3, α1 and α2–β6 regions. b, The mean displacements of backbone atoms per residue between the up and down states. c, Conserved motions of backbone atoms due to ligand binding (apo to liganded) in high-resolution structures of 11 diverse homologues of the PDZ family (vectors enlarged × 10). The motions occur in similar regions as in a, but also include the α2 helix. d, The protein sector (blue spheres), a group of coevolving amino acid positions in the PDZ protein family (PFAM 27.0 (ref. 39)); the sector connects the ligand-binding pocket to the β2–β3 segment and to the α1–β4 surface through the β1–β2 loop and the α1 helix. e, The median ligand-induced displacements of backbone atoms per residue (LNX2PDZ2 numbering) in the ensemble of 11 PDZ homologues. Statistical comparison with that for the up to down transition (b) shows a significant correlation (P < 0.001, Fisher Z-test).

References

    1. Alberts B. The cell as a collection of protein machines: preparing the next generation of molecular biologists. Cell. 1998;92:291–294. - PubMed
    1. Méndez J, Stillman B. Perpetuating the double helix: molecular machines at eukaryotic DNA replication origins. BioEssays. 2003;25:1158–1167. - PubMed
    1. Boehr DD, McElheny D, Dyson HJ, Wright PE. The dynamic energy landscape of dihydrofolate reductase catalysis. Science. 2006;313:1638–1642. - PubMed
    1. Noji H, Yasuda R, Yoshida M, Kinosita K., Jr Direct observation of the rotation of F1-ATPase. Nature. 1997;386:299–302. - PubMed
    1. Krishnamurthy H, Gouaux E. X-ray structures of LeuT in substrate-free outward-open and apo inward-open states. Nature. 2012;481:469–474. - PMC - PubMed

Publication types