

Cone Photoreceptor Irregularity on Adaptive Optics Scanning Laser Ophthalmoscopy Correlates With Severity of Diabetic Retinopathy and Macular Edema
- PMID: 27926754
- PMCID: PMC5152564
- DOI: 10.1167/iovs.16-19537
Cone Photoreceptor Irregularity on Adaptive Optics Scanning Laser Ophthalmoscopy Correlates With Severity of Diabetic Retinopathy and Macular Edema
Abstract
Purpose: To determine whether cone density, spacing, or regularity in eyes with and without diabetes (DM) as assessed by high-resolution adaptive optics scanning laser ophthalmoscopy (AOSLO) correlates with presence of diabetes, diabetic retinopathy (DR) severity, or presence of diabetic macular edema (DME).
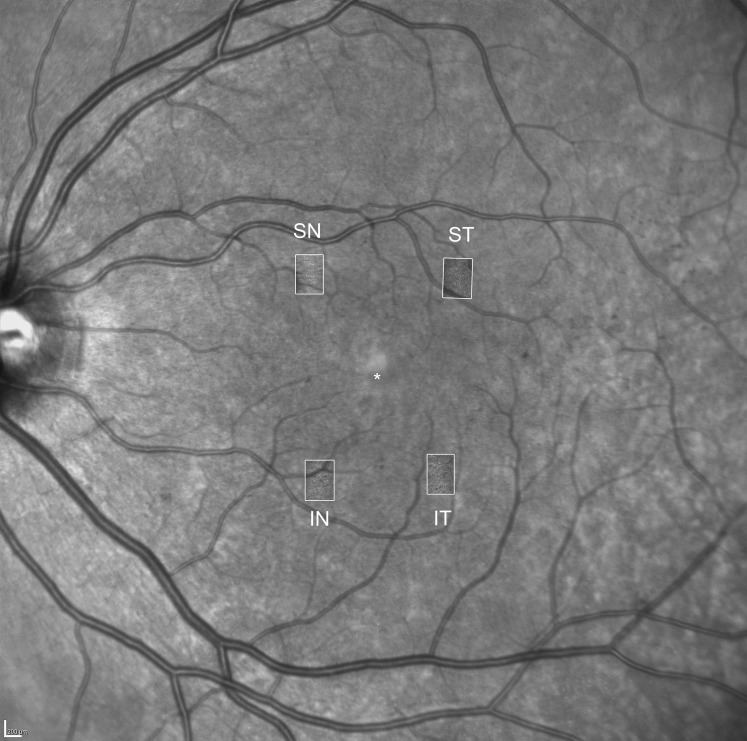
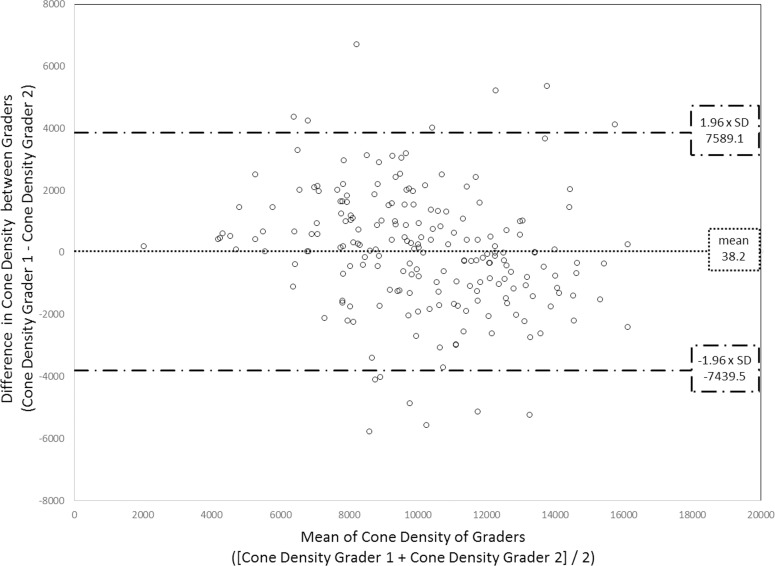
Methods: Participants with type 1 or 2 DM and healthy controls underwent AOSLO imaging of four macular regions. Cone assessment was performed by independent graders for cone density, packing factor (PF), nearest neighbor distance (NND), and Voronoi tile area (VTA). Regularity indices (mean/SD) of NND (RI-NND) and VTA (RI-VTA) were calculated.
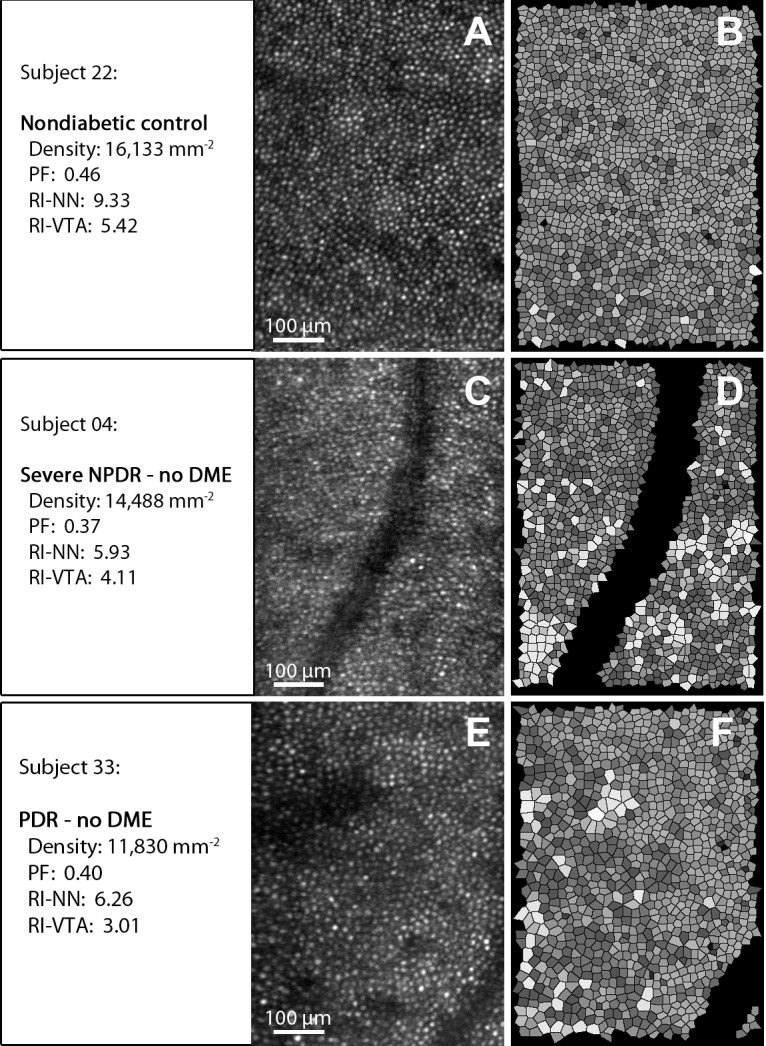
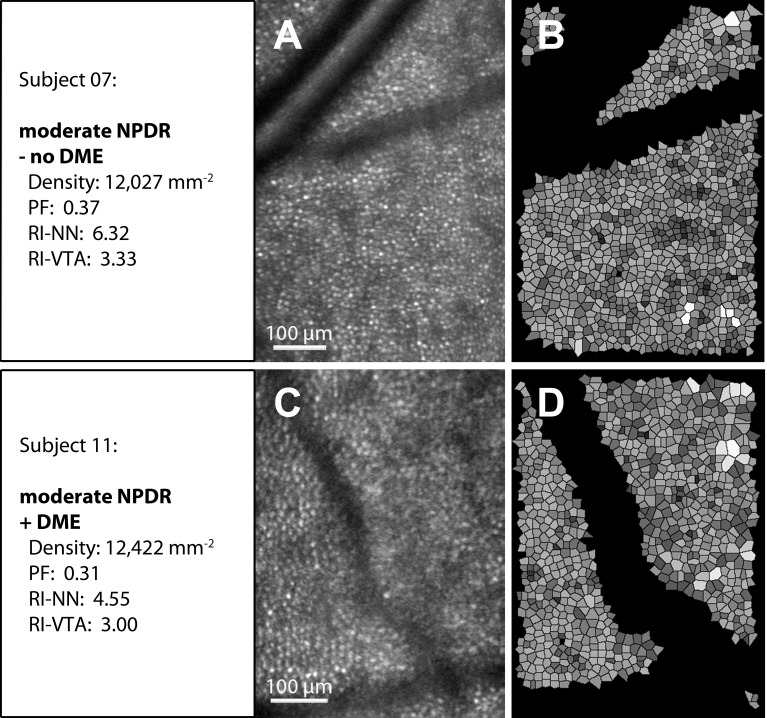
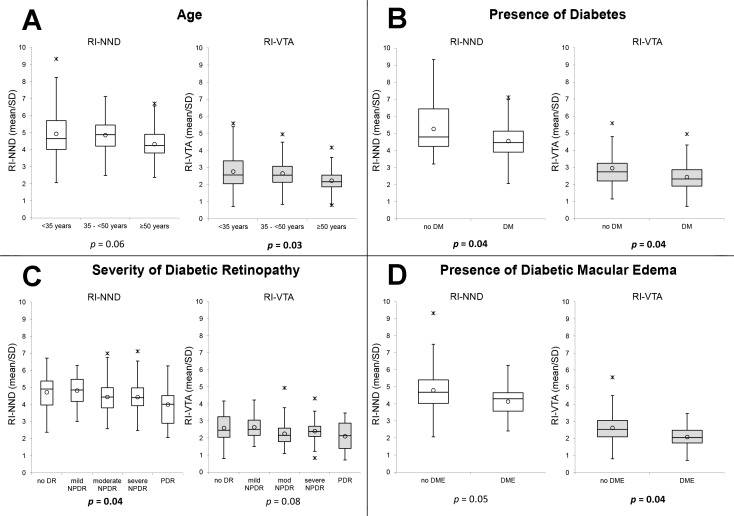
Results: Fifty-three eyes (53 subjects) were assessed. Mean ± SD age was 44 ± 12 years; 81% had DM (duration: 22 ± 13 years; glycated hemoglobin [HbA1c]: 8.0 ± 1.7%; DM type 1: 72%). No significant relationship was found between DM, HbA1c, or DR severity and cone density or spacing parameters. However, decreased regularity of cone arrangement in the macular quadrants was correlated with presence of DM (RI-NND: P = 0.04; RI-VTA: P = 0.04), increasing DR severity (RI-NND: P = 0.04), and presence of DME (RI-VTA: P = 0.04). Eyes with DME were associated with decreased density (P = 0.04), PF (P = 0.03), and RI-VTA (0.04).
Conclusions: Although absolute cone density and spacing don't appear to change substantially in DM, decreased regularity of the cone arrangement is consistently associated with the presence of DM, increasing DR severity, and DME. Future AOSLO evaluation of cone regularity is warranted to determine whether these changes are correlated with, or predict, anatomic or functional deficits in patients with DM.
Figures
References
-
- Early Treatment Diabetic Retinopathy Study Research Group. Grading diabetic retinopathy from stereoscopic color fundus photographs—an extension of the modified Airlie House Classification. ETDRS report number 10. Early Treatment Diabetic Retinopathy Study Research Group. Ophthalmology. 1991; 98: 786–806. - PubMed
-
- Wolter JR. Diabetic capillary microaneurysms of the retina. Arch Ophthalmol. 1961; 65: 847–854. - PubMed
-
- Bloodworth JMB. Diabetic retinopathy. Diabetes. 1962; 11: 1–22. - PubMed
-
- Swanson EA,, Izatt JA,, Hee MR,, et al. In vivo retinal imaging by optical coherence tomography. Opt Lett. 1993; 18: 1864–1866. - PubMed
Publication types
MeSH terms
Grants and funding
LinkOut - more resources
Full Text Sources
Other Literature Sources
Medical
