. 2017 Mar;102(3):562-572.
doi: 10.3324/haematol.2016.151100. Epub 2016 Dec 7.

T cells in chronic lymphocytic leukemia display dysregulated expression of immune checkpoints and activation markers

Affiliations

T cells in chronic lymphocytic leukemia display dysregulated expression of immune checkpoints and activation markers

Marzia Palma et al. Haematologica. 2017 Mar.

Abstract

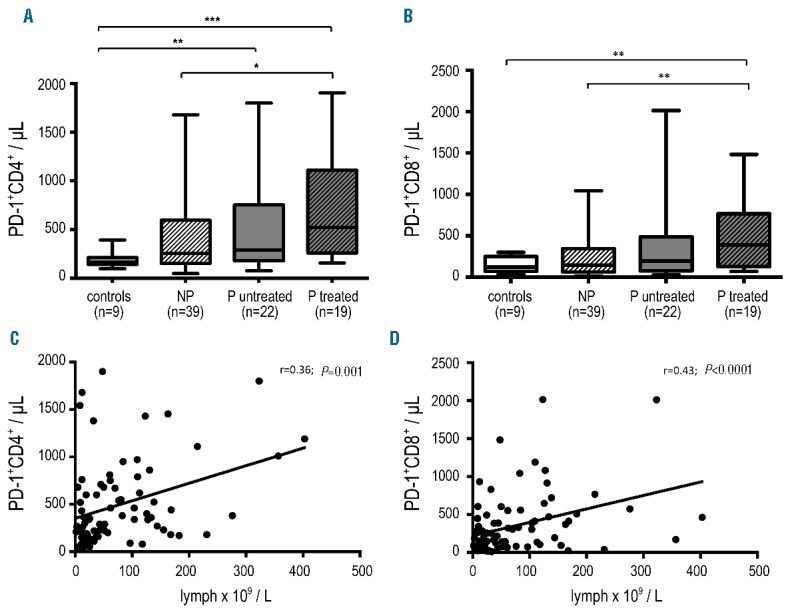
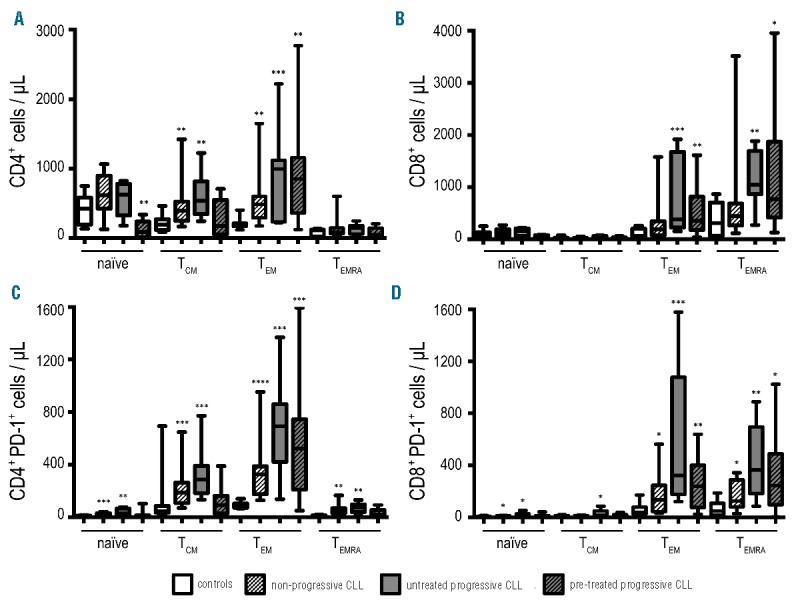
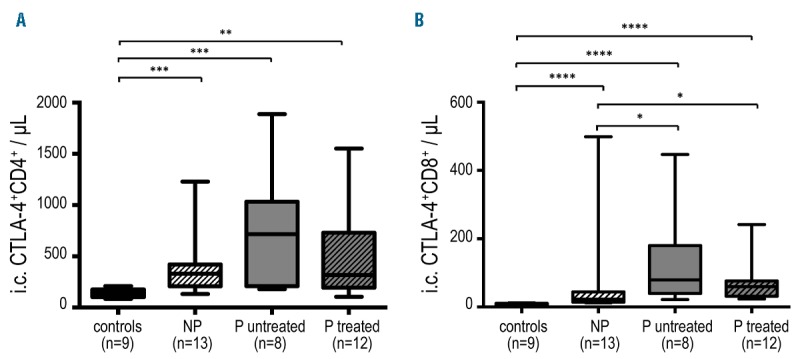
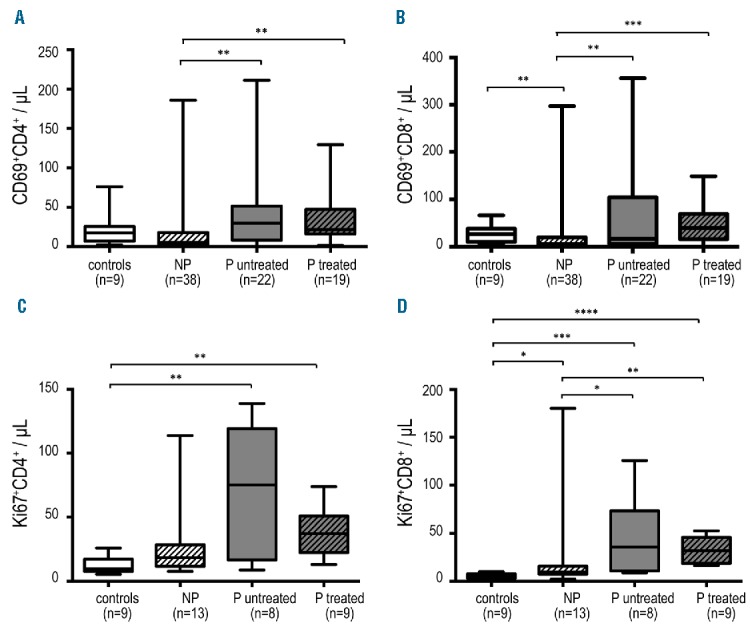
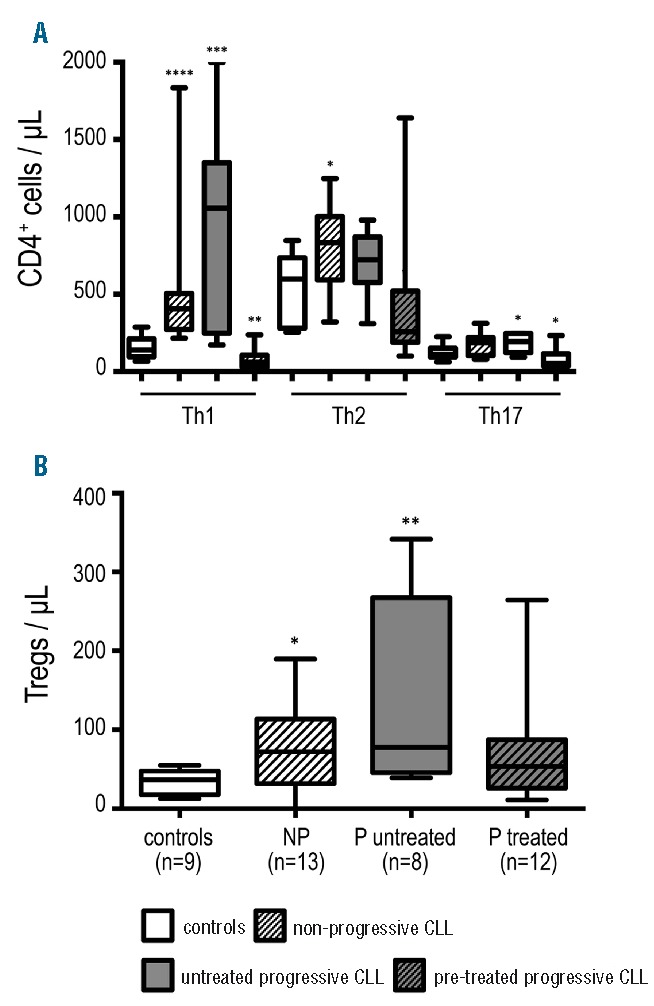
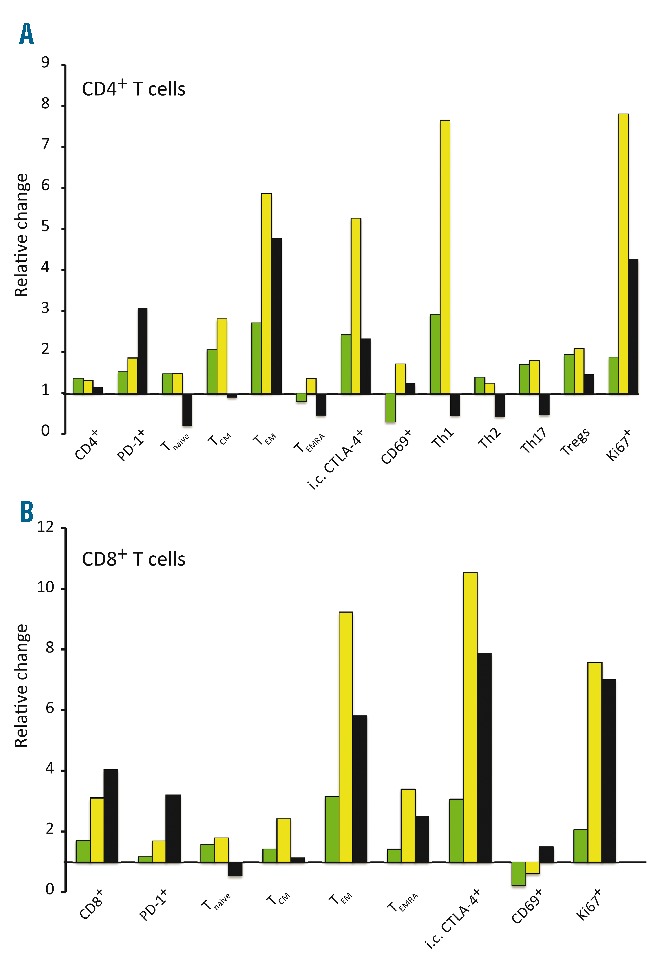
Chronic lymphocytic leukemia is characterized by impaired immune functions largely due to profound T-cell defects. T-cell functions also depend on co-signaling receptors, inhibitory or stimulatory, known as immune checkpoints, including cytotoxic T-lymphocyte-associated antigen-4 (CTLA-4) and programmed death-1 (PD-1). Here we analyzed the T-cell phenotype focusing on immune checkpoints and activation markers in chronic lymphocytic leukemia patients (n=80) with different clinical characteristics and compared them to healthy controls. In general, patients had higher absolute numbers of CD3+ cells and the CD8+ subset was particularly expanded in previously treated patients. Progressive patients had higher numbers of CD4+ and CD8+ cells expressing PD-1 compared to healthy controls, which was more pronounced in previously treated patients (P=0.0003 and P=0.001, respectively). A significant increase in antigen-experienced T cells was observed in patients within both the CD4+ and CD8+ subsets, with a significantly higher PD-1 expression. Higher numbers of CD4+ and CD8+ cells with intracellular CTLA-4 were observed in patients, as well as high numbers of proliferating (Ki67+) and activated (CD69+) CD4+ and CD8+ cells, more pronounced in patients with active disease. The numbers of Th1, Th2, Th17 and regulatory T cells were substantially increased in patients compared to controls (P<0.05), albeit decreasing to low levels in pre-treated patients. In conclusion, chronic lymphocytic leukemia T cells display increased expression of immune checkpoints, abnormal subset distribution, and a higher proportion of proliferating cells compared to healthy T cells. Disease activity and previous treatment shape the T-cell profile of chronic lymphocytic leukemia patients in different ways.


Figures

Figure 1.
Figure 1.
PD-1 expression in T cells from chronic lymphocytic leukemia (CLL) patients and controls. Absolute numbers of (A) PD-1+CD4+ and (B) PD-1+CD8+ T cells from progressive (P) and non-progressive (NP) CLL patients compared to controls. Box plots display cumulative data with line at median. *P<0.05, **P<0.005, ***P<0.0005. Correlation of (C) PD-1+CD4+ and (D) PD-1+CD8+ T cells with total lymphocyte count at the time of testing (n=80).
Figure 2.
Figure 2.
Comparative analysis of T-cell memory subsets in chronic lymphocytic leukemia (CLL) patients compared to controls. Absolute numbers of (A) CD4+, (B) CD8+, (C) CD4+PD-1+ and (D) CD8+PD-1+ naïve, central memory (CM), effector memory (EM) and effector (EMRA) cells in healthy controls (n=9) were compared to non-progressive (n=13), untreated progressive (n=8) and pre-treated progressive (n=12) CLL patients. Box plots display cumulative data with line at median. Only significant statistical values are reported. *P<0.05, **P<0.005, ***P<0.0005, ****P<0.0001.
Figure 3.
Figure 3.
Intracellular CTLA-4 expression in T cells from chronic lymphocytic leukemia (CLL) patients and controls. Absolute numbers of (A) CD4+ and (B) CD8+ T cells with intracellular (i.c.) CTLA-4 expression in CLL patients and controls. Box plots display cumulative data with line at median. Only significant statistical values are reported. NP: non-progressive; P: progressive. *P<0.05, **P<0.005, ***P<0.0005, ****P<0.0001.
Figure 4.
Figure 4.
CD69 and intracellular Ki67 expression in T cells from chronic lymphocytic leukemia (CLL) patients and controls. Absolute numbers of (A) CD69+CD4+, (B) CD69+CD8+, (C) Ki67+CD4+, (D) Ki67+CD8+ T cells from progressive (P) and non-progressive (NP) CLL patients and healthy controls. Box plots display cumulative data with line at median. Only significant statistical values are reported. *P<0.05, **P<0.005, ***P<0.0005, ****P<0.0001.
Figure 5.
Figure 5.
Comparative analysis of functional CD4+ T-helper subpopulations (Th1/Th2/Th17) and regulatory T cells (Tregs) in chronic lymphocytic leukemia (CLL) patients and controls. Absolute numbers of (A) Th1, Th2, Th17 and (B) Tregs cells in non-progressive (NP) (n=13), untreated progressive (P) (n=8), and pre-treated progressive (n=12) CLL patients compared with healthy controls (n=9). Box plots display cumulative data with line at median. Only significant statistical values are reported. *P<0.05, **P<0.005, ***P<0.0005, ****P<0.0001.
Figure 6.
Figure 6.
Relative change in absolute numbers of different T-cell subpopulations and T cells expressing immune checkpoints or activation / proliferation markers in chronic lymphocytic leukemia (CLL) patients compared to healthy controls. Relative change in the (A) CD4+ subset and (B) CD8+ subset calculated as median value patients/median value controls in non-progressive (green bars), untreated progressive (yellow bars) and pre-treated progressive (black bars) CLL patients.

References

    1. Mellstedt H, Choudhury A. T and B cells in B-chronic lymphocytic leukaemia: Faust, Mephistopheles and the pact with the Devil. Cancer Immunol Immunother. 2006;55(2):210–220. - PMC - PubMed
    1. Ramsay AG, Johson AJ, Lee AM, et al. Chronic lymphocytic leukemia T cells show impaired immunological synapse formation that can be reversed with an immunomodulating drug. J Clin Invest. 2008;118(7):2427–2437. - PMC - PubMed
    1. Riches JC, Davies JK, McClanahan F, et al. T cells from CLL patients exhibit features of T-cell exhaustion but retain capacity for cytokine production. Blood. 2013; 121(9):1612–1621. - PMC - PubMed
    1. D’Arena G, Laurenti L, Minervini MM, et al. Regulatory T-cell number is increased in chronic lymphocytic leukemia patients and correlates with progressive disease. Leuk Res. 2011;35(3):363–368. - PubMed
    1. Dasgupta A, Mahapatra M, Saxena R. A study for proposal of use of regulatory T cells as a prognostic marker and establishing an optimal threshold level for their expression in chronic lymphocytic leukemia. Leuk Lymphoma. 2015;56(6):1831–1838. - PubMed

Publication types

MeSH terms