. 2017 Mar 1;117(3):937-949.
doi: 10.1152/jn.00788.2016. Epub 2016 Dec 7.

Modeling microelectrode biosensors: free-flow calibration can substantially underestimate tissue concentrations

Affiliations

Modeling microelectrode biosensors: free-flow calibration can substantially underestimate tissue concentrations

Adam J H Newton et al. J Neurophysiol. .

Abstract

Microelectrode amperometric biosensors are widely used to measure concentrations of analytes in solution and tissue including acetylcholine, adenosine, glucose, and glutamate. A great deal of experimental and modeling effort has been directed at quantifying the response of the biosensors themselves; however, the influence that the macroscopic tissue environment has on biosensor response has not been subjected to the same level of scrutiny. Here we identify an important issue in the way microelectrode biosensors are calibrated that is likely to have led to underestimations of analyte tissue concentrations. Concentration in tissue is typically determined by comparing the biosensor signal to that measured in free-flow calibration conditions. In a free-flow environment the concentration of the analyte at the outer surface of the biosensor can be considered constant. However, in tissue the analyte reaches the biosensor surface by diffusion through the extracellular space. Because the enzymes in the biosensor break down the analyte, a density gradient is set up resulting in a significantly lower concentration of analyte near the biosensor surface. This effect is compounded by the diminished volume fraction (porosity) and reduction in the diffusion coefficient due to obstructions (tortuosity) in tissue. We demonstrate this effect through modeling and experimentally verify our predictions in diffusive environments.NEW & NOTEWORTHY Microelectrode biosensors are typically calibrated in a free-flow environment where the concentrations at the biosensor surface are constant. However, when in tissue, the analyte reaches the biosensor via diffusion and so analyte breakdown by the biosensor results in a concentration gradient and consequently a lower concentration around the biosensor. This effect means that naive free-flow calibration will underestimate tissue concentration. We develop mathematical models to better quantify the discrepancy between the calibration and tissue environment and experimentally verify our key predictions.

Keywords: biosensors; calibration; modeling.


Figures

Fig. 1.
Fig. 1.
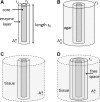
Schematic of the different model configurations. The biosensor electrode core has an outer radius of r1 and the biosensor enzyme layer extends from radii r1 to r2. The length of the biosensor is zb. A: calibration conditions. B: biosensor in agar, with the agar block extending out to a radius r3. C: biosensor in tissue, where the tissue is considered to be infinite in extent. Practically, this means extending out for a distance that is much greater than the tissue length constant ℓt (i.e., a few 100 μm) described in the related section in results. D: biosensor in tissue with a free-diffusion region caused by insertion damage extending from r2 to rs beyond which the tissue begins.
Fig. 2.
Fig. 2.
Model: calibration condition. Inset: experimental configuration. The enzyme layer is from a radii 25 to 50 μm. A: the steady-state analyte concentration sharply decreases from the surface for this diffusion-limited biosensor, so peak breakdown H2O2 production is at the biosensor surface. B: corresponding concentration profile for H2O2. C: the dynamics of the biosensor current demonstrating the rapid (<1 s) responsiveness. The bath concentration of analyte was Ac* = 1 μM with other parameters given in Table 1.
Fig. 3.
Fig. 3.
Model: biosensor in cylindrical agar block (see schematic inset) with the biosensor enzyme layer extending from radii 25 to 50 μm and the agar block from radii 50 to 150 μm. A: the steady-state analyte concentration exhibits a density gradient from the agar surface that is induced by breakdown within the biosensor enzyme layer. Inset: detail within the enzyme layer itself. B: corresponding concentration of H2O2. Note that H2O2 is lost through diffusion into the agar and then washed away. C: dynamics of the current response for the biosensor inserted into the bath (calibration condition) from 0 to 3 s into the agar from 3 to 18 s during which the density gradient builds up and finally back into the bath from 18 s onwards. The increase at the point of insertion into the agar is due to the transient increase in local H2O2 concentration, which was often seen in experiment (see Fig. 4).
Fig. 4.
Fig. 4.
Experiment: diffusive transport in agar markedly reduces the biosensor current. Two glucose biosensors, with almost identical sensitivities, were moved in and out of an agar block. Top: configurations of the 2 biosensors (black and grey) either above the agar block (free-flow conditions) or inserted into the agar. Bottom: the respective, superimposed current traces from top. Initially both biosensors were held in free-flow calibration conditions in the presence of 50 μM glucose (current of ∼2.5 nA). The first biosensor (black) was then fully inserted into the agar block. The current recorded dropped to ∼ 1.75/2.5 = 70% of its calibration value due to the establishment of the diffusion gradient. To verify the presence of the concentration gradient the second biosensor was then inserted close to the first. An initial rise due to a transient and localized increase in H2O2 can be seen, as predicted by the model (Fig. 3). The second biosensor steady-state signal was lower than that of the first biosensor previously; however, the first biosensor signal also dropped to the same lower value. These results are what would be expected if each biosensor established a density gradient of analyte and that these gradients superpose. On removal of the second biosensor from the agar the first biosensor recovered to the earlier steady current of ∼1.75 nA. Both biosensor signals returned to their calibration values when removed from the agar.
Fig. 5.
Fig. 5.
Model: biosensor in tissue. A: concentration of analyte and H2O2 in the biosensor enzyme layer. Note the same forms as Fig. 2. B: distribution of the analyte in tissue. A sharp decrease in density around the biosensor from the bulk value of 1 μM is apparent. C: time course of the biosensor current. The current is initially high but then decreases as the analyte around the biosensor is broken down and the density gradient is set up. In this particular example the biosensor measures a steady-state current equivalent to only ∼1.5% of the bulk tissue concentration. This mismatch is much greater than the case for agar, largely due to the instantaneous removal of H2O2 in this model of tissue.
Fig. 6.
Fig. 6.
Model: biosensor surrounded by a free-diffusion layer in tissue. A: concentrations of analyte and H2O2 in the biosensor enzyme layer. Here the functional forms of the concentration profiles differ from Fig. 2 due to the boundary conditions for H on the biosensor surface. B: the distributions of the analyte in tissue. C: time course of the biosensor current. In this example the biosensor measures a steady-state signal equivalent to only ∼ 2.5% of the concentration in tissue far from the biosensor. This is nevertheless less of a mismatch than for the model without a free space around the biosensor, in Fig 5. D: examination of the calibration mismatch as key parameters are varied; a: size of the free space rsr2; b: porosity αb of the biosensor enzyme layer; c: breakdown rate vb in biosensor; d: the radius r2 of the biosensor (with equal core radius and enzyme layer thickness); e: diffusion permeability θb in the biosensor enzyme layer; and f: breakdown rate vt in tissue. The parameters used in A–C are shown in grey.

References

    1. Baronas R, Kulys J, Lancinskas A, Zilinskas A. Effect of diffusion limitations on multianalyte determination from biased biosensor response. Sensors 14: 4634–4656, 2014. - PMC - PubMed
    1. Baronas R, Ivanauskas F, Kulys J. Mathematical Modeling of Biosensors: an Introduction for Chemists and Mathematicians. New York: Springer, 2009.
    1. Bélanger M, Allaman I, Magistretti PJ. Brain energy metabolism: focus on astrocyte-neuron metabolic cooperation. Cell Metab 14: 724–738, 2011. - PubMed
    1. Berti V, Vanzi E, Polito C, Pupi A. Back to the future: the absolute quantification of cerebral metabolic rate of glucose. Clin Trans Imaging 1: 289–296, 2013.
    1. Betz AL. Identification of hypoxanthine transport and xanthine oxidase activity in brain capillaries. J Neurochem 44: 574–579. - PubMed

Publication types

LinkOut - more resources