Review
. 2017 Jan;32(1):60-92.
doi: 10.1152/physiol.00062.2015.

Sleep Neurophysiological Dynamics Through the Lens of Multitaper Spectral Analysis

Affiliations
Review

Sleep Neurophysiological Dynamics Through the Lens of Multitaper Spectral Analysis

Michael J Prerau et al. Physiology (Bethesda). 2017 Jan.

Erratum in

Abstract

During sleep, cortical and subcortical structures within the brain engage in highly structured oscillatory dynamics that can be observed in the electroencephalogram (EEG). The ability to accurately describe changes in sleep state from these oscillations has thus been a major goal of sleep medicine. While numerous studies over the past 50 years have shown sleep to be a continuous, multifocal, dynamic process, long-standing clinical practice categorizes sleep EEG into discrete stages through visual inspection of 30-s epochs. By representing sleep as a coarsely discretized progression of stages, vital neurophysiological information on the dynamic interplay between sleep and arousal is lost. However, by using principled time-frequency spectral analysis methods, the rich dynamics of the sleep EEG are immediately visible-elegantly depicted and quantified at time scales ranging from a full night down to individual microevents. In this paper, we review the neurophysiology of sleep through this lens of dynamic spectral analysis. We begin by reviewing spectral estimation techniques traditionally used in sleep EEG analysis and introduce multitaper spectral analysis, a method that makes EEG spectral estimates clearer and more accurate than traditional approaches. Through the lens of the multitaper spectrogram, we review the oscillations and mechanisms underlying the traditional sleep stages. In doing so, we will demonstrate how multitaper spectral analysis makes the oscillatory structure of traditional sleep states instantaneously visible, closely paralleling the traditional hypnogram, but with a richness of information that suggests novel insights into the neural mechanisms of sleep, as well as novel clinical and research applications.


Conflict of interest statement

M.T.B. receives funding from the Department of Neurology, Massachusetts General Hospital, the Center for Integration of Medicine and Innovative Technology, the Milton Family Foundation, and the MGH-MIT Grand Challenge. M.T.B. has a pending patent on a sleep wearable device, received travel funds from Servier, served on the advisory board of Foramis, received research funding from MC10, Inc. and Insomnisolv, Inc., has consulting agreements with McKesson and with International Flavors and Fragrances, and has provided expert testimony in sleep medicine.

M.J.P. and P.L.P. have patents pending on the monitoring of sleep and anesthesia. M.T.B. has a patent pending for a sleep monitoring device.

Figures

FIGURE 1.
FIGURE 1.
Dynamic spectral analysis of sleep EEG provides a data-rich, high-resolution characterization of neural activity that is more informative than traditional visual sleep staging In clinical sleep polysomnography (PSG), EEG waveforms (A) from bilateral frontal (F1, F2), central (C1, C2), and occipital (O1, O2) electrodes are recorded along with other physiological signals. These signals are then visually scored by technicians who painstakingly categorize sleep into stages (wake, REM, stage N1–N3) in 30-s epochs, the progression of which is called a hypnogram (B). The multitaper sleep EEG spectrogram (C) takes only seconds to estimate and reveals patterns of oscillatory dynamics that correspond closely to the rough architecture of the hypnogram. The spectrogram shows spectral power (color: cool → warm::low → high power) as a function of time (x-axis) and frequency (y-axis). Furthermore, the multitaper spectrogram provides a visually striking characterization of the continuum of brain oscillatory activity during sleep, providing information that is lost in a typical hypnogram. Additionally, the multitaper sleep spectrogram can describe an entire night of sleep in a single visualization, whereas the EEG waveform trace of the same data (D) provides no detailed information at this scale.
FIGURE 2.
FIGURE 2.
The multitaper method outperforms conventional spectral estimators, producing high-resolution EEG spectrograms with significantly reduced bias and variance We estimated spectrograms from a single occipital EEG channel using periodogram-based frequency band averaging (A), single-taper Hanning window (B), and multitaper (C) approaches, each using 30-s windows spaced at 5-s intervals. In D, comparisons of spectra from each approach are shown using 30-s data windows from wake (marker A), NREM stage 2 (marker B), and NREM stage 3 (marker C) states. Below these spectra is a comparison of spectral power at 10 Hz for each method across time, illustrating differences in the temporal variability of each estimator. Traditional bands produce a low-resolution spectrogram (A) with coarse step-function spectra, but have low variability in power across time (D; black curves). Periodogram and single-taper spectrograms (B), while offering a high-frequency resolution, produce noisy spectra with ill-defined peaks and have a high temporal variability (D; gray curves). In contrast to these traditional approaches, the multitaper spectrogram (C) has a high-frequency resolution, shows clearly defined smooth oscillation peaks, and has low temporal variability (D; red curves).
FIGURE 3.
FIGURE 3.
An overview of spectral estimation for stationary and time-varying signals Spectral estimation using Fourier analysis assumes that any signal can be represented as the summation of multiple pure sine waves (A–C, top). For signals with stationary periodic structure (A), we can compute a single power spectrum (A, bottom), which represents strength of the signal at different frequencies. If the oscillatory structure of a signal is time-varying (B), we can compute a spectrogram (B, bottom) that tracks changes in the power spectrum over time. In practice, waveform EEG waveform data can be “corrupted” by other signals such as ECG and 60-Hz electrical noise (C, top), and may be discarded as an artifact. However, since these different signals occur at different frequencies, spectral analysis allows us to retain the data, viewing each signal independently in the time-frequency domain (C, bottom).
FIGURE 4.
FIGURE 4.
Multitaper spectral analysis reduces bias and variance in spectral estimation A: an illustration of periodogram bias and the effects of tapering, using a 10-Hz sinusoid as an example. In theory, infinite data (a) yields a theoretical ideal spectrum with widthless peaks at each frequency (b). In practice, the periodogram of finite data (d) is an inaccurate (biased) and noisy (variable) spectral estimator (e), with a multi-peaked structure caused by sharp discontinuities imposed by finite data (c). Tapering reduces bias by taking the product of the data and a “taper” function (f) that smooths the discontinuities at the data ends (g). In doing so, tapering reduces bias by lowering the power in the side lobes of the spectrum (h). B: a schematic of multitaper spectral estimation, which works by averaging multiple single-taper spectra that are computed using a special set of orthogonal functions. C: a comparison of spectral estimates for a simulated noisy EEG spectral peak. The multitaper spectrum shows a smooth peak with greatly reduced noise compared with periodogram and single-taper (Hanning window) estimates.
FIGURE 5.
FIGURE 5.
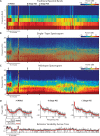
The multitaper sleep EEG spectrogram can clearly characterize the sleep oscillation architecture of a full night in a single visualization The technician-scored clinical hypnogram (top), and multitaper occipital sleep EEG spectrograms (bottom) are presented for three different subjects. In each case, the spectral dynamics within multitaper spectrograms correspond well with the hypnogram while also revealing the continuous oscillatory dynamics associated with the activity of specific cortical and subcortical networks during sleep.
FIGURE 6.
FIGURE 6.
The multitaper characterization of EEG spectral dynamics associated with quiescent sleep onset and active wakefulness During quiescent wakefulness as a subject falls asleep (A), a strong occipital oscillation in the alpha band appears when the eyes are closed, then gradually decreases before dropping out at the initiation of NREM sleep. Arousals throughout sleep are indicated by strong, transient alpha power. Active wakefulness (B) is associated with a variety of spectral patterns corresponding to different physiological states, including motion artifacts, which appear as strong broadband power. Motion artifacts are also hallmarks of arousals accompanied by motion during the night.
FIGURE 7.
FIGURE 7.
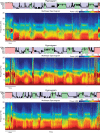
The multitaper characterization of EEG spectral dynamics associated with sleep onset and the continuous NREM progression into slow-wave sleep During the sleep-onset process, oscillation power in alpha gives way to a continuous progression into slow-wave sleep, with increasing delta and theta power and a rise and fall of sigma power. This gradual transition is clearly visible in the multitaper occipital spectrogram (A), as well as in the time domain traces (B). The transition into slow-wave sleep forms a spectral motif that is repeated after an arousal (C, markers 1 and 2). This progression can be reversed during the lightening of NREM sleep (C, marker 3), with a gradual reduction in delta and theta power, as well as a return of sigma power.
FIGURE 8.
FIGURE 8.
The multitaper spectrogram clearly represents spindles as distinct regions of transient spectral power A multi-scale visualization of the frontal EEG spectrogram shows spindles centered around a single frequency (A) in one subject, and “high” and “low ”spindles in another subject (B). By using the multitaper spectrogram, it can be much easier to disambiguate distinct overlapping spindles at different frequencies than in the time-domain traces (bottom).
FIGURE 9.
FIGURE 9.
The multitaper spectrogram represents K-complex activity as transient low-frequency power A multi-scale visualization of the spectrogram into the frontal EEG spectrogram shows the spectral signatures of K-complexes during the start of NREM.
FIGURE 10.
FIGURE 10.
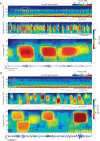
The multitaper characterization of EEG spectral dynamics associated with the REM sleep and transitional periods During the initiation of REM sleep, low-frequency power drops off, and background power increases. Additionally, transient occipital alpha bursting can be observed in NREM preceding and following the scored REM period. In A, the multitaper spectrogram shows the EEG spectral dynamics in the surrounding 1-h period of scored REM, with peri-REM alpha bursting visible in the occipital spectrogram. Eye movement occurs sporadically throughout scored REM. In a second subject, a shorter time scale (12 min) reveals the clear transient alpha power of the peri-REM bursts, which can continue many minutes after rapid eye movements have stopped. The time-domain waveform of a single peri-REM burst (B; bracket region) is shown in C.
FIGURE 11.
FIGURE 11.
The multitaper spectrogram can also characterize other biosignals such as muscle activity The chin EMG multitaper spectrogram (top) and time-domain trace (bottom) are shown for time periods surrounding scored Wake (A) and REM (B) epochs. Muscle activity during wakefulness has prolonged periods of high muscle tone, represented by persistent broadband power in the spectrogram, the power of which falls away during sleep onset. Transient low-powered muscle twitching is common during REM sleep, which is visible in short broadband bursts in the EMG spectrogram.
FIGURE 12.
FIGURE 12.
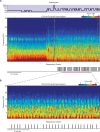
The multitaper spectrogram reveals extreme fragmentation of NREM during respiratory events In A, the hypnogram (top) occipital clinical multitaper sleep EEG spectrogram (middle) and the timing of technician-scored respiratory events (bottom) are shown for a subject with moderate to severe apnea (AHI: 27.9, RDI: 33.0). The multitaper spectrogram reveals a dramatic change during a series of respiratory (apnea and hypopnea) events occurring during NREM sleep. At the onset of the respiratory events, the low-frequency power typical of NREM becomes highly fragmented, with suppression and coincident reappearance of power in delta/theta, alpha, and sigma at each event.
FIGURE 13.
FIGURE 13.
The multitaper spectrogram quantitatively characterizes changes in sleep state that are too subtle to detect using the single-taper spectrogram A: the single-taper (Hanning) (top) and multitaper (bottom) spectrograms were computed for a single channel of occipital EEG during NREM, from which the spectra were extract from 2-min segments around early (marker A) and late (marker B) stage N2 sleep. B: a global acceptance bounds analysis of the single-taper spectrogram (top) showed no significant differences (green regions) between the two time periods, whereas the same analysis on the multitaper spectra (bottom) showed significant differences in frequency content in delta, alpha, sigma, and gamma power. C: in a second analysis, the single-taper (Hanning) (top) and multitaper (bottom) spectrograms were computed for a single channel of occipital EEG during REM, from which the spectra were extract from peri-REM burst times and non-burst times. D: a global acceptance bounds analysis of the single-taper spectrogram (top) shows no significant differences (green regions) between the burst and non-burst spectra, whereas the same analysis on the multitaper spectra (bottom) showed significant differences in frequency content low-alpha power. In these analyses, the observed difference in spectral power (magenta curves) is compared with global acceptance bands (black curves) constructed using the procedures outlined in Ref. . Contiguous points at which the observed spectral difference exceeds the global bounds are considered significantly different.
FIGURE 14.
FIGURE 14.
The experimental (A) and clinical (B) EEG electrode montages used for spectral estimation

References

    1. Adamantidis AR, Zhang F, Aravanis AM, Deisseroth K, De Lecea L. Neural substrates of awakening probed with optogenetic control of hypocretin neurons. Nature 450: 420–424, 2007. - PMC - PubMed
    1. Adrian E, Matthews BH. The Berger rhythm: potential changes from the occipital lobes in man. Brain 57: 355–385, 1934. - PubMed
    1. Adrian ED, Yamagiwa K. The origin of the Berger rhythm. Brain 58: 323–351, 1935.
    1. Aserinsky E, Kleitman N. Regularly occurring periods of eye motility, and concomitant phenomena, during sleep. Science 118: 273–274, 1953. - PubMed
    1. Astori S, Wimmer RD, Luthi A. Manipulating sleep spindles: expanding views on sleep, memory, and disease. Trends Neurosci 36: 738–748, 2013. - PubMed

Publication types