

Challenges in Species Tree Estimation Under the Multispecies Coalescent Model
- PMID: 27927902
- PMCID: PMC5161269
- DOI: 10.1534/genetics.116.190173
Challenges in Species Tree Estimation Under the Multispecies Coalescent Model
Abstract
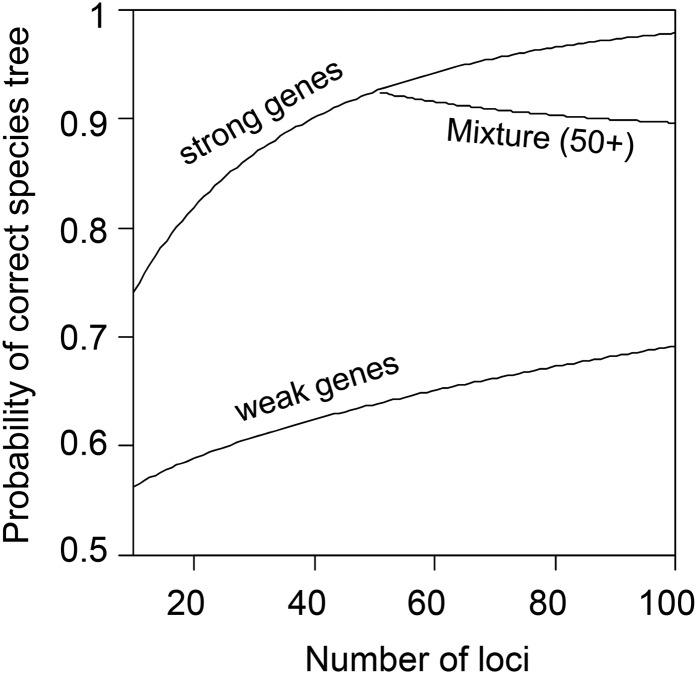
The multispecies coalescent (MSC) model has emerged as a powerful framework for inferring species phylogenies while accounting for ancestral polymorphism and gene tree-species tree conflict. A number of methods have been developed in the past few years to estimate the species tree under the MSC. The full likelihood methods (including maximum likelihood and Bayesian inference) average over the unknown gene trees and accommodate their uncertainties properly but involve intensive computation. The approximate or summary coalescent methods are computationally fast and are applicable to genomic datasets with thousands of loci, but do not make an efficient use of information in the multilocus data. Most of them take the two-step approach of reconstructing the gene trees for multiple loci by phylogenetic methods and then treating the estimated gene trees as observed data, without accounting for their uncertainties appropriately. In this article we review the statistical nature of the species tree estimation problem under the MSC, and explore the conceptual issues and challenges of species tree estimation by focusing mainly on simple cases of three or four closely related species. We use mathematical analysis and computer simulation to demonstrate that large differences in statistical performance may exist between the two classes of methods. We illustrate that several counterintuitive behaviors may occur with the summary methods but they are due to inefficient use of information in the data by summary methods and vanish when the data are analyzed using full-likelihood methods. These include (i) unidentifiability of parameters in the model, (ii) inconsistency in the so-called anomaly zone, (iii) singularity on the likelihood surface, and (iv) deterioration of performance upon addition of more data. We discuss the challenges and strategies of species tree inference for distantly related species when the molecular clock is violated, and highlight the need for improving the computational efficiency and model realism of the likelihood methods as well as the statistical efficiency of the summary methods.
Keywords: BPP; anomaly zone; concatenation; gene trees; incomplete lineage sorting; maximum likelihood; multispecies coalescent; species trees.
Copyright © 2016 by the Genetics Society of America.
Figures

Similar articles
-
Modern Phylogenomics: Building Phylogenetic Trees Using the Multispecies Coalescent Model.Methods Mol Biol. 2019;1910:211-239. doi: 10.1007/978-1-4939-9074-0_7. Methods Mol Biol. 2019. PMID: 31278666
-
To Include or Not to Include: The Impact of Gene Filtering on Species Tree Estimation Methods.Syst Biol. 2018 Mar 1;67(2):285-303. doi: 10.1093/sysbio/syx077. Syst Biol. 2018. PMID: 29029338
-
Coalescent-Based Analyses of Genomic Sequence Data Provide a Robust Resolution of Phylogenetic Relationships among Major Groups of Gibbons.Mol Biol Evol. 2018 Jan 1;35(1):159-179. doi: 10.1093/molbev/msx277. Mol Biol Evol. 2018. PMID: 29087487 Free PMC article.
-
Coalescent methods for estimating phylogenetic trees.Mol Phylogenet Evol. 2009 Oct;53(1):320-8. doi: 10.1016/j.ympev.2009.05.033. Epub 2009 Jun 6. Mol Phylogenet Evol. 2009. PMID: 19501178 Review.
-
Estimating phylogenetic trees from genome-scale data.Ann N Y Acad Sci. 2015 Dec;1360:36-53. doi: 10.1111/nyas.12747. Epub 2015 Apr 14. Ann N Y Acad Sci. 2015. PMID: 25873435 Review.
Cited by
-
Recombination Variation Shapes Phylogeny and Introgression in Wild Diploid Strawberries.Mol Biol Evol. 2023 Mar 4;40(3):msad049. doi: 10.1093/molbev/msad049. Mol Biol Evol. 2023. PMID: 36864629 Free PMC article.
-
Evolutionary Histories of Type III Polyketide Synthases in Fungi.Front Microbiol. 2020 Jan 21;10:3018. doi: 10.3389/fmicb.2019.03018. eCollection 2019. Front Microbiol. 2020. PMID: 32038517 Free PMC article.
-
StarBEAST2 Brings Faster Species Tree Inference and Accurate Estimates of Substitution Rates.Mol Biol Evol. 2017 Aug 1;34(8):2101-2114. doi: 10.1093/molbev/msx126. Mol Biol Evol. 2017. PMID: 28431121 Free PMC article.
-
Likelihood-Based Tests of Species Tree Hypotheses.Mol Biol Evol. 2023 Jul 5;40(7):msad159. doi: 10.1093/molbev/msad159. Mol Biol Evol. 2023. PMID: 37440530 Free PMC article.
-
Speciation in a biodiversity hotspot: Phylogenetic relationships, species delimitation, and divergence times of Patagonian ground frogs from the Eupsophus roseus group (Alsodidae).PLoS One. 2018 Dec 13;13(12):e0204968. doi: 10.1371/journal.pone.0204968. eCollection 2018. PLoS One. 2018. PMID: 30543633 Free PMC article.
References
-
- Allman E. S., Degnan J. H., Rhodes J. A., 2011. Identifying the rooted species tree from the distribution of unrooted gene trees under the coalescent. J. Math. Biol. 62: 833–862. - PubMed
-
- Burgess R., Yang Z., 2008. Estimation of hominoid ancestral population sizes under Bayesian coalescent models incorporating mutation rate variation and sequencing errors. Mol. Biol. Evol. 25: 1979–1994. - PubMed
Publication types
MeSH terms
LinkOut - more resources
Full Text Sources
Other Literature Sources
Miscellaneous
