. 2017 Jan 31;91(4):e01727-16.
doi: 10.1128/JVI.01727-16. Print 2017 Feb 15.

Influence of Plasma Cell Niche Factors on the Recruitment and Maintenance of IRF4hi Plasma Cells and Plasmablasts in Vaccinated, Simian Immunodeficiency Virus-Infected Rhesus Macaques with Low and High Viremia

Affiliations

Influence of Plasma Cell Niche Factors on the Recruitment and Maintenance of IRF4hi Plasma Cells and Plasmablasts in Vaccinated, Simian Immunodeficiency Virus-Infected Rhesus Macaques with Low and High Viremia

Julia M Shaw et al. J Virol. .

Abstract

In a recent study, we found that protection following simian immunodeficiency virus (SIV) exposure correlated with rectal plasma cell frequency in vaccinated female rhesus macaques. We sought to determine if the same macaques maintained high mucosal plasma cell frequencies postinfection and if this translated to reduced viremia. Although delayed SIV acquisition did not predict subsequent viral control, alterations existed in the distribution of plasma cells and plasmablasts between macaques that exhibited high or low viremia. Flow cytometric analysis of cells from rectal biopsy specimens, bone marrow, and mesenteric lymph nodes of vaccinated infected, unvaccinated infected, and uninfected macaques identified two main IRF4hi subsets of interest: CD138+ plasma cells, and CD138- plasmablasts. In rectal tissue, plasma cell frequency positively correlated with plasma viremia and unvaccinated macaques had increased plasma cells and plasmablasts compared to vaccinated animals. Likewise, plasmablast frequency in the mesenteric lymph node correlated with viremia. However, in bone marrow, plasmablast frequency negatively correlated with viremia. Accordingly, low-viremic macaques had a higher frequency of both bone marrow IRF4hi subsets than did animals with high viremia. Significant reciprocal relationships between rectal and bone marrow plasmablasts suggested that efficient trafficking to the bone marrow as opposed to the rectal mucosa was linked to viral control. mRNA expression analysis of proteins involved in establishment of plasma cell niches in sorted bone marrow and rectal cell populations further supported this model and revealed differential mRNA expression patterns in these tissues.

Importance: As key antibody producers, plasma cells and plasmablasts are critical components of vaccine-induced immunity to human immunodeficiency virus type 1 (HIV-1) in humans and SIV in the macaque model; however, few have attempted to examine the role of these cells in viral suppression postinfection. Our results suggest that plasmablast trafficking to and retention in the bone marrow play a previously unappreciated role in viral control and contrast the potential contribution of mucosal plasma cells to mediate protection at sites of infection with that of bone marrow plasmablasts and plasma cells to control viremia during chronic infection. Manipulation of niche factors influencing the distribution and maintenance of these critical antibody-secreting cells may serve as potential therapeutic targets to enhance antiviral responses postvaccination and postinfection.

Keywords: SIV rhesus macaque model; plasma cell; plasma cell niche factors; plasmablast.


Figures

FIG 1
FIG 1
Flow-cytometric analysis of rhesus macaque PB and PC. Single-cell suspensions from fresh macaque rectal pinch biopsy specimens, bone marrow, and MLNs were analyzed by flow cytometry. (A) Representative gating strategy depicting a large lymphocyte gate within which PB were identified as CD2 CD14 IgM CD20 IRF4hi CD138 and PC were identified as CD2 CD14 IgM CD20 IRF4hi CD138+. BM, bone marrow. (B and C) Comparison of (B) and correlation analyses between (C) PB and PC frequencies in rectal (n = 18, gray circles), bone marrow (n = 20, white circles), and MLN cells (n = 20, black circles) from SIV+ and SIV macaques. Rectal samples from animals R659 and R246 did not have sufficient cells postacquisition for reliable flow cytometry analysis. (D) Frozen bone marrow (n = 8; white squares, PB; white circles, PC) or MLN cells (n = 7; black squares, PB; black circles, PC) from SIV+ macaques identified with asterisks in Table 1 were analyzed for expression of markers associated with either a PB phenotype (top row) or a PC phenotype (bottom row). *, P < 0.05; **, P < 0.01, ****, P < 0.0001. PB and PC frequencies in panels B and C represent the averages for two separate staining assays performed side by side.
FIG 2
FIG 2
Comparison of fresh versus frozen PB and PC numbers in the bone marrow and MLN. The numbers of PB (left, squares) or PC (right, circles) per 106 live cells were determined by flow cytometry and compared in fresh and previously frozen samples (the latter are identified by an asterisk in Table 1) in bone marrow (white symbols) (A) and MLN (black symbols) (B). *, P < 0.05; **, P < 0.01. PB and PC numbers in fresh samples are presented as the averages for two separate staining assays performed side by side.
FIG 3
FIG 3
Geometric mean fluorescence intensity of Bcl-2 and frequency of CD40 in fresh and frozen PB and PC subsets. The GeoMFI of Bcl-2 (A) and expression of CD40 (C) in bone marrow PB (white squares) and PC (white circles) and GeoMFI of Bcl-2 (B) and expression of CD40 (D) in MLN PB (black squares) and PC (black circles) were determined by flow cytometry and compared in fresh and previously frozen samples (the latter are identified by an asterisk in Table 1). *, P < 0.05; **, P < 0.01. PB and PC numbers in fresh samples are presented as the averages for two separate staining assays performed side by side.
FIG 4
FIG 4
Tissue-specific distribution of retention and recruitment markers on macaque PB and PC. Freshly isolated cells from SIV+ and SIV macaques were examined for expression of various phenotypic markers associated with retention and recruitment of PB (squares) and PC (circles) between and within tissues (gray symbols, rectal tissue; white symbols, bone marrow; black symbols, MLN). *, P < 0.05; **, P < 0.01, ***, P < 0.001; ****, P < 0.0001. For the PB versus PC comparisons, ## and # indicate those that remain significant at P values of <0.001 and 0.025, respectively, after Hochberg correction. For the PB versus PB or PC versus PC comparisons between tissues, “%” indicates those that remain significant at P values of <0.05 after Bonferroni correction. PB and PC frequencies represent the averages for two separate staining assays performed side by side.
FIG 5
FIG 5
Influence of viral load and vaccination status on rectal, bone marrow, and MLN PB and PC frequencies. (A, B, E, G) Correlations between plasma viral load at necropsy and the number of challenges needed for infection of SIV-vaccinated macaques (A) or the frequency of PB (left, squares) and PC (right, circles) in rectal (B), bone marrow (E), or MLN (PB only) (G) of SIV+ macaques. (C) Frequency of rectal PB (left, gray squares) or PC (right, gray circles) in SIV+ versus SIV macaques. (D) Frequency of rectal PB (left, gray squares) or PC (right, gray circles) in SIV+ vaccinated (VACC; low- and high-viremic groups), high-viremic unvaccinated (UNVACC), and SIV macaques. (F and H) Frequency of PB (left, squares) or PC (right, circles) in bone marrow (F) and MLN (PB only) (H) of SIV+ low-viremic, high-viremic (vaccinated and unvaccinated groups) and SIV macaques. (I) Correlation between frequency of bone marrow and rectal PB in macaque groups: white triangles, low viral load vaccinated; black squares, high viral load vaccinated; white diamonds, high viral load unvaccinated. *, P < 0.05; **, P < 0.01. PB and PC frequencies in panels B to I represent the averages for two separate staining assays performed side by side. INF, infected; UNINF, uninfected.
FIG 6
FIG 6
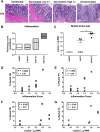
Inflammation and viral load in rectal tissues of SIV-infected and uninfected macaques. Frozen rectal tissue blocks from 12 macaques (n = 3 per group) were used for generating slides used for tissue staining and for the determination of tissue viral loads by NASBA. (A) One representative H&E stain of 3 frozen rectal tissue sections stained per group. Images are focused on the epithelial and lamina propria layers (magnification, ×10). (B) Twelve H&E-stained slides corresponding to 4 different macaque groupings (white bar, uninfected; horizontally striped bar, low viral load [v.l.] vaccinated; vertically striped bar, high viral load vaccinated; gray bar, high-viral-load unvaccinated macaques) were given a qualitative score of inflammation: 0.5 = none to minimal; 1.0 = minimal; 1.5 = mild; 2 = moderate. (C) Total RNA isolated from rectal tissue sections was used to quantify SIV RNA expressed in rectal tissues. Data are presented for SIV (white circles), SIV+ vaccinated low- and high-viremic groups (gray circles), and SIV+ unvaccinated macaques (black circles). (D and E) Correlations between inflammation score and rectal PB (gray squares) (D) or rectal PC (gray circles) (E). (F and G) Correlations between rectal viral load at necropsy and percentage of rectal PB (gray squares) (F) or percentage of rectal PC (gray circles) (G). *, P < 0.05.
FIG 7
FIG 7
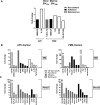
PC niche factors in the bone marrow and tissue-specific expression profiles of PC niche factors in bone marrow versus rectal mucosa during chronic SIV infection. Using a customized panel of PC niche factors (Table S1), mRNA expression analysis was performed on RNA isolated from sorted bone marrow or rectal cell populations representing either HLA-DR+ APC or HLA-DR PMN. (A) Fold changes in expression of niche factors present in bone marrow samples are presented as a ratio of SIVlow (APC fraction, n = 4; PMN fraction, n = 4) to SIVhigh (APC fraction, n = 12; PMN fraction, n = 12) macaques. Only RNAs with a fold change in expression of >2 and P value of <0.05 are listed. (B and C) Fold changes in expression of niche factors are presented as the ratio between SIV+ bone marrow samples (APC fraction, n = 16; PMN fraction, n = 16) to SIV+ rectal samples (APC fraction, n = 7; PMN fraction, n = 3) (B) or SIV+ rectal samples to SIV+ bone marrow samples (C). Only RNAs with a fold change in expression of >10 and P value of <0.05 are listed. Striped bars, gray bars, black bars, and white bars represent specific cell types or niche factors associated with recruitment, adhesion, and maintenance, respectively.

Similar articles

Cited by

References

    1. Slifka MK, Ahmed R. 1998. Long-lived plasma cells: a mechanism for maintaining persistent antibody production. Curr Opin Immunol 10:252–258. doi:10.1016/S0952-7915(98)80162-3. - DOI - PubMed
    1. Moser K, Tokoyoda K, Radbruch A, MacLennan I, Manz RA. 2006. Stromal niches, plasma cell differentiation and survival. Curr Opin Immunol 18:265–270. doi:10.1016/j.coi.2006.03.004. - DOI - PubMed
    1. Chu VT, Berek C. 2013. The establishment of the plasma cell survival niche in the bone marrow. Immunol Rev 251:177–188. doi:10.1111/imr.12011. - DOI - PubMed
    1. Manz RA, Thiel A, Radbruch A. 1997. Lifetime of plasma cells in the bone marrow. Nature 388:133–134. doi:10.1038/40540. - DOI - PubMed
    1. Di Niro R, Mesin L, Raki M, Zheng NY, Lund-Johansen F, Lundin KE, Charpilienne A, Poncet D, Wilson PC, Sollid LM. 2010. Rapid generation of rotavirus-specific human monoclonal antibodies from small-intestinal mucosa. J Immunol 185:5377–5383. doi:10.4049/jimmunol.1001587. - DOI - PubMed

Publication types

MeSH terms