

Gamma frequency entrainment attenuates amyloid load and modifies microglia
- PMID: 27929004
- PMCID: PMC5656389
- DOI: 10.1038/nature20587
Gamma frequency entrainment attenuates amyloid load and modifies microglia
Erratum in
-
Author Correction: Gamma frequency entrainment attenuates amyloid load and modifies microglia.Nature. 2018 Oct;562(7725):E1. doi: 10.1038/s41586-018-0351-4. Nature. 2018. PMID: 30046102
-
Author Correction: Gamma frequency entrainment attenuates amyloid load and modifies microglia.Nature. 2024 Dec;636(8042):E2. doi: 10.1038/s41586-024-08343-7. Nature. 2024. PMID: 39592835 No abstract available.
Abstract
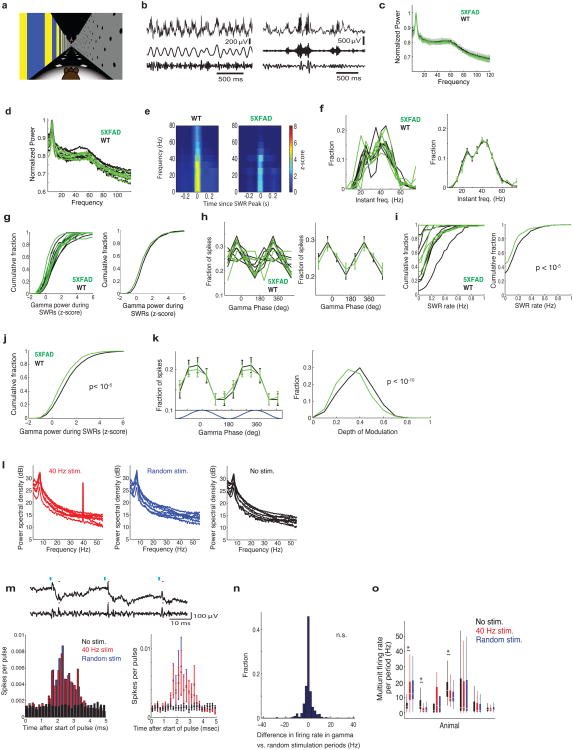
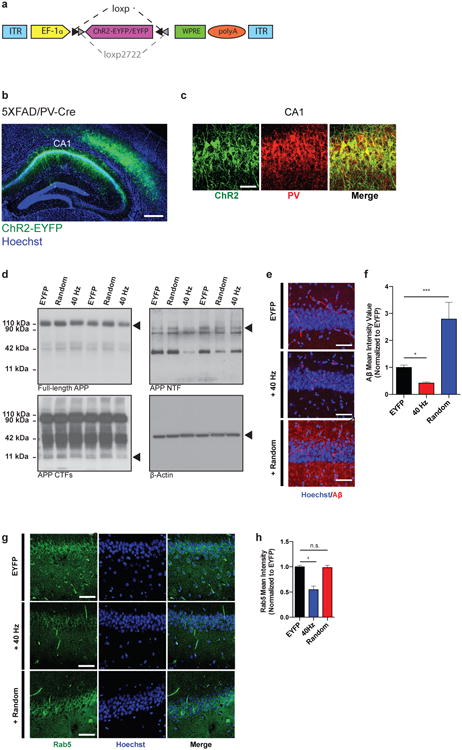
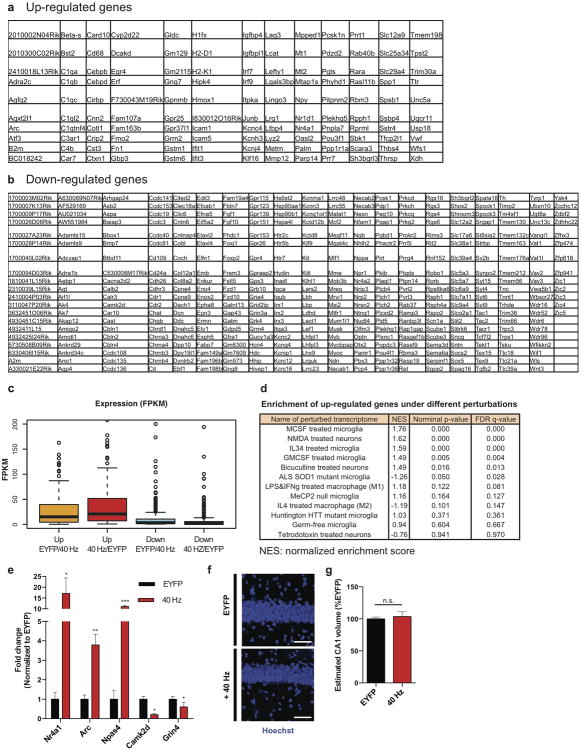
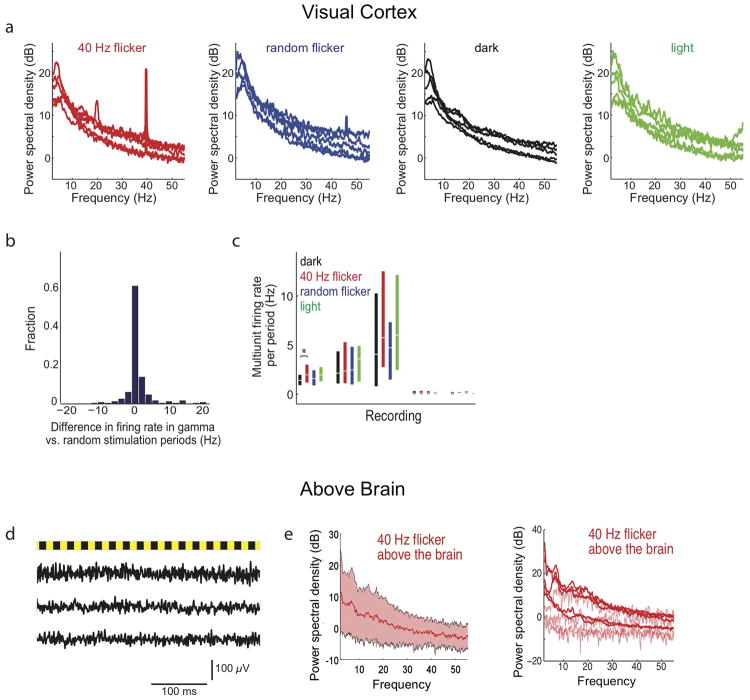
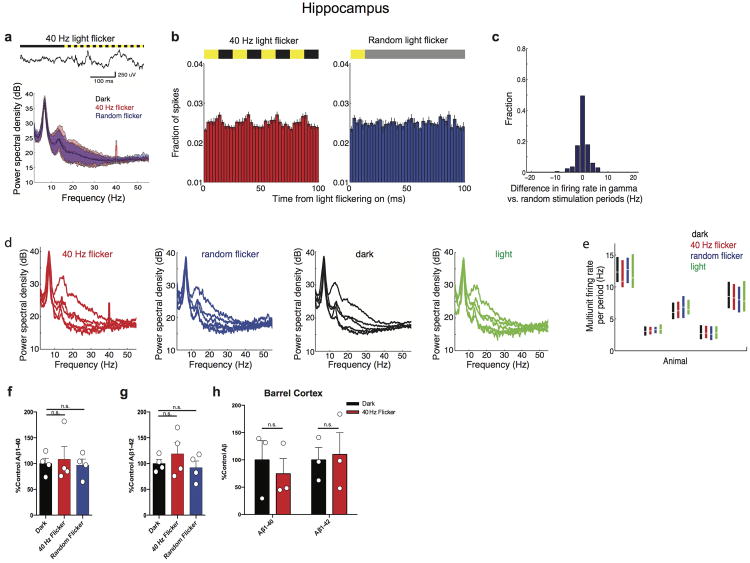
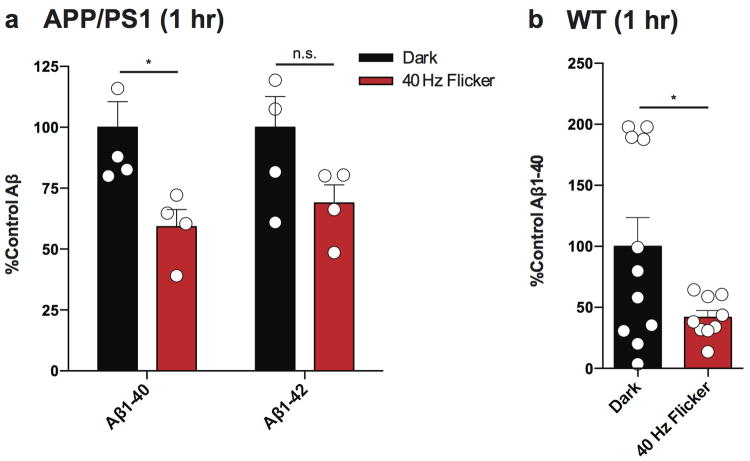
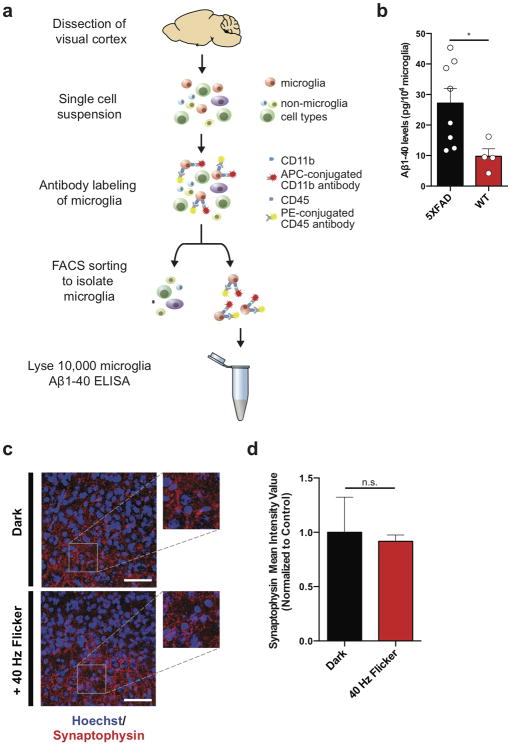
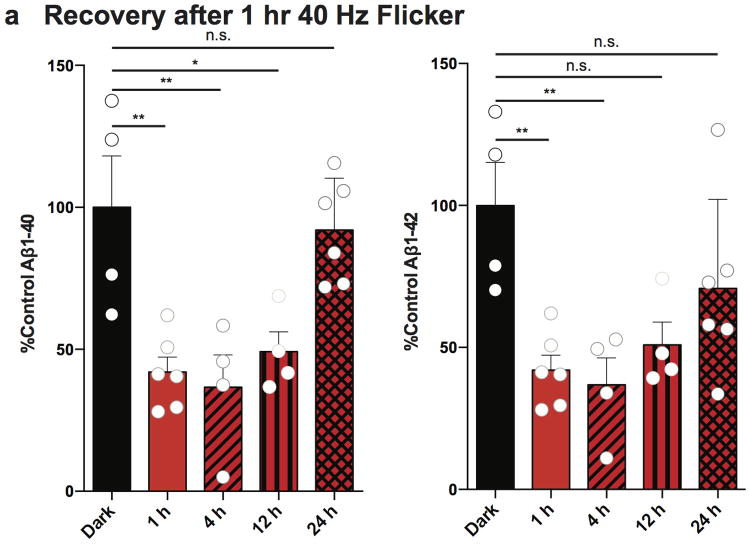
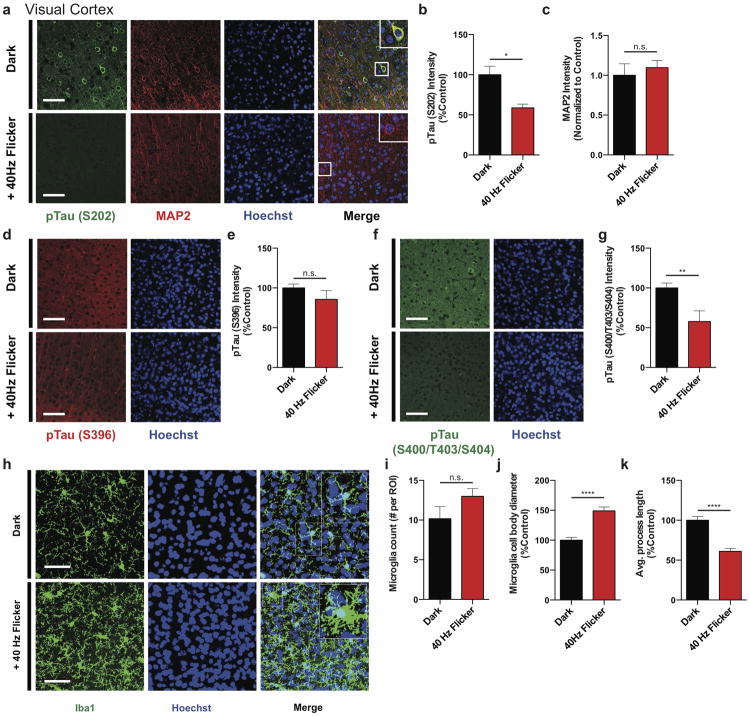
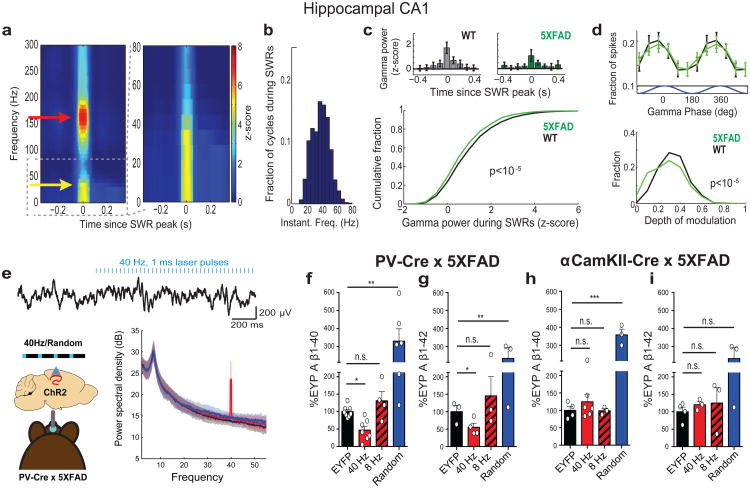
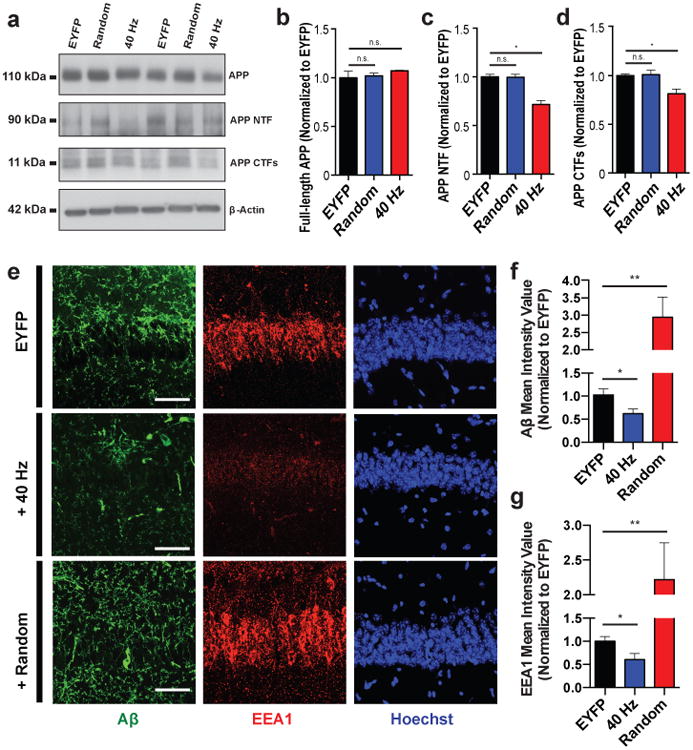
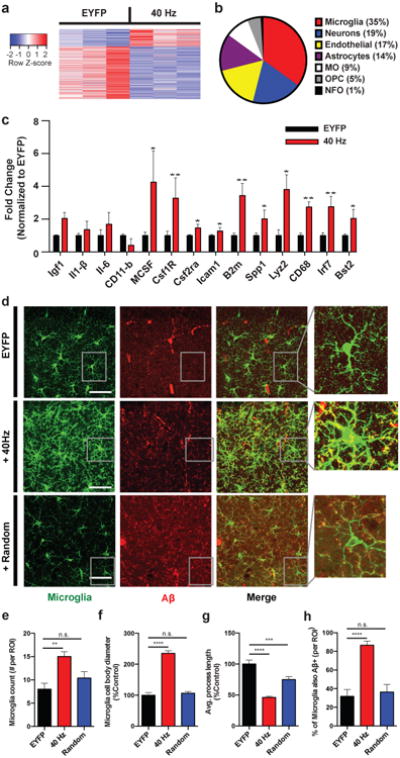
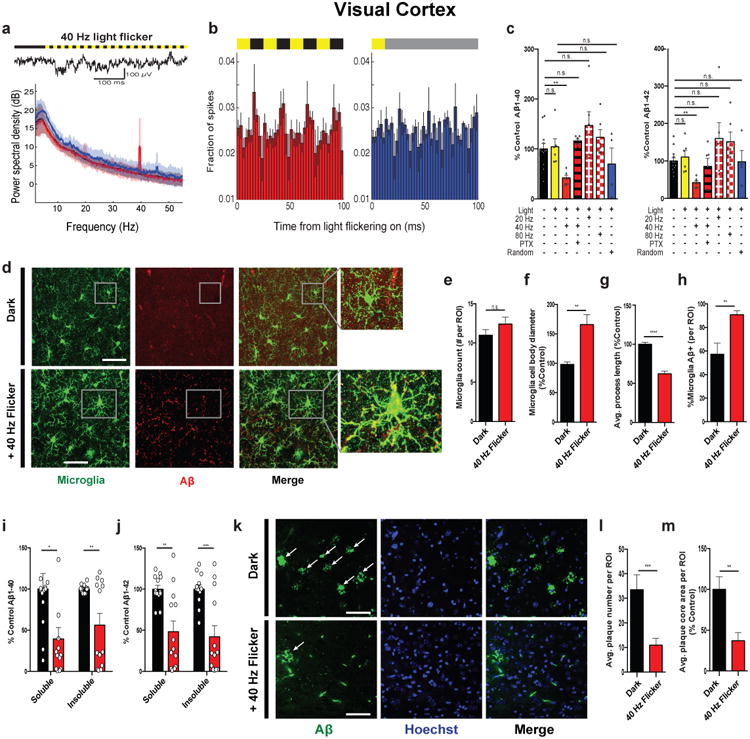
Changes in gamma oscillations (20-50 Hz) have been observed in several neurological disorders. However, the relationship between gamma oscillations and cellular pathologies is unclear. Here we show reduced, behaviourally driven gamma oscillations before the onset of plaque formation or cognitive decline in a mouse model of Alzheimer's disease. Optogenetically driving fast-spiking parvalbumin-positive (FS-PV)-interneurons at gamma (40 Hz), but not other frequencies, reduces levels of amyloid-β (Aβ)1-40 and Aβ 1-42 isoforms. Gene expression profiling revealed induction of genes associated with morphological transformation of microglia, and histological analysis confirmed increased microglia co-localization with Aβ. Subsequently, we designed a non-invasive 40 Hz light-flickering regime that reduced Aβ1-40 and Aβ1-42 levels in the visual cortex of pre-depositing mice and mitigated plaque load in aged, depositing mice. Our findings uncover a previously unappreciated function of gamma rhythms in recruiting both neuronal and glial responses to attenuate Alzheimer's-disease-associated pathology.
Figures
Comment in
-
Neurodegenerative disorders: Neural synchronization in Alzheimer's disease.Nature. 2016 Dec 7;540(7632):207-208. doi: 10.1038/540207a. Nature. 2016. PMID: 27929001 No abstract available.
References
Extended Data and Methods References
-
- Buzsaki G. Theta oscillations in the hippocampus. Neuron. 2002;33:325–340. - PubMed
Publication types
MeSH terms
Substances
Grants and funding
LinkOut - more resources
Full Text Sources
Other Literature Sources
Medical
Molecular Biology Databases
