

Multi-dimensional super-resolution imaging enables surface hydrophobicity mapping
- PMID: 27929085
- PMCID: PMC5155161
- DOI: 10.1038/ncomms13544
Multi-dimensional super-resolution imaging enables surface hydrophobicity mapping
Abstract
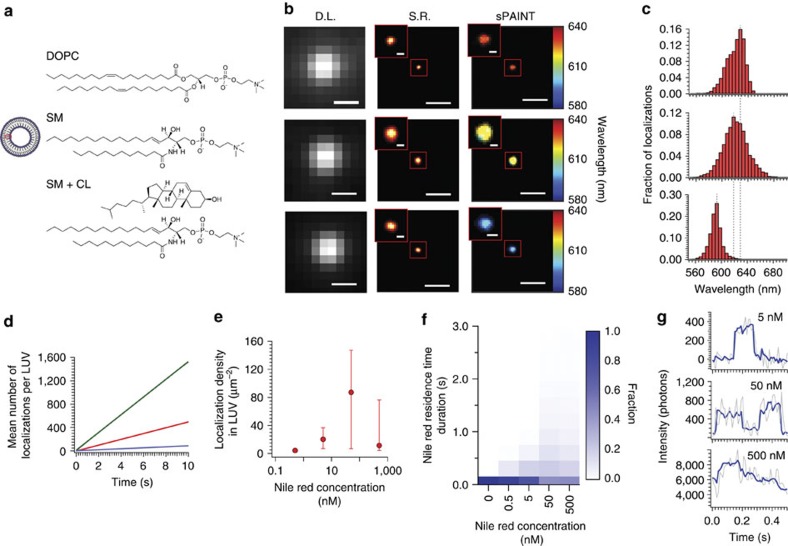
Super-resolution microscopy allows biological systems to be studied at the nanoscale, but has been restricted to providing only positional information. Here, we show that it is possible to perform multi-dimensional super-resolution imaging to determine both the position and the environmental properties of single-molecule fluorescent emitters. The method presented here exploits the solvatochromic and fluorogenic properties of nile red to extract both the emission spectrum and the position of each dye molecule simultaneously enabling mapping of the hydrophobicity of biological structures. We validated this by studying synthetic lipid vesicles of known composition. We then applied both to super-resolve the hydrophobicity of amyloid aggregates implicated in neurodegenerative diseases, and the hydrophobic changes in mammalian cell membranes. Our technique is easily implemented by inserting a transmission diffraction grating into the optical path of a localization-based super-resolution microscope, enabling all the information to be extracted simultaneously from a single image plane.
Figures


Similar articles
-
Spectrally Resolved and Functional Super-resolution Microscopy via Ultrahigh-Throughput Single-Molecule Spectroscopy.Acc Chem Res. 2018 Mar 20;51(3):697-705. doi: 10.1021/acs.accounts.7b00545. Epub 2018 Feb 14. Acc Chem Res. 2018. PMID: 29443498
-
Super-Resolution Mapping and Quantification of Molecular Diffusion via Single-Molecule Displacement/Diffusivity Mapping (SMdM).Acc Chem Res. 2025 Apr 15;58(8):1224-1235. doi: 10.1021/acs.accounts.4c00850. Epub 2025 Apr 4. Acc Chem Res. 2025. PMID: 40183356
-
Fluorescent Probes for Lipid Membranes: From the Cell Surface to Organelles.Acc Chem Res. 2023 Jan 3;56(1):1-12. doi: 10.1021/acs.accounts.2c00586. Epub 2022 Dec 19. Acc Chem Res. 2023. PMID: 36533992
-
[Comparison and progress review of various super-resolution fluorescence imaging techniques].Se Pu. 2021 Oct;39(10):1055-1064. doi: 10.3724/SP.J.1123.2021.06015. Se Pu. 2021. PMID: 34505427 Free PMC article. Review. Chinese.
-
When Super-Resolution Localization Microscopy Meets Carbon Nanotubes.Nanomaterials (Basel). 2022 Apr 22;12(9):1433. doi: 10.3390/nano12091433. Nanomaterials (Basel). 2022. PMID: 35564142 Free PMC article. Review.
Cited by
-
Visualizing the Heterogeneity in Homogeneous Supramolecular Polymers.J Am Chem Soc. 2024 Jul 24;146(29):19974-19985. doi: 10.1021/jacs.4c03562. Epub 2024 Jul 10. J Am Chem Soc. 2024. PMID: 38986035 Free PMC article.
-
RainbowSTORM: an open-source ImageJ plug-in for spectroscopic single-molecule localization microscopy (sSMLM) data analysis and image reconstruction.Bioinformatics. 2020 Dec 8;36(19):4972-4974. doi: 10.1093/bioinformatics/btaa635. Bioinformatics. 2020. PMID: 32663240 Free PMC article.
-
Three-dimensional biplane spectroscopic single-molecule localization microscopy.Optica. 2019 Jun 20;6(6):709-715. doi: 10.1364/optica.6.000709. Epub 2019 May 23. Optica. 2019. PMID: 36688951 Free PMC article.
-
Super-resolution Microscopy for Nanomedicine Research.ACS Nano. 2019 Sep 24;13(9):9707-9712. doi: 10.1021/acsnano.9b05289. Epub 2019 Aug 19. ACS Nano. 2019. PMID: 31424198 Free PMC article.
-
Microgel PAINT - nanoscopic polarity imaging of adaptive microgels without covalent labelling.Chem Sci. 2019 Sep 20;10(44):10336-10342. doi: 10.1039/c9sc03373d. eCollection 2019 Nov 28. Chem Sci. 2019. PMID: 32110321 Free PMC article.
References
-
- Betzig E. et al.. Imaging intracellular fluorescent proteins at nanometer resolution. Science 313, 1642–1645 (2006). - PubMed
-
- Hell S. W. & Wichmann J. Breaking the diffraction resolution limit by stimulated emission: stimulated-emission-depletion fluorescence microscopy. Opt. Lett. 19, 780–782 (1994). - PubMed
-
- Widengren J. et al.. Single-molecule detection and identification of multiple species by multiparameter fluorescence detection. Anal. Chem. 78, 2039–2050 (2006). - PubMed
-
- Bossi M. et al.. Multicolor far-field fluorescence nanoscopy through isolated detection of distinct molecular species. Nano Lett. 8, 2463–2468 (2008). - PubMed
Publication types
Grants and funding
LinkOut - more resources
Full Text Sources
Other Literature Sources
