. 2016 Dec 8:6:38635.
doi: 10.1038/srep38635.

Glymphatic solute transport does not require bulk flow

Affiliations

Glymphatic solute transport does not require bulk flow

Mahdi Asgari et al. Sci Rep. .

Abstract

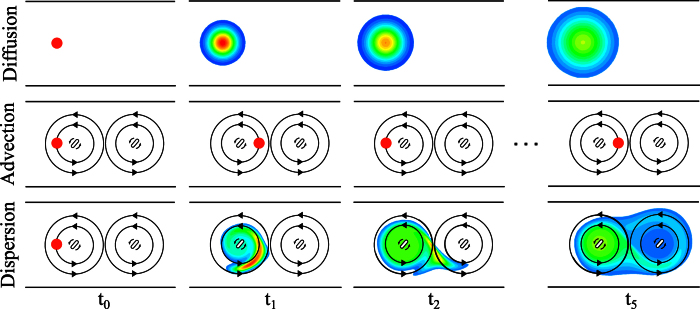
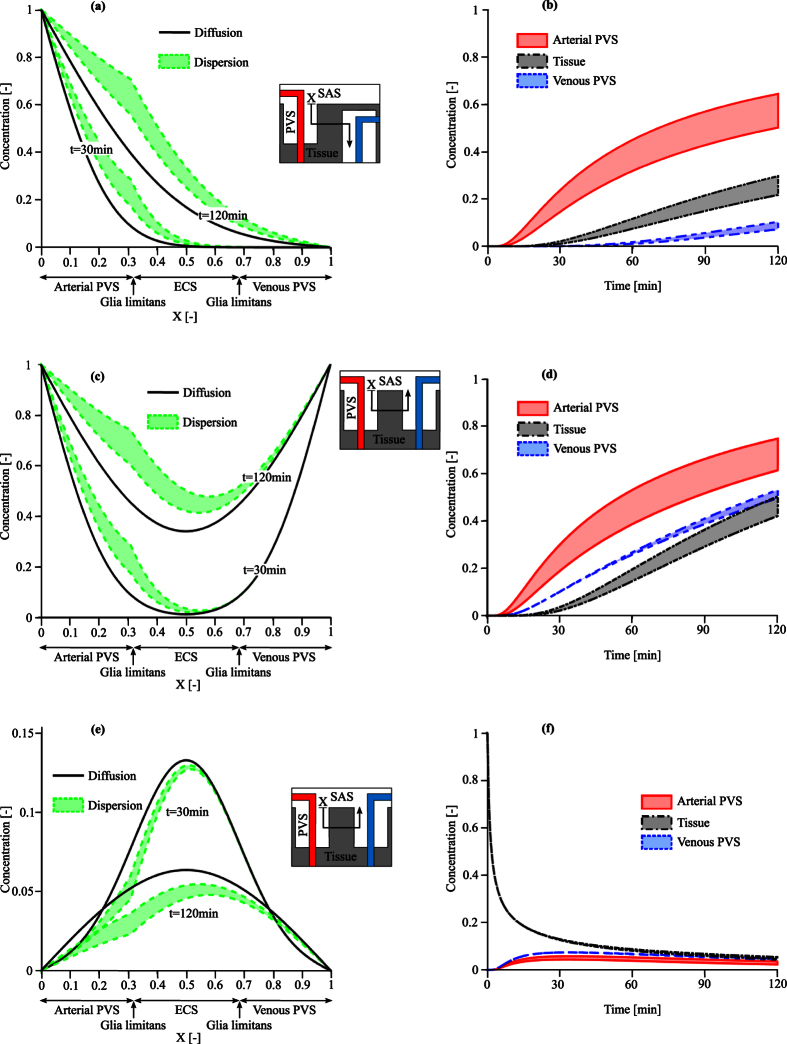
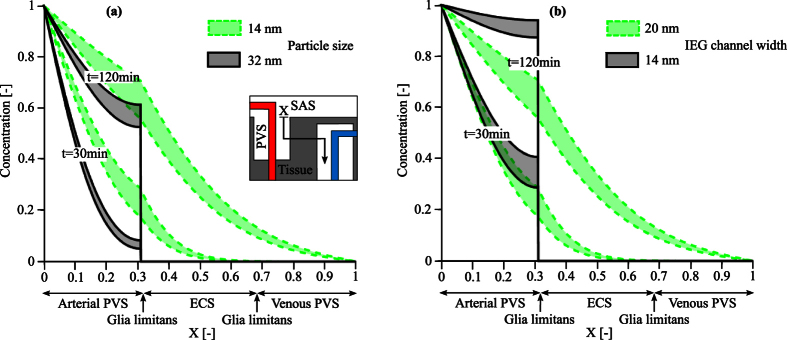
Observations of fast transport of fluorescent tracers in mouse brains have led to the hypothesis of bulk water flow directed from arterial to venous paravascular spaces (PVS) through the cortical interstitium. At the same time, there is evidence for interstitial solute transport by diffusion rather than by directed bulk fluid motion. It has been shown that the two views may be consolidated by intracellular water flow through astrocyte networks combined with mainly diffusive extracellular transport of solutes. This requires the presence of a driving force that has not been determined to date, but for which arterial pulsation has been suggested as the origin. Here we show that arterial pulsation caused by pulse wave propagation is an unlikely origin of this hypothetical driving force. However, we further show that such pulsation may still lead to fast para-arterial solute transport through dispersion, that is, through the combined effect of local mixing and diffusion in the para-arterial space.


Conflict of interest statement

The authors declare no competing financial interests.

Figures

Figure 1
Figure 1. Illustration of the differences between solute transport by diffusion, advection and dispersion in the absence of net flow.
In this hypothetical setup, which is not meant to represent paravascular transport, a drop of solute (red circle) is injected into a fluid filled channel at time t0 (left column). In the top row, the fluid is still and the solute may solely be transported by diffusion, whereas in the two other conditions (advection, middle row, and dispersion, bottom row), two stir bars rotating counterclockwise induce a continuous fluid motion with zero net flow. The temporal evolution of the solute concentration (red: high, blue: low concentration, white: no solute) is illustrated in the following columns at equally spaced time points, ti= 0…5. Pure diffusion leads to slow solute transport. Advection by itself moves the solute much faster, but, in absence of any diffusion, confines the drop to the influence region of the first stir bar. In contrast, the combined effects of advection and diffusion, i.e. dispersion, result in fast solute transport from left to right, even though there is no (time-averaged) net flow of the liquid.
Figure 2
Figure 2. Schematic of cerebral arterial and venous paravascular spaces.
The arterial PVS extends from the subarachnoid space (SAS) and follows the penetrating vessel into the tissue. This space is restricted on the one side by the vascular wall (endothelial and smooth muscle cells) and on the other side by the glia limitans. Glial endfeet processes almost completely cover the PVS of the larger vessels. The glia limitans of the arterial PVS is attached to the pia matter that extends from the SAS into the parenchyma. The inset shows the section of the arterial PVS retained for the axisymmetric computational model domain.
Figure 3
Figure 3. Fluid motion induced by vascular pulsation in a representative segment of arterial PVS of 150 μm length and 10 μm width.
(a) Illustration of instantaneous flow field in the segment at the beginning of the pulsation cycle as shown in panel d. Depicted are streamlines and velocity vectors color coded according to velocity magnitude. While the highest speed shown in this figure is 120 μm/s, the maximum value reached throughout the cycle is 276 μm/s. (b) Flow rate induced by physiologic arterial pulsation measured at plane Q indicated in panel a. While instantaneous flow rates of up to 1590 μm3/s are observed, the net flow rate averaged over one cycle is only 0.372 μm3/s. (c) Flow rate induced by an artificial, asymmetric distension wave as shown in panel e. This wave was derived from the physiologic one shown in panel d by setting all negative displacements to zero. The goal was to obtain the highest possible flow rate without changing the wave amplitude, frequency and length. The net flow rate measured at plane Q is 1.179 μm3/s, thus still very small.
Figure 4
Figure 4. Transport of solutes in the arterial PVS in the presence (green lines and symbols) and absence (black lines and symbols) of arterial pulsation.
Solutes with diffusion coefficients of 2 · and 10 · 10−12 m2/s are considered (circles and squares, respectively). Symbols show the concentration profiles obtained from the 3D axisymmetric simulations 10 seconds after the entrance of solutes from the arterial PVS-SAS interface at X = 0. Lines illustrate the best fit curves obtained for the diffusion (continuous black lines) and dispersion (dotted green lines) cases. As dispersion effects depend on domain length, dispersion results are reported for a bifurcation-free arteriole segment length spanning 150 μm (lower bound of the shaded area) to 250 μm (upper bound). The effect of arterial pulsation can be approximated by the analytical solution of the dispersion equation (equation (5)) without having to account for pulsation explicitly. Corresponding dispersion curves (dotted lines) obtained using dispersion coefficients of 3.5 · and 4.2 · 10−12 m2/s (lower and upper green circles) and 12.7 · and 17.0 · 10−12 m2/s (lower and upper green squares) accurately reproduce the effect of pulsation (coefficient of determination: R2 > 0.99).
Figure 5
Figure 5
Solute transport in the brain for particles of 14 nm size (Dextran 70) with a diffusion coefficient of 6 · 10−12 m2/s under three different injection scenarios: (a,b) Case A, cisternal injection with a concentration gradient between arterial and venous PVS interfaces, (c,d) Case B, cisternal injection with no concentration gradient, and (e,f) Case C, interstitial injection. Left column: comparison of the concentration profiles at 30 and 120 mins with dispersion and pure diffusion. Dispersion results (colored bands) represent a range of plausible dispersion coefficients as reported in Table 2. Right column: Time evolution of the solute concentration due to dispersion in the arterial PVS (at X = 0.3), ECS (X = 0.5), and venous PVS (X = 0.7).
Figure 6
Figure 6
Spatial and temporal distribution of the solute concentrations in the brain (a) for two different particle sizes, 14 and 32 nm, respectively, assuming an IEG width of 20 nm (b) and for the 14 nm particle under the effect of IEG width reduction from 20 nm to 14 nm. Results represent a range of plausible dispersion coefficients as reported in Table 2. In both cases, the particles enter the arterial PVS from the arterial PVS-SAS interface. While in the normal glia limitans morphology (a) the larger particles (32 nm in size) are already trapped by this layer and cannot pass into the parenchyma, reduction of IEG width (b) also inhibits passage of the smaller solute.

Similar articles

Cited by

References

    1. Hladky S. B. & Barrand M. A. Mechanisms of fluid movement into, through and out of the brain: evaluation of the evidence. Fluids Barriers CNS 11, 26 (2014). - PMC - PubMed
    1. Iliff J. J. et al.. A paravascular pathway facilitates CSF flow through the brain parenchyma and the clearance of interstitial solutes, including amyloid beta. Sci Transl Med 4, 147ra111 (2012). - PMC - PubMed
    1. Xie L. et al.. Sleep drives metabolite clearance from the adult brain. Science 342, 373–377 (2013). - PMC - PubMed
    1. Cserr H. & Patlak C. Secretion and bulk flow of interstitial fluid. In: Physiology and pharmacology of the blood-brain barrier, 245–261, Springer (1992).
    1. Kurtcuoglu V., Soellinger M., Summers P., Poulikakos D. & Boesiger P. Mixing and modes of mass transfer in the third cerebral ventricle: a computational analysis. J Biomech 129, 695–702 (2007). - PubMed

Publication types