

doi: 10.1038/srep38632.
Identification of a CD133-CD55- population functions as a fetal common skeletal progenitor
Affiliations
- PMID: 27929130
- PMCID: PMC5144148
- DOI: 10.1038/srep38632
Item in Clipboard
Identification of a CD133-CD55- population functions as a fetal common skeletal progenitor
Sci Rep.
.
Abstract
In this study, we identified a CD105+CD90.1-CD133-CD55- (CD133-CD55-) population in the fetal skeletal element that can generate bone and bone marrow. Besides osteoblasts and chondrocytes, the CD133-CD55- common progenitors can give rise to marrow reticular stromal cells and perivascular mesenchymal progenitors suggesting they function as the fetal common skeletal progenitor. Suppression of CXCL12 and Kitl expression in CD133-CD55- common progenitors severely disrupted the BM niche formation but not bone generation. Thus, CD133-CD55- common progenitors are the main source of CXCL12 and Kitl producing cells in the developing marrow.
Figures
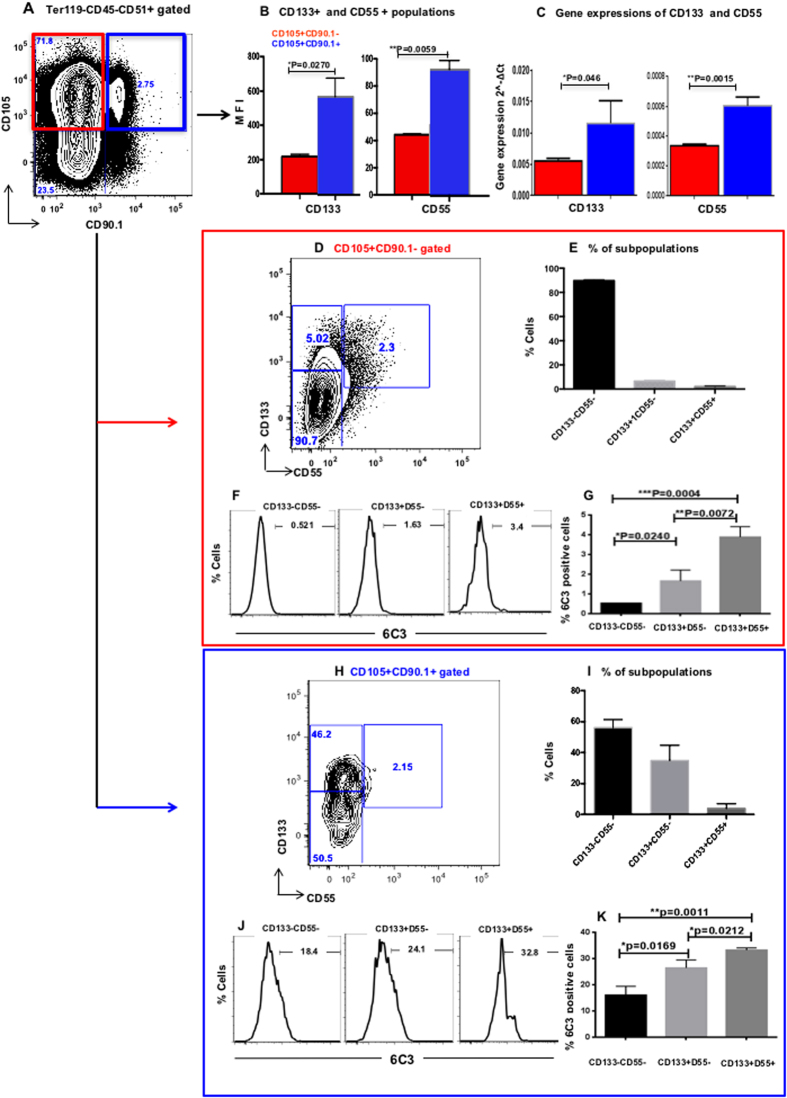
(A) Representative FACS profiles of E15.5 fetal skeletal cells. They were separated based on CD105 and CD90.1 expression into fetal osteochondral progenitors (CD105+CD90.1−) and osteoprogenitors (CD105+CD90.1+). (B) The expression of CD133 and CD55 in CD105+CD90.1− and CD105+CD90.1+ populations determined by FACS analysis. (C) The gene expression of CD133 and CD55 in CD105+CD90.1− and CD105+CD90.1+ populations. (D,H) Representative FACS profiles of CD133 and CD55 in CD105+CD90.1− (D) and CD105+CD90.1+ (H) populations. (E,I) Distribution of CD133−CD55−, CD133+CD55− and CD133+CD55+ subpopulations in CD105+CD90.1− (E) and CD105+CD90.1+ (I) populations. (F,J) Representative FACS analysis of 6C3 expression in CD105+CD90.1− (F) and CD105+CD90.1+ (J) derived CD133−CD55−, CD133+CD55− and CD133+CD55+ subpopulations. (G,K) Distribution of 6C3 positive cells in CD105+CD90.1− (G) and CD105+CD90.1+ (K) derived CD133−CD55−, CD133+CD55− and CD133+CD55+ subpopulations. (n = 3 for each group. *p < 0.05, **P < 0.010).
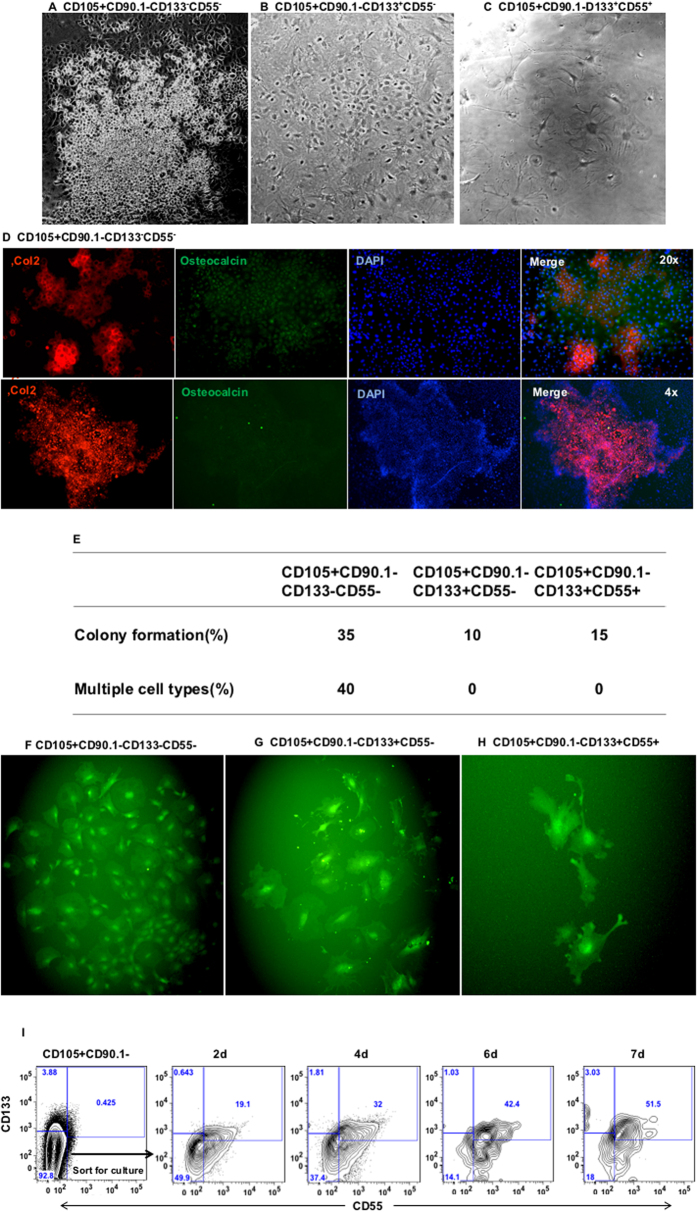
Fetal CD105+CD90.1− osteochondral progenitors were further sorted based on CD133 and CD55 expression and cultured for one month. (A–C) Bright-field image of cultured CD133−CD55− (A), CD133+CD55− (B) and CD133+CD55+ (C) progenitors. Only CD133−CD55− cell formed both the chondrocytes cluster and osteoblast. (D) Upper panels: The cultured CD133−CD55− cells were stained for the expression of Col2 (red) and osteocalcin (green). Lower panels: A representative chondrocyte cluster (red). (E) Summary of single cell colony forming assay of the three fetal skeletal progenitors. (F–H) Representative images of the colonies derived from cultured single cell of CD133−CD55− (F), CD133+CD55− (G) and CD133+CD55+ (H) progenitors. (I) Representative FACS profiles of CD133−CD55− cells 2, 4, 6 and 7 days in culture.
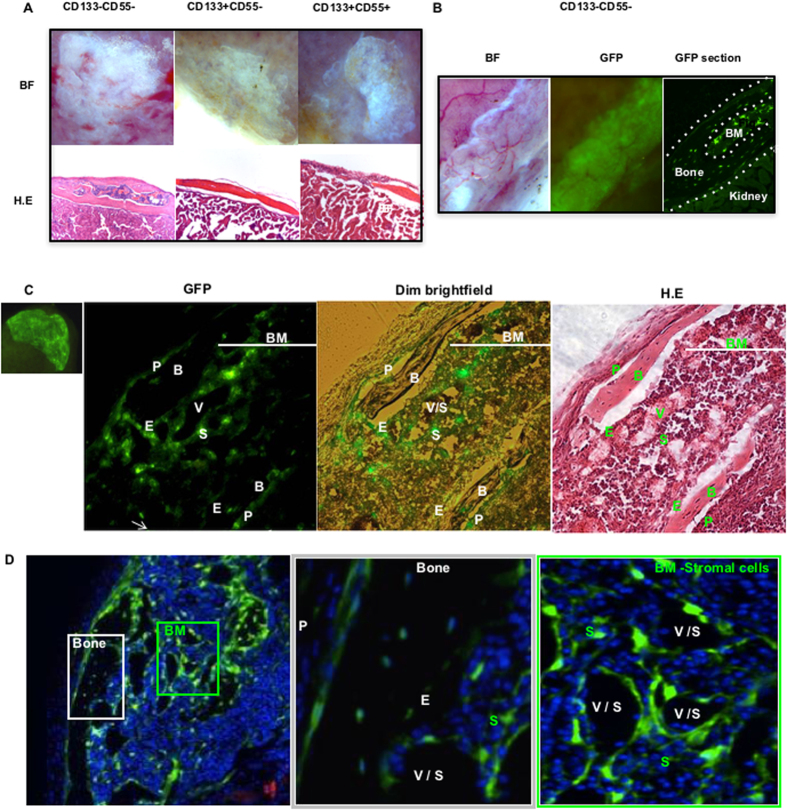
(A) Upper panel: Brightfield images of KC grafts from three sorted fetal progenitors 1 month after transplantation. Lower panel: Hematoxylin-and-Eosin (H.E) stained sections of KC grafts. (B) Brightfield (left) and GFP (middle) images of GFP-labeled CD133−CD55− progenitors one month after transplant. GFP image of the KC graft section (right). The KC graft was marked between the two dash lines. Marrow (BM) was located in the center. (C) GFP image of GFP-labeled CD133−CD55− progenitor KC graft (Far left). Images of the KC graft section in GFP(mid-left), GFP+dim light (mid-right). H.E staining of the slide after fluorescence images were captured (far right). (D) iCys scanning of the KC graft (left) and higher magnification of ectopic bone (middle, white square) and marrow (right, green square). P, periosteum; B, bone; V, vasculature; S, sinusoid; E, endosteum; BM, bone marrow.
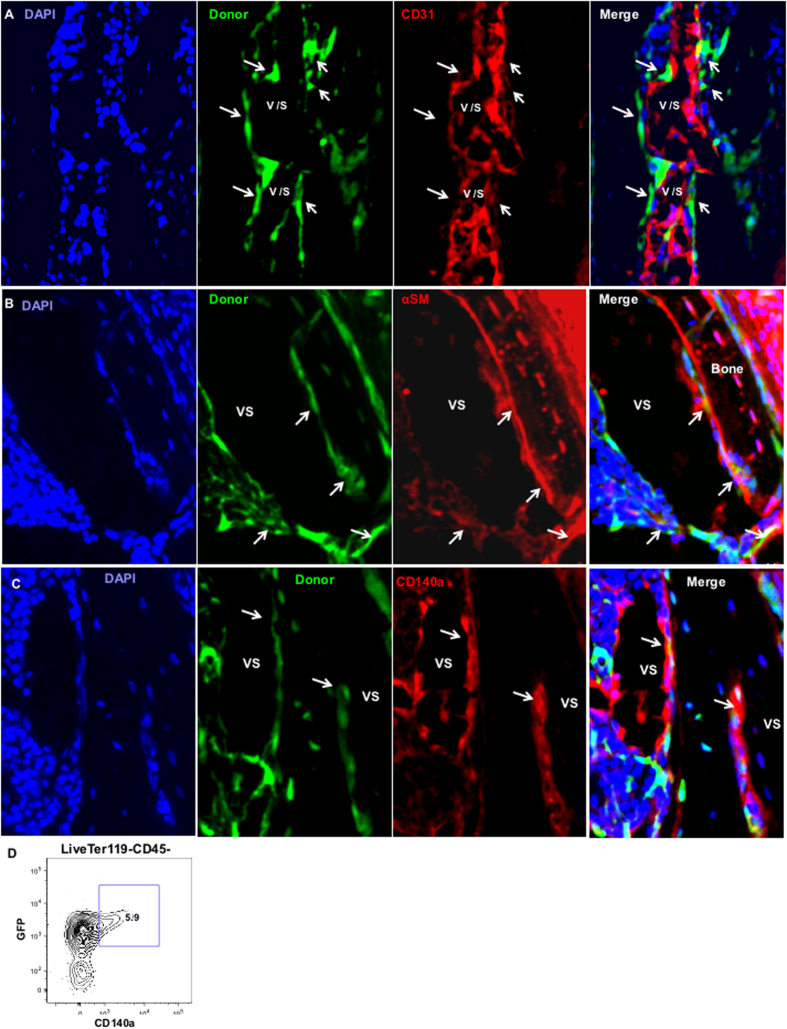
(A–C) iCys scanning of KC graft sections derived from GFP labeled CD133−CD55− progenitor. The sections were stained with antibodies against CD31(A), αSMA (B) or CD140a (C). Arrows indicate locations of donor-derived green cells. (D) Representative FACS analysis of CD140a expression in GFP+ graft cells.
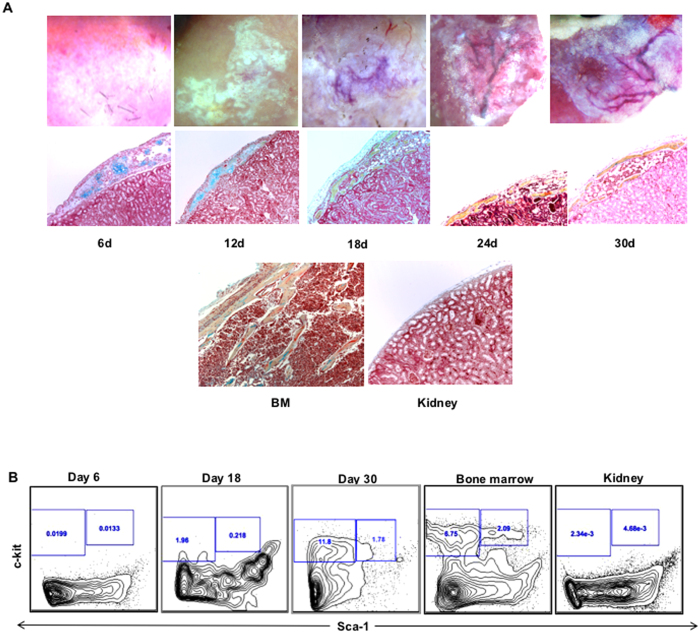
KC grafts derived from CD133−CD55− progenitors were harvested at time indicated after transplantation. (A) Representative brightfield images (upper panel) and pentachrome stained sections (middle panel; yellow = osteoid, blue = cartilage) of KC grafts. The sections of adult limb bone and kidney were shown as control (lower panel). (B) Time course study of hematopoietic components during ectopic niche formation. Representative FACS profiles of HSC (CD45+Lineage-c-Kit+Sca1+) frequency that were pre-gated for live, CD45+lineage- cells.
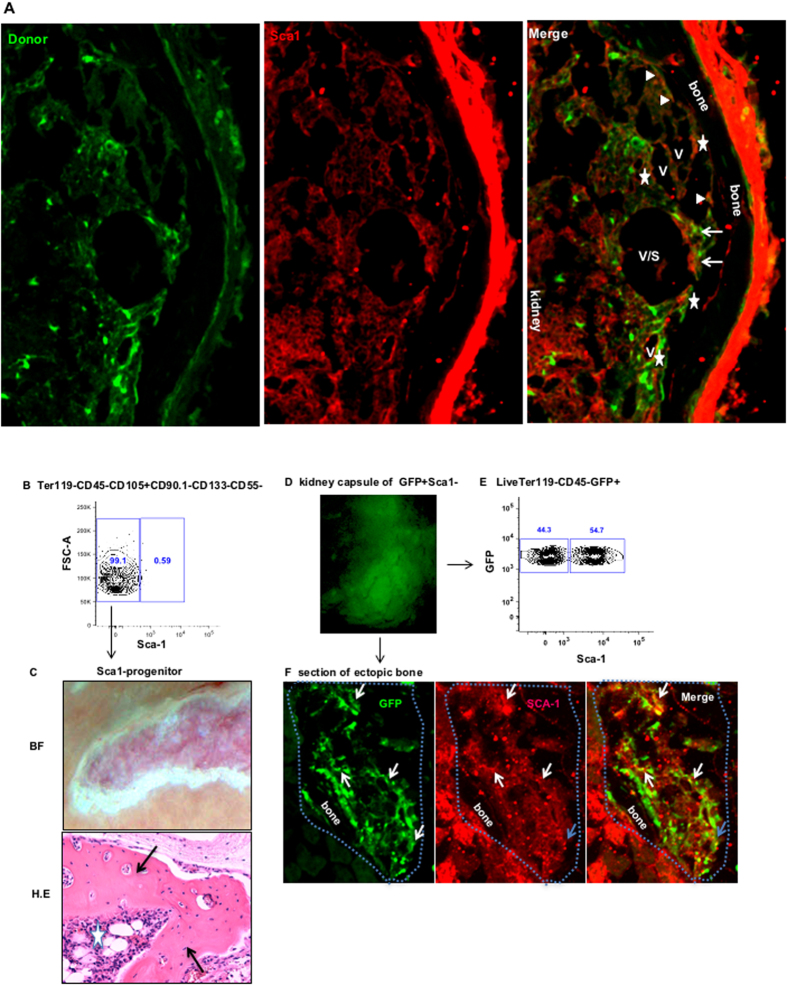
(A) Representative iCys scanned section of the KC graft derived from GFP labeled CD133−CD55− progenitor was stained with antibody against Sca1. Cells expressing both GFP and Sca1 were indicated by triangles, stars and arrows. The triangles label cells located in endosteum. The stars label the cells in perivascular regions. The arrows label the cells in stromal regions. (B) The expression of Sca1 in CD133−CD55− common progenitors determined by FACS analysis. (C) Representative brightfield (upper) and H.E section of the KC graft of sorted CD133−CD55−Sca1− cells one month after transplantation. Arrows indicate ectopic bones; star indicates the bone marrow. (D) GFP image of KC graft derived from GFP labeled CD133−CD55−Sca1− cells. (E) Representative FACS analysis of Sca−1 expression in GFP+ graft cells. (F) Section of GFP+ KC graft stained with Sca1. Arrows indicate the cells expressing both GFP and Sca−1. Blue dot line outlines the KC graft.
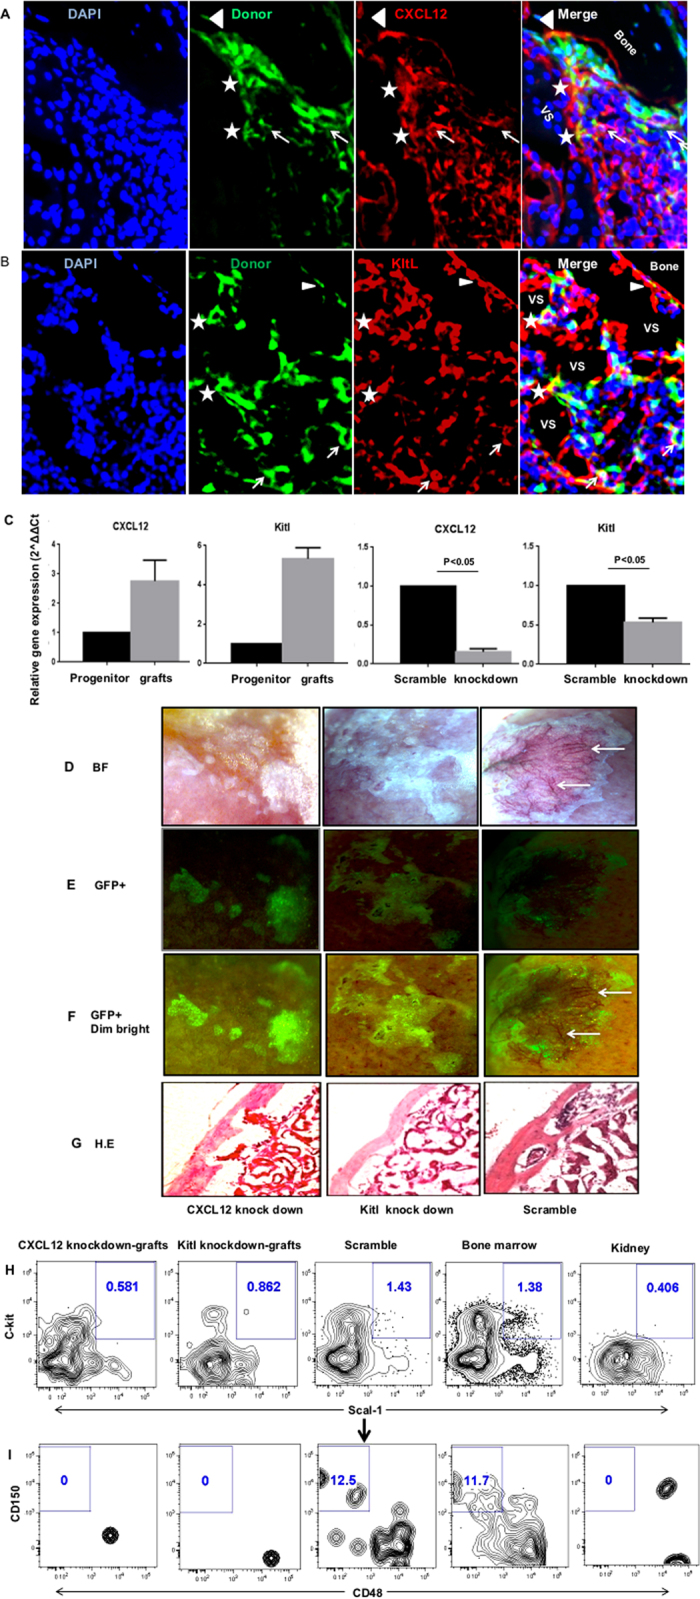
(A,B) Representative images of sections from GFP labeled CD133−CD55− progenitors derived KC grafts stained with antibody against CXCL12 (A) or Kitl (B). Cells expressing both GFP and CXCL12 (A) or GFP and Kitl (B) were indicated by triangles, stars and arrows. The triangles label cells located in endosteum. The stars label the cells in perivascular regions. The arrows label the cells in stromal regions. (C) Gene expression levels of CXCL12 and Kitl in freshly sorted CD133−CD55− progenitors and GFP+ donor derived cells harvested from KC grafts. (D) Knockdown efficiency of CXCL12 and Kitl was determined by qRT–PCR relative to scramble control. (E–H) Representative brightfield (E), GFP (F), GFP + dim brightfield (G) and H.E section (H) images of KC grafts derived from common progenitors transduced with lentivirus carried CXCL12 knockdown (left), Kitl knockdown (middle) or scramble control (right) constructs. Arrows indicate the vasculatures (only presented in the scramble control). (I,J) Representative FACS analysis of LSK (I; CD45+Lineage-c-Kit+Sca1+) and LT-HSC (J; LSKCD150+CD48−) frequency in KC grafts that were pre-gated for live, CD45+lineage− cells. The bone marrow and kidney cells were used as positive and negative controls, respectively.
Similar articles
-
C-KIT Expression Distinguishes Fetal from Postnatal Skeletal Progenitors.Stem Cell Reports. 2020 Apr 14;14(4):614-630. doi: 10.1016/j.stemcr.2020.03.001. Epub 2020 Mar 26. Stem Cell Reports. 2020. PMID: 32220331 Free PMC article.
-
Foxc1 is a critical regulator of haematopoietic stem/progenitor cell niche formation.Nature. 2014 Apr 24;508(7497):536-40. doi: 10.1038/nature13071. Epub 2014 Mar 2. Nature. 2014. PMID: 24590069
-
CXCL12 in early mesenchymal progenitors is required for haematopoietic stem-cell maintenance.Nature. 2013 Mar 14;495(7440):227-30. doi: 10.1038/nature11926. Epub 2013 Feb 24. Nature. 2013. PMID: 23434756 Free PMC article.
-
[Bone and Stem Cells. Bone marrow microenvironment niches for hematopoietic stem and progenitor cells].Clin Calcium. 2014 Apr;24(4):517-26. Clin Calcium. 2014. PMID: 24681497 Review. Japanese.
-
Hematopoietic Multipotent Progenitors and Plasma Cells: Neighbors or Roommates in the Mouse Bone Marrow Ecosystem?Front Immunol. 2021 Apr 15;12:658535. doi: 10.3389/fimmu.2021.658535. eCollection 2021. Front Immunol. 2021. PMID: 33936091 Free PMC article. Review.
Cited by
-
Single-cell RNA landscape of the osteoimmunology microenvironment in periodontitis.Theranostics. 2022 Jan 1;12(3):1074-1096. doi: 10.7150/thno.65694. eCollection 2022. Theranostics. 2022. PMID: 35154475 Free PMC article.
-
Different phenotypes and chondrogenic responses of human menstrual blood and bone marrow mesenchymal stem cells to activin A and TGF-β3.Stem Cell Res Ther. 2021 Apr 29;12(1):251. doi: 10.1186/s13287-021-02286-w. Stem Cell Res Ther. 2021. PMID: 33926568 Free PMC article.
References
Publication types
MeSH terms
Substances
Grants and funding
LinkOut - more resources
Full Text Sources
Other Literature Sources
Molecular Biology Databases
Research Materials
Miscellaneous
