. 2016 Dec 6;8(12):363.
doi: 10.3390/toxins8120363.

Co-Occurrence of Regulated, Masked and Emerging Mycotoxins and Secondary Metabolites in Finished Feed and Maize-An Extensive Survey

Affiliations

Co-Occurrence of Regulated, Masked and Emerging Mycotoxins and Secondary Metabolites in Finished Feed and Maize-An Extensive Survey

Paula Kovalsky et al. Toxins (Basel). .

Abstract

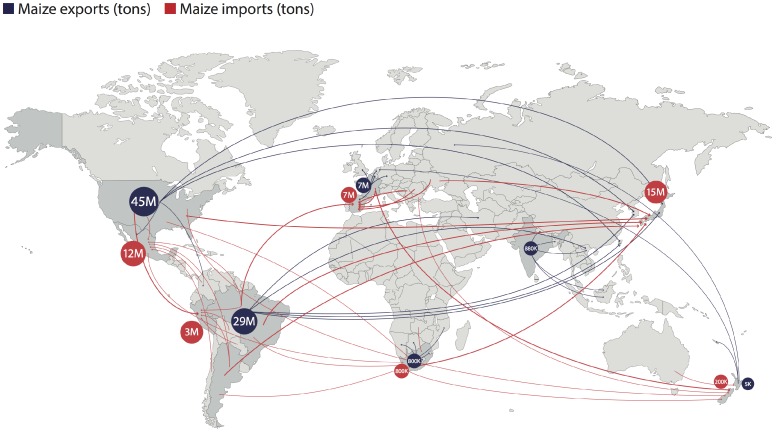
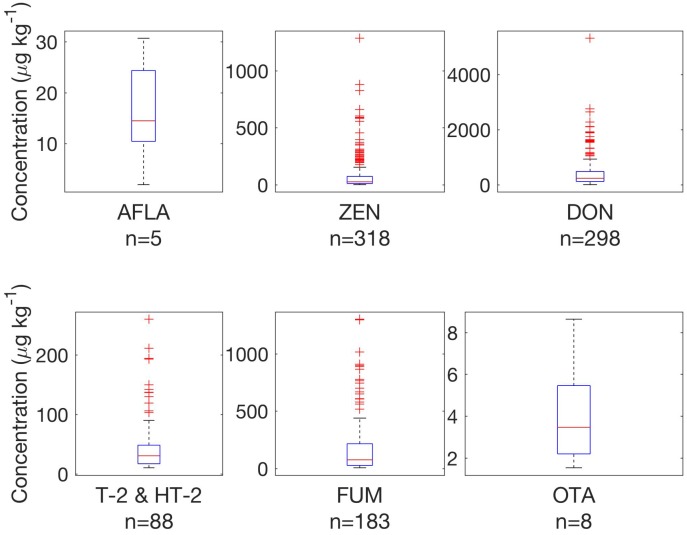
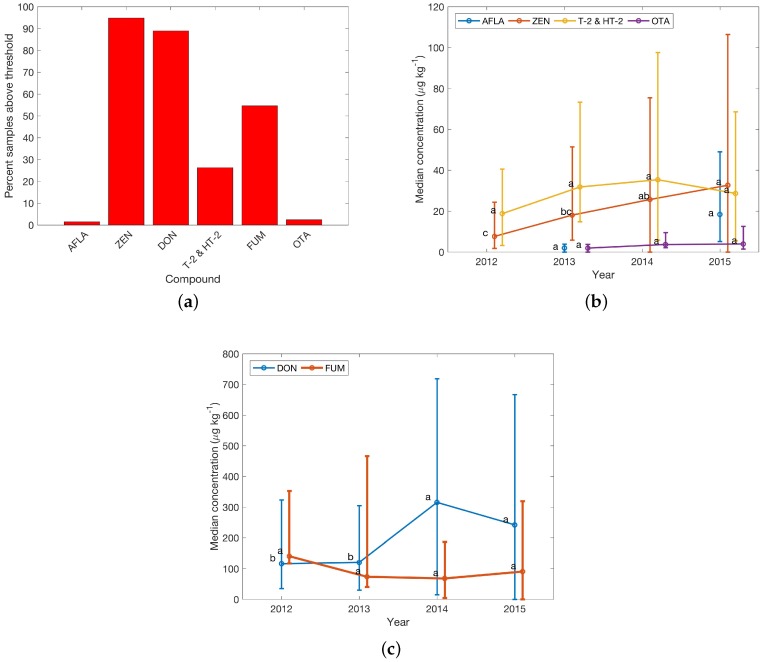
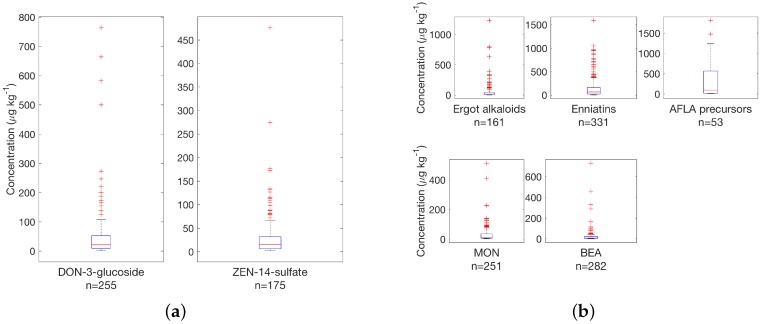
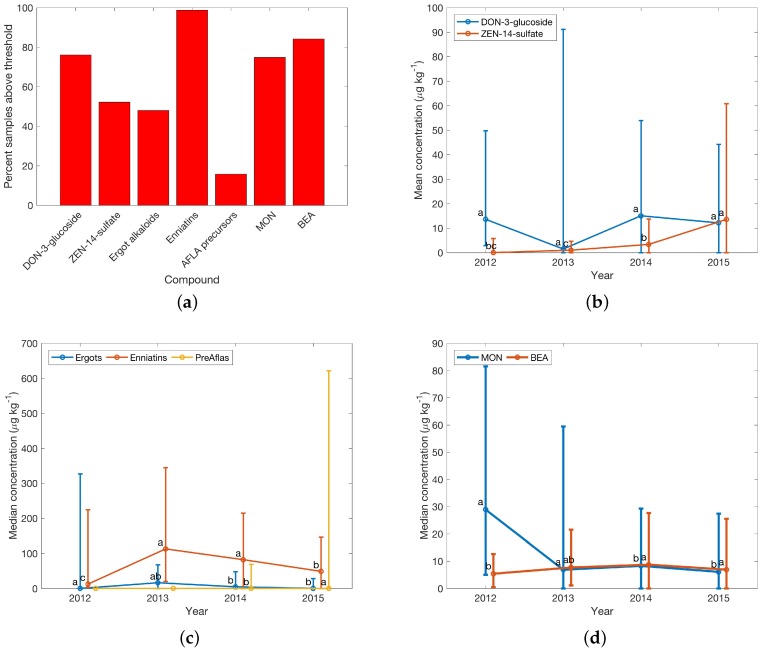
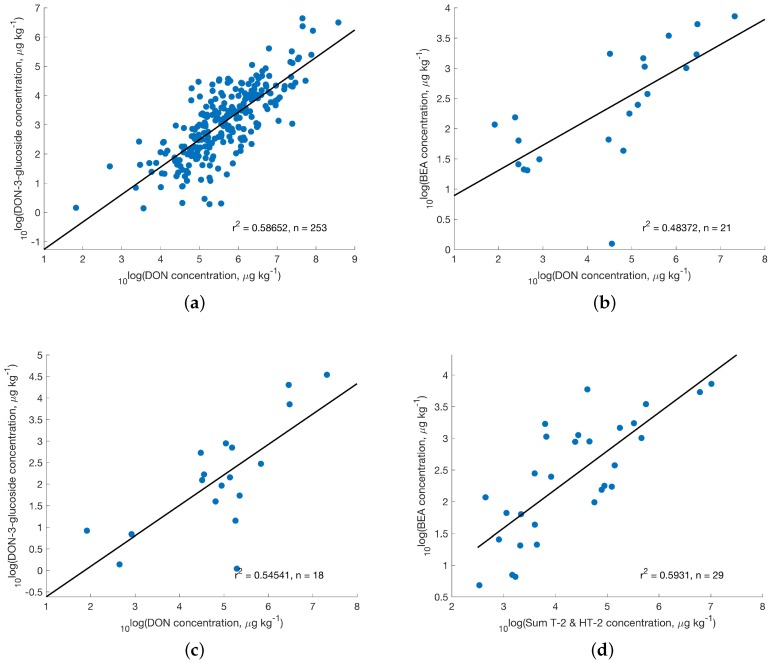
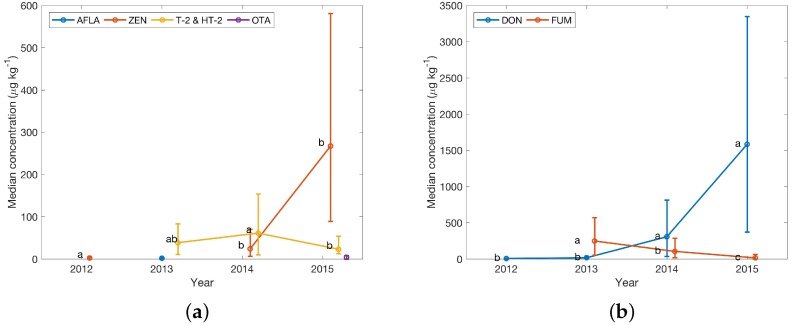
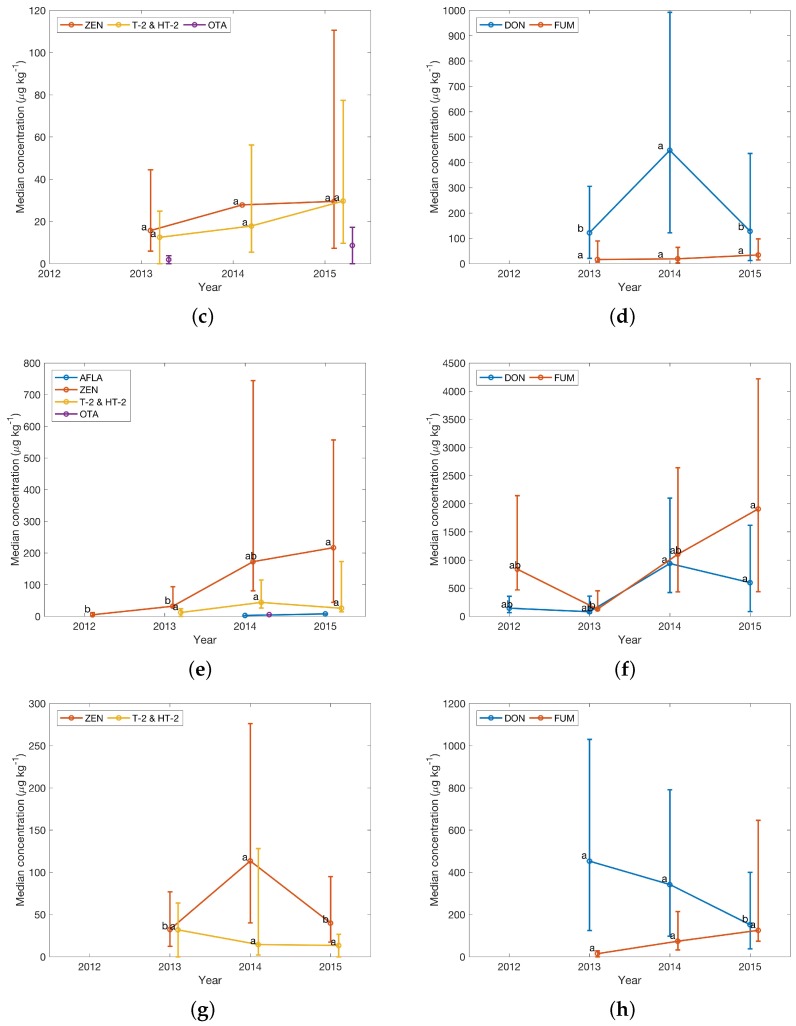
Global trade of agricultural commodities (e.g., animal feed) requires monitoring for fungal toxins. Also, little is known about masked and emerging toxins and metabolites. 1926 samples from 52 countries were analysed for toxins and metabolites. Of 162 compounds detected, up to 68 metabolites were found in a single sample. A subset of 1113 finished feed, maize and maize silage samples containing 57 compounds from 2012 to 2015 from 44 countries was investigated using liquid chromatography and mass spectrometry. Deoxynivalenol (DON), zearalenone (ZEN) and fumonisins showed large increases of annual medians in Europe. Within a region, distinct trends were observed, suggesting importance of local meteorology and cultivars. In 2015, median DON concentrations increased to 1400 μ g·kg - 1 in Austria, but were stable in Germany at 350 μ g·kg - 1 . In 2014, enniatins occurred at median concentrations of 250 μ g·kg - 1 in Europe, at levels similar to DON and ZEN. The latter were frequently correlated with DON-3-glucoside and ZEN-14-sulfate. Co-occurrence of regulated toxins was frequent with e.g., enniatins, and moniliformin. Correlation was observed between DON and DON-3-glucoside and with beauvericin. Results indicate that considerably more than 25% of agricultural commodities could be contaminated with mycotoxins as suggested by FAO, although this is at least partly due to the lower limits of detection in the current survey. Observed contamination percentages ranged from 7.1 to 79% for B trichothecenes and 88% for ZEN.

Keywords: concentration data; emerging mycotoxins; global; masked mycotoxins; mycotoxin; secondary metabolites; survey.


Conflict of interest statement

The authors declare no conflict of interest. The founding sponsors had no role in the design of the study; in the collection, analyses, or interpretation of data; in the writing of the manuscript, and in the decision to publish the results.

Figures

Figure 1
Figure 1
Simplified global maize trade for 2015. Map shows the largest importer (red) and exporter (blue) on each continent with the five largest countries of origin and destination, respectively [7].
Figure 2
Figure 2
Survey results for regulated toxins and toxins with guidance levels in 335 finished feed samples in Central Europe above defined thresholds listed in Table 1. n provides number of samples. Boxplots follow definition by McGill et al. [77].
Figure 3
Figure 3
Survey results for regulated toxins in finished feed samples in Central Europe. (a) Percentage of samples with concentrations above thresholds; see Table 1 for details; (b) and (c) Yearly median concentrations from 2012 to 2015 (missing point indicates that no data were available). Error bars reflect the Wilcoxon confidence interval (CI). Lower error were replaced with the median, if the Wilcoxon CI would have resulted in negative concentrations. Significance codes show differences between yearly medians from a Kruskal–Wallis test result. Different letters indicate a significant difference between the groups. Data points were offset on the x-axis for clarity. Sample numbers for calculation of the median of each year are availale in Table 3.
Figure 4
Figure 4
Survey results for (a) masked and (b) emerging toxins in finished feed samples from Central Europe (335 samples) above threshold concentrations; see Table 1 for details.
Figure 5
Figure 5
(a) Survey results for masked (DON-3-glucoside and ZEN-14-sulfate) and emerging toxins in finished feed samples from Central Europe above threshold levels; see Table 1 for details. Subfigures (b) masked, (c) and (d) show yearly median data for emerging toxins for the years 2012–2015 in Central Europe. Error bars reflect the Wilcoxon confidence interval (CI). Lower error were replaced with the median, if the Wilcoxon CI would have resulted in negative concentrations. Significance codes show differences between yearly medians from a Kruskal–Wallis test result. Different letters indicate a significant difference between the groups. Data points were offset on the x-axis for clarity. Sample numbers for calculation of the median of each year are available in Table 3.
Figure 6
Figure 6
Correlation of (a) DON and DON-3-glucoside in Central Europe; (b) DON with BEA (Eastern Europe); (c) DON with DON-3-glucoside (Eastern Europe) and (d) sum of T-2 and HT-2 toxins with BEA in finished feed samples (Eastern Europe).
Figure 7
Figure 7
Yearly median concentrations of regulated toxins and compounds with guidance levels in finished feed from (a) and (b) Austria, (c) and (d) Germany from 2012 to 2015. Error bars reflect the Wilcoxon confidence interval (CI). Lower error were replaced with the median, if the Wilcoxon CI would have resulted in negative concentrations. Significance codes show differences between yearly medians from a Kruskal–Wallis test result. Different letters indicate a significant difference between the groups. Data points were offset on the x-axis for clarity. Sample numbers for calculation of the median of each year are availale in Table 3. Yearly median concentrations of regulated toxins and compounds with guidance levels in finished feed from (e) and (f) Italy, and (g) and (h) The Netherlands from 2012 to 2015. Error bars reflect the Wilcoxon confidence interval (CI). Lower error were replaced with the median, if the Wilcoxon CI would have resulted in negative concentrations. Significance codes show differences between yearly medians from a Kruskal–Wallis test result. Different letters indicate a significant difference between the groups. Data points were offset on the x-axis for clarity. Sample numbers for calculation of the median of each year are available in Table 3.
Figure 7
Figure 7
Yearly median concentrations of regulated toxins and compounds with guidance levels in finished feed from (a) and (b) Austria, (c) and (d) Germany from 2012 to 2015. Error bars reflect the Wilcoxon confidence interval (CI). Lower error were replaced with the median, if the Wilcoxon CI would have resulted in negative concentrations. Significance codes show differences between yearly medians from a Kruskal–Wallis test result. Different letters indicate a significant difference between the groups. Data points were offset on the x-axis for clarity. Sample numbers for calculation of the median of each year are availale in Table 3. Yearly median concentrations of regulated toxins and compounds with guidance levels in finished feed from (e) and (f) Italy, and (g) and (h) The Netherlands from 2012 to 2015. Error bars reflect the Wilcoxon confidence interval (CI). Lower error were replaced with the median, if the Wilcoxon CI would have resulted in negative concentrations. Significance codes show differences between yearly medians from a Kruskal–Wallis test result. Different letters indicate a significant difference between the groups. Data points were offset on the x-axis for clarity. Sample numbers for calculation of the median of each year are available in Table 3.
Figure 8
Figure 8
Survey results for type A and type B trichotheces from (a) South Africa and (b) Central Europe in finished feed samples above threshold concentrations; see Table 1 for details.
Figure 9
Figure 9
Number of samples n in the investigated data set from a (a) Global and (b) European perspective.

References

    1. Smith J.E., Solomons G., Lewis C., Anderson J.G. Role of mycotoxins in human and animal nutrition and health. Nat. Toxins. 1995;3:187–192. doi: 10.1002/nt.2620030404. - DOI - PubMed
    1. Wild C.P., Gong Y.Y. Mycotoxins and human disease: A largely ignored global health issue. Carcinogenesis. 2010;31:71–82. doi: 10.1093/carcin/bgp264. - DOI - PMC - PubMed
    1. Sweeney M.J., Dobson A.D. Mycotoxin production by Aspergillus, Fusarium and Penicillium species. Int. J. Food Microbiol. 1998;43:141–158. doi: 10.1016/S0168-1605(98)00112-3. - DOI - PubMed
    1. Rivas Casado M., Parsons D.J., Weightman R.M., Magan N., Origgi S. Modelling a two-dimensional spatial distribution of mycotoxin concentration in bulk commodities to design effective and efficient sample selection strategies. Food Addit. Contam. 2009;26:1298–1305. doi: 10.1080/02652030903042517. - DOI - PubMed
    1. European Feed Manufacturers’ Federation (FEFAC) FEFAC Annual Report 2014–2015. FEFAC; Brussels, Belgium: 2015.