. 2016 Dec 8;7(12):e2511.
doi: 10.1038/cddis.2016.404.

Dual targeting of glutaminase 1 and thymidylate synthase elicits death synergistically in NSCLC

Affiliations

Dual targeting of glutaminase 1 and thymidylate synthase elicits death synergistically in NSCLC

Jae-Seon Lee et al. Cell Death Dis. .

Abstract

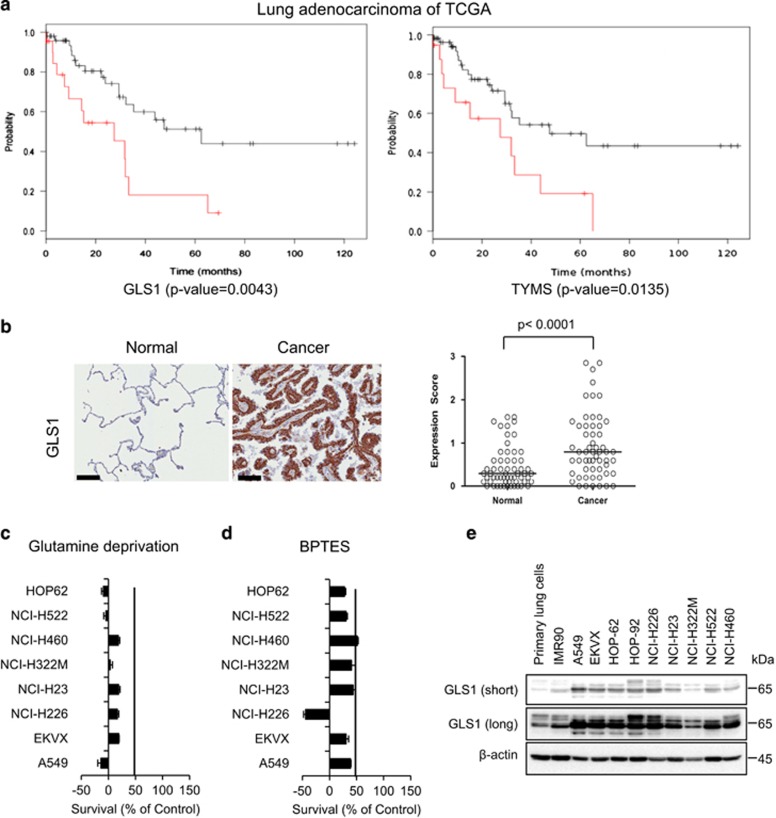
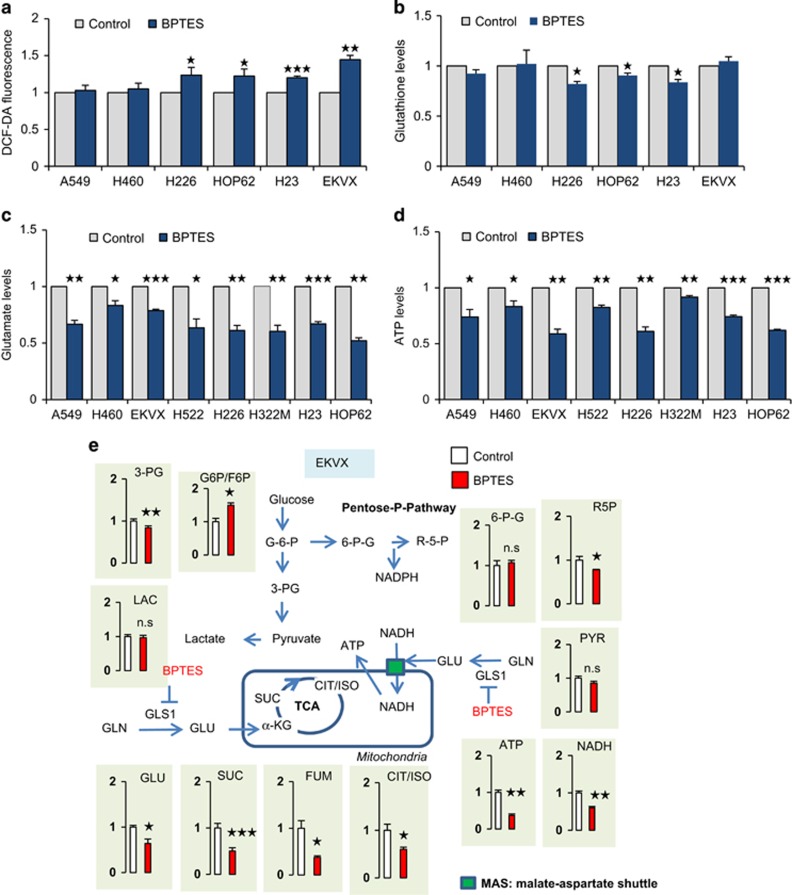
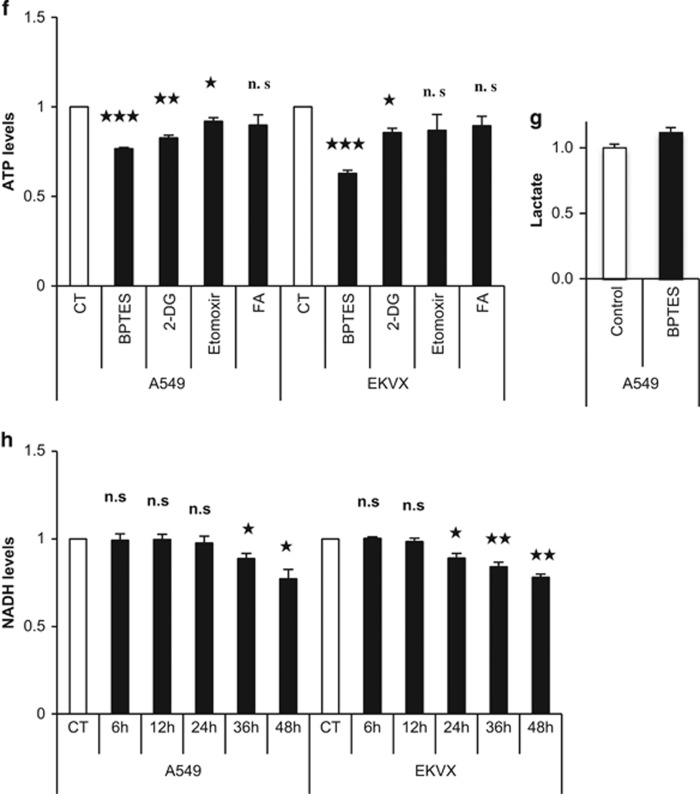
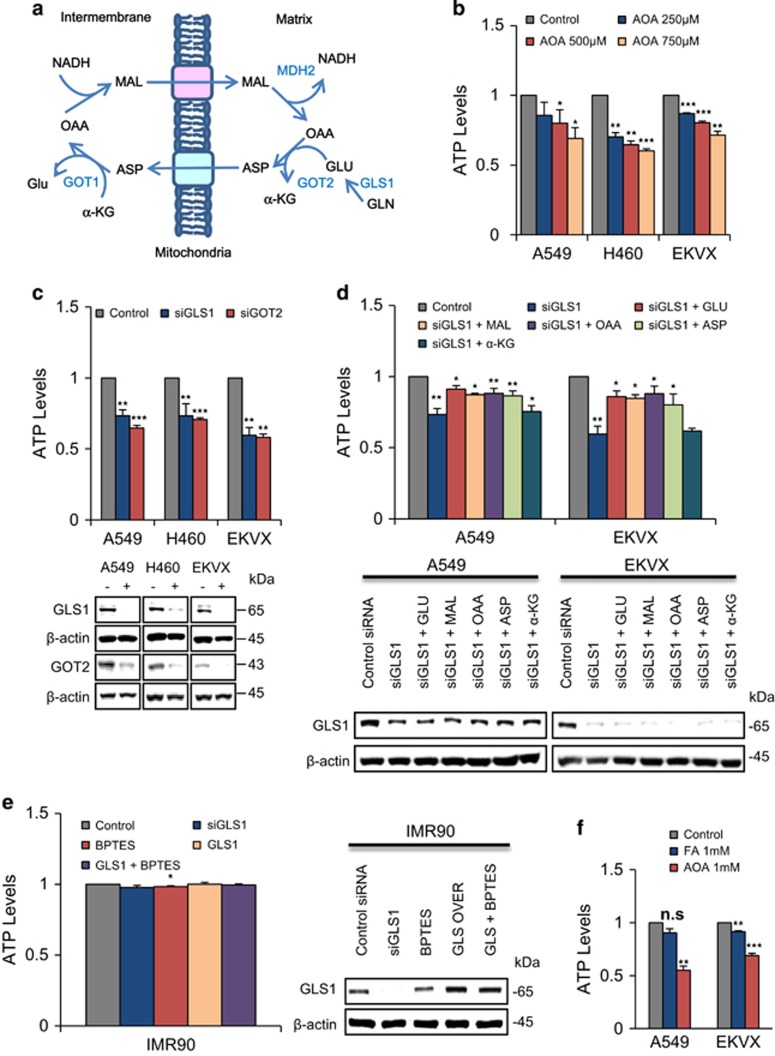
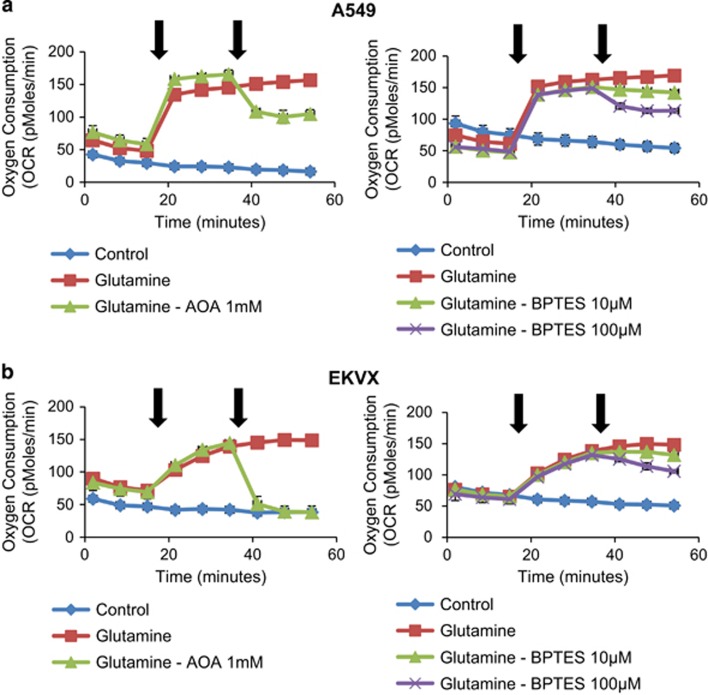
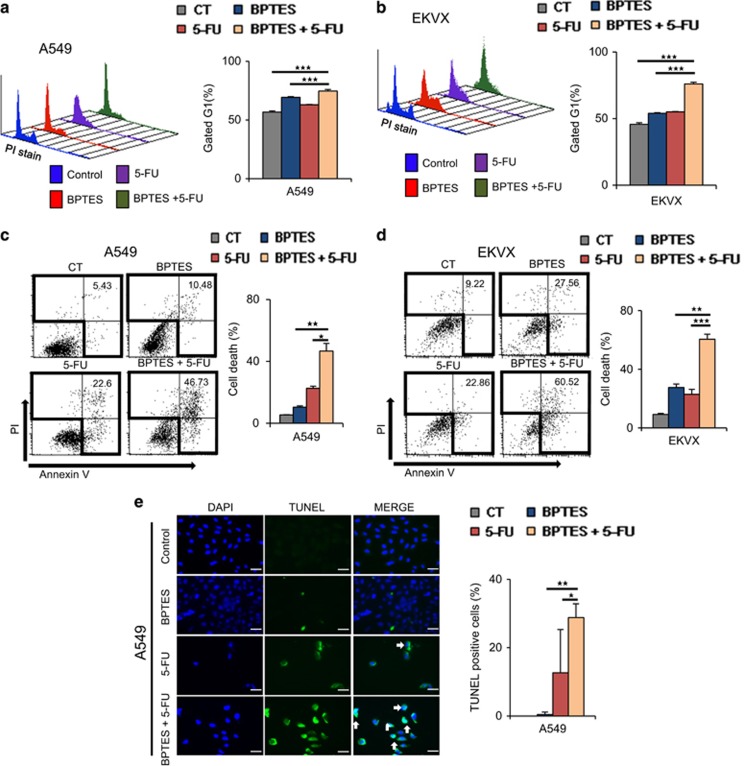
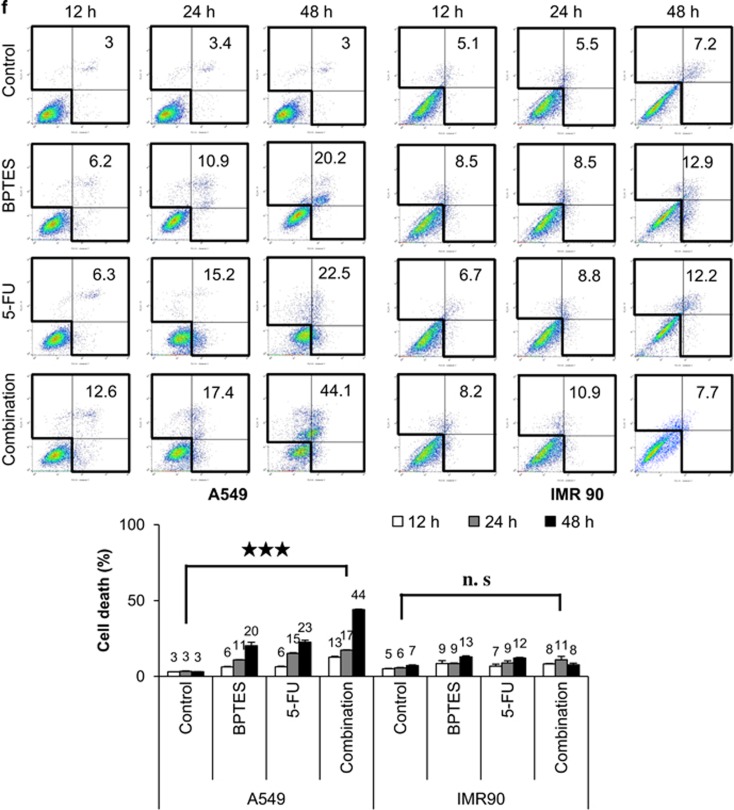
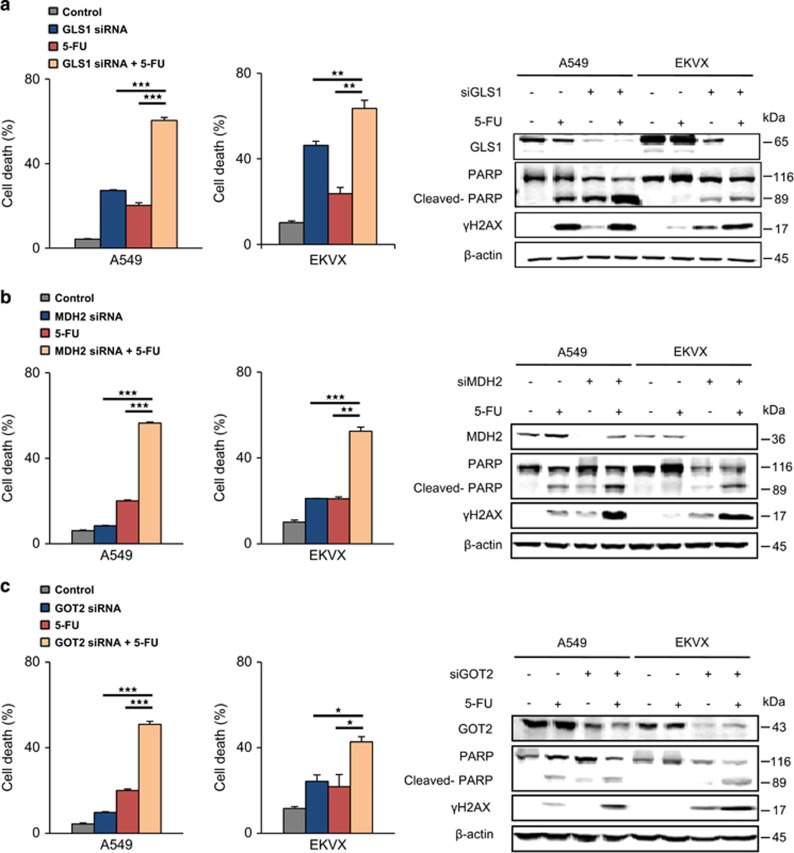
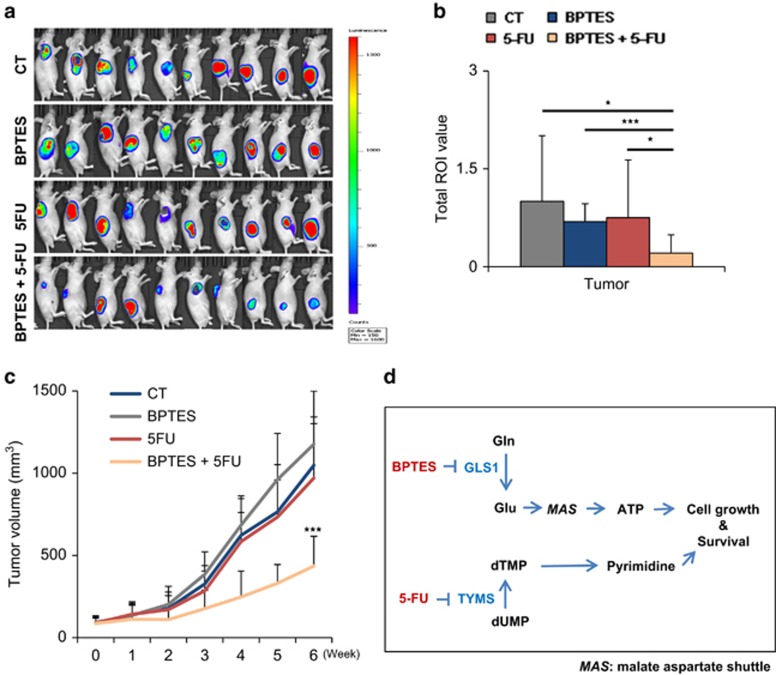
Glutaminase 1 (GLS1) expression is increased in non-small cell lung cancer (NSCLC). GLS1 knockdown using siRNA or inhibition using bis-2-(5-phenylacetamido-1,3,4-thiadiazol-2-yl)ethyl sulfide (BPTES) induced cell cycle arrest with significant reduction of ATP level while levels of reactive oxygen species or glutathione were not affected in NSCLC cell lines. Recently we found that NSCLC significantly depends on cytosol NADH for ATP production. GLS1 remarkably contributes to ATP production through transferring cytosolic NADH into mitochondria via malate-aspartate shuttle by supply of glutamate in NSCLC. Regulation of malate-aspartate shuttle by knockdown or inhibition of glutamic-oxaloacetic transaminase 2 or malate dehydrogenase 2 mimicked GLS1 knockdown, which induced cell death with ATP reduction in NSCLC. Therefore, GLS1 inhibition induced cell cycle arrest with ATP depletion by glutamate reduction. Dual inhibition with BPTES and thymidylate synthase inhibitor, 5-fluorouracil (5-FU), elicits cell death synergistically through cell cycle arrest in NSCLC. A preclinical xenograft model of NSCLC showed remarkable anti-tumour effect synergistically in the BPTES and 5-FU dual therapy group.


Figures

Figure 1
Figure 1
Glutamine metabolism is critical for overall survival and proliferation of NSCLC. (a) As was the case with the clinical information dataset from TCGA, higher levels of expression of GLS and TYMS were associated with reduced overall survival. Log-rank P-values of the genes were 0.0043 and 0.0135, respectively. Cases with higher expression levels of GLS and TYMS are coloured red, and cases without higher expression levels of these genes are coloured black. (b) Immunohistochemical staining of GLS1. The expression level of GLS1 in NSCLC tumour tissues was significantly higher than that in penumocytes from normal lung tissues (N=57).The expression score was obtained from immuno-staining intensity and the percentage of positive cells in tissue microarray core as in Materials and Methods. The expression score was significantly higher in NSCLC tumor cells than in normal lung pneumocytes (P<0.0001 by Mann-Whitney U test). (c) NSCLC cells were treated with glutamine-free medium for 48 h, and cell proliferation was tested by the SRB assay. (d) NSCLC cells were treated with GLS1 inhibitor, bis-2-(5-phenylacetamido-1,3,4-thiadiazol-2-yl)ethyl sulfide (BPTES, 100 μM), for 48 h, and cell proliferation was tested by the SRB assay. (e) The expression level of GLS1 in NSCLC cells and the primary small airway epithelial cells IMR90 was analysed by immunoblotting. SRB, sulforhodamine B
Figure 2
Figure 2
GLS1 inhibition generally correlates with ATP reduction. (a) Intracellular levels of ROS were measured in NSCLC with or without 10 μM BPTES treatment. (b) Intracellular levels of glutathione were measured in NSCLC with or without 10 μM BPTES treatment. (c) Glutamate levels were measured using a Glutamate Assay Kit after NSCLC cells were treated with 10 μM of BPTES for 48 h. (d) ATP levels were measured using an ATP Assay Kit after NSCLC cells were treated with 10 μM of BPTES for 48 h. (e) Relative pool sizes of metabolomics were assessed by targeted LC-MS/MS upon EKVX treated with 10 μM of BPTES for 48 h. Metabolite levels were measured in triplicate. (f) Cells were treated with the indicated inhibitors for 48 h and then the level of ATP was determined (BPTES: 10 μM, 2-DG: 2 mM, Etomoxir: 100 μM, FA: 500 μM). (g) A549 cells were treated with BPTES (10 μM) for 48 h, and the secreted lactate level was measured. (h) The level of total NADH was determined at the indicated hours after cells were treated with 10 μM BPTES. P-values were determined using two-tailed Student's t-tests (ns, not significant; *0.01<P<0.05; **0.001<P<0.01; ***P<0.001)
Figure 2
Figure 2
GLS1 inhibition generally correlates with ATP reduction. (a) Intracellular levels of ROS were measured in NSCLC with or without 10 μM BPTES treatment. (b) Intracellular levels of glutathione were measured in NSCLC with or without 10 μM BPTES treatment. (c) Glutamate levels were measured using a Glutamate Assay Kit after NSCLC cells were treated with 10 μM of BPTES for 48 h. (d) ATP levels were measured using an ATP Assay Kit after NSCLC cells were treated with 10 μM of BPTES for 48 h. (e) Relative pool sizes of metabolomics were assessed by targeted LC-MS/MS upon EKVX treated with 10 μM of BPTES for 48 h. Metabolite levels were measured in triplicate. (f) Cells were treated with the indicated inhibitors for 48 h and then the level of ATP was determined (BPTES: 10 μM, 2-DG: 2 mM, Etomoxir: 100 μM, FA: 500 μM). (g) A549 cells were treated with BPTES (10 μM) for 48 h, and the secreted lactate level was measured. (h) The level of total NADH was determined at the indicated hours after cells were treated with 10 μM BPTES. P-values were determined using two-tailed Student's t-tests (ns, not significant; *0.01<P<0.05; **0.001<P<0.01; ***P<0.001)
Figure 3
Figure 3
Blocking malate-shuttle system mimics GLS1 inhibition in ATP reduction. (a) A simplified model of the malate–aspartate shuttle (MAS) for NADH transportation into the mitochondrial matrix. (b) ATP levels were measured after treatment with 250 μM, 500 μM and 750 μM of AOA for inhibition of GOT2 in A549, H460 and EKVX for 48 h in a dose-dependent manner. (c) ATP levels were measured after treatment with 20 nM of siRNAs of GLS1 and GOT2 in A549, H460 and EKVX for 48 h. (d) ATP levels were measured after NSCLC cells were treated with 20 nM siRNA of GLS1 for 24 h and supplemented with metabolites, including 5 mM of malate, aspartate, glutamate and oxaloacetate, and 2 mM of dimethylated α-ketoglutarate, for 48 h. (e) ATP levels were measured using an ATP Assay Kit after treatment of IMR90 cells with 10 μM of BPTES for 48 h as a normal control. (f) ATP levels were measured after treatment with 1 mM fluoroacetate and 1 mM aminooxyacetate in A549 and EKVX for 48 h. P-values were determined using two-tailed Student's t-tests (ns, not significant; *0.01<P<0.05; **0.001<P<0.01; ***P<0.001)
Figure 4
Figure 4
Glutamine oxidation and transaminase pathway is linked in the MAS system. (a) OCR response (% of baseline) in A549 cells to glutamine (4 mM), AOA (0 or 1 mM) and BPTES (0, 10 or 100 μM). (b) OCR response (% of baseline) in EKVX cells to glutamine (4 mM), AOA (0 or 1 mM) and BPTES (0, 10 or 100 μM). The % OCR was plotted using measurement 3 as the baseline. The assay medium was the substrate-free base medium. Each data point represents mean±S.D., n=3. Front arrow indicates addition of glutamine, and the second arrow indicates treatment of inhibitors
Figure 5
Figure 5
Cell death was significantly induced by dual treatment with BPTES and 5-FU through cell cycle arrest. To test the effect of combined BPTES and 5-FU treatment, NSCLC cells were treated with 10 μM of BPTES, 10 μM of 5-FU, or both 10 μM of BPTES and 10 μM of 5-FU for 48 h. (a) Cell cycle was measured by FACS analysis using PI staining after GLS1 inhibition with 10 μM of BPTES and/or 10 μM of 5-FU for 12 h in A549 cells. (b) Cell cycle was measured by FACS analysis using PI staining after GLS1 knockdown with 10 μM of BPTES and/or 10 μM of 5-FU for 12 h in EKVX cells. (c) Cell death was measured with FACS analysis using PI and annexin V in A549 after drug treatment for 48 h. (d) Cell death was measured with FACS analysis using PI and annexin V in EKVX after drug treatment for 48 h. (e) Cell death was measured with TUNEL staining in A549 after drug treatment for 48 h. The scale bar, 50 μm. (f) Cell death was measured by the annexin V assay after cells were treated with 10 μM of BPTES, 10 μM of 5-FU, or combined for 12, 24 and 48 h in A549 and IMR90. P-values were determined using two-tailed Student's t-tests (ns, not significant; *0.01<P<0.05; **0.001<P<0.01; ***P<0.001)
Figure 5
Figure 5
Cell death was significantly induced by dual treatment with BPTES and 5-FU through cell cycle arrest. To test the effect of combined BPTES and 5-FU treatment, NSCLC cells were treated with 10 μM of BPTES, 10 μM of 5-FU, or both 10 μM of BPTES and 10 μM of 5-FU for 48 h. (a) Cell cycle was measured by FACS analysis using PI staining after GLS1 inhibition with 10 μM of BPTES and/or 10 μM of 5-FU for 12 h in A549 cells. (b) Cell cycle was measured by FACS analysis using PI staining after GLS1 knockdown with 10 μM of BPTES and/or 10 μM of 5-FU for 12 h in EKVX cells. (c) Cell death was measured with FACS analysis using PI and annexin V in A549 after drug treatment for 48 h. (d) Cell death was measured with FACS analysis using PI and annexin V in EKVX after drug treatment for 48 h. (e) Cell death was measured with TUNEL staining in A549 after drug treatment for 48 h. The scale bar, 50 μm. (f) Cell death was measured by the annexin V assay after cells were treated with 10 μM of BPTES, 10 μM of 5-FU, or combined for 12, 24 and 48 h in A549 and IMR90. P-values were determined using two-tailed Student's t-tests (ns, not significant; *0.01<P<0.05; **0.001<P<0.01; ***P<0.001)
Figure 6
Figure 6
Cell death was significantly induced by 5-FU treatment with knockdown of MAS genes. (a) Cell death was analysed by FACS using PI and annexin V. Cells were treated 5-FU for 48 h after treatment with 20 nM siRNA of GLS1 for 24 h (Supplementary Figure 4a). GLS1 knockdown, γH2AX and PARP cleavage was determined by immunoblotting. (b) Cell death was analysed by FACS using PI and annexin V. Cells were treated 5-FU for 48 h after treatment with 20 nM siRNA of MDH2 for 24 h (Supplementary Figure 4b). MDH2 knockdown, γH2AX and PARP cleavage was determined by immunoblotting. (c) Cell death was analysed by FACS using PI and annexin V. Cells were treated 5-FU for 48 h after treatment with 20 nM siRNA of GOT2 for 24 h (Supplementary Figure 4c). GOT2 knockdown, γH2AX and PARP cleavage was determined by immunoblotting. P-values were determined using two-tailed Student's t-tests (ns, not significant; *0.01<P<0.05; **0.001<P<0.01; ***P<0.001)
Figure 7
Figure 7
A preclinical NSCLC mouse model was reversed by dual treatment with BPTES and 5-FU. (a) A549-luciferase (5 × 10⁶) cells were injected in both flanks of 6–8-week-old BALB/c nude mice. When the volume of the tumour mass reached 80 mm3, the mice were randomly assigned to one of four treatment groups including vehicle control, BPTES, 5-FU and combination of BPTES and 5-FU (n=10 per group). BPTES (10 mg/kg body weight), 5-FU (20 mg/kg body weight), and vehicle were administered orally 5 days/week, and the tumour growth was monitored by photon flux released from luciferin as described in the experimental procedures. The data were expressed as photon flux (photons/s/cm2/steradian), which is represented by a colour scale. (b) Graph shows the total ROI value. (c) Graph represents the tumour growth curve as measured using calipers. (d) A proposed model of the synergistic mechanism between GLS1 inhibition and TYMS inhibition in NSCLC. P-values were determined using two-tailed Student's t-tests (ns, not significant; *0.01<P<0.05; P<0.01; ***P<0.001)

References

    1. Gao P, Tchernyshyov I, Chang T-C, Lee Y-S, Kita K, Ochi T et al. c-Myc suppression of miR-23a/b enhances mitochondrial glutaminase expression and glutamine metabolism. Nature 2009; 458: 762–765. - PMC - PubMed
    1. Le A, Lane AN, Hamaker M, Bose S, Gouw A, Barbi J et al. Glucose-independent glutamine metabolism via TCA cycling for proliferation and survival in B cells. Cell Metab 2012; 15: 110–121. - PMC - PubMed
    1. Yuneva MO, Fan TW, Allen TD, Higashi RM, Ferraris DV, Tsukamoto T et al. The metabolic profile of tumors depends on both the responsible genetic lesion and tissue type. Cell Metab 2012; 15: 157–170. - PMC - PubMed
    1. van den Heuvel APJ, Jing J, Wooster RF, Bachman KE. Analysis of glutamine dependency in non-small cell lung cancer: GLS1 splice variant GAC is essential for cancer cell growth. Cancer Biol Ther 2012; 13: 1185–1194. - PMC - PubMed
    1. Xiang Y, Stine ZE, Xia J, Lu Y, O'Connor RS, Altman BJ et al. Targeted inhibition of tumor-specific glutaminase diminishes cell-autonomous tumorigenesis. J Clin Invest 2015; 125: 2293–2306. - PMC - PubMed

Publication types

MeSH terms