. 2016 Dec 8;7(12):e2516.
doi: 10.1038/cddis.2016.411.

Sensitivity of hematopoietic stem cells to mitochondrial dysfunction by SdhD gene deletion

Affiliations

Sensitivity of hematopoietic stem cells to mitochondrial dysfunction by SdhD gene deletion

José Antonio Bejarano-García et al. Cell Death Dis. .

Abstract

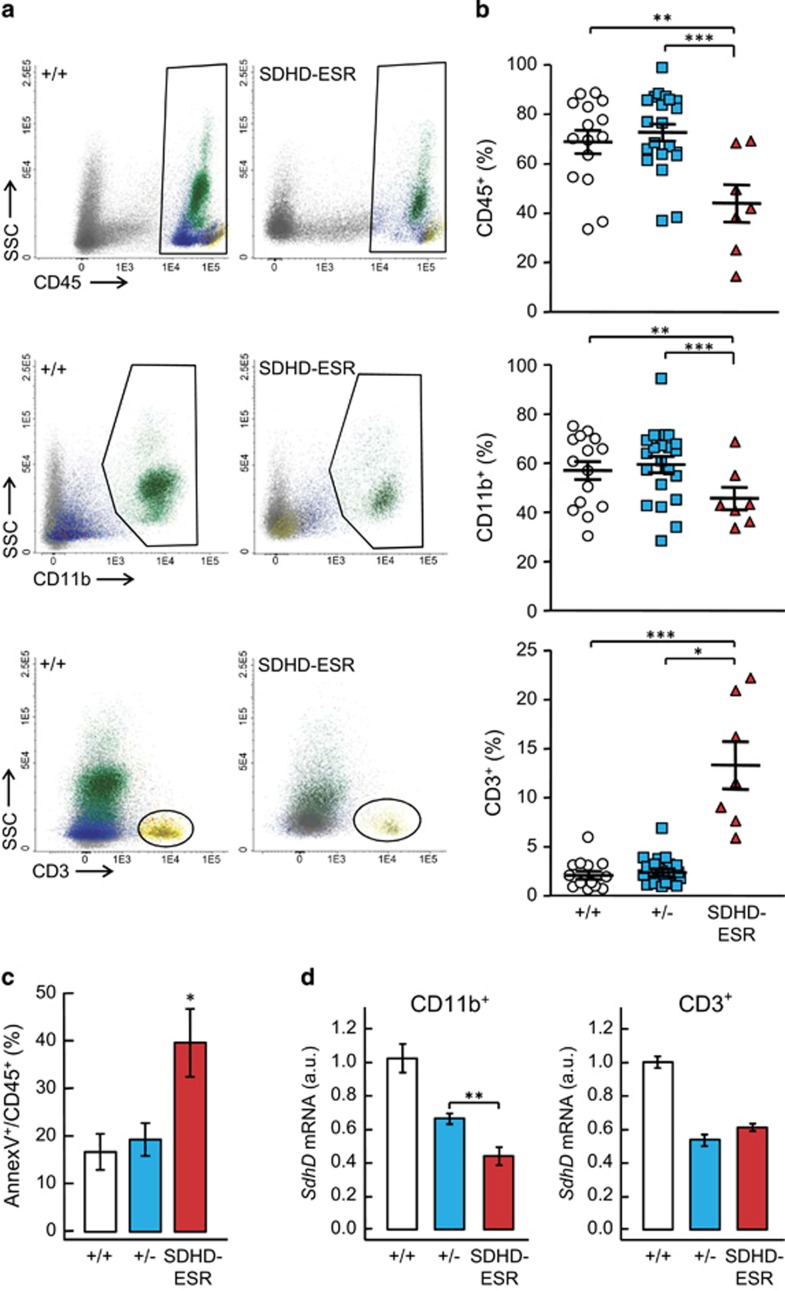
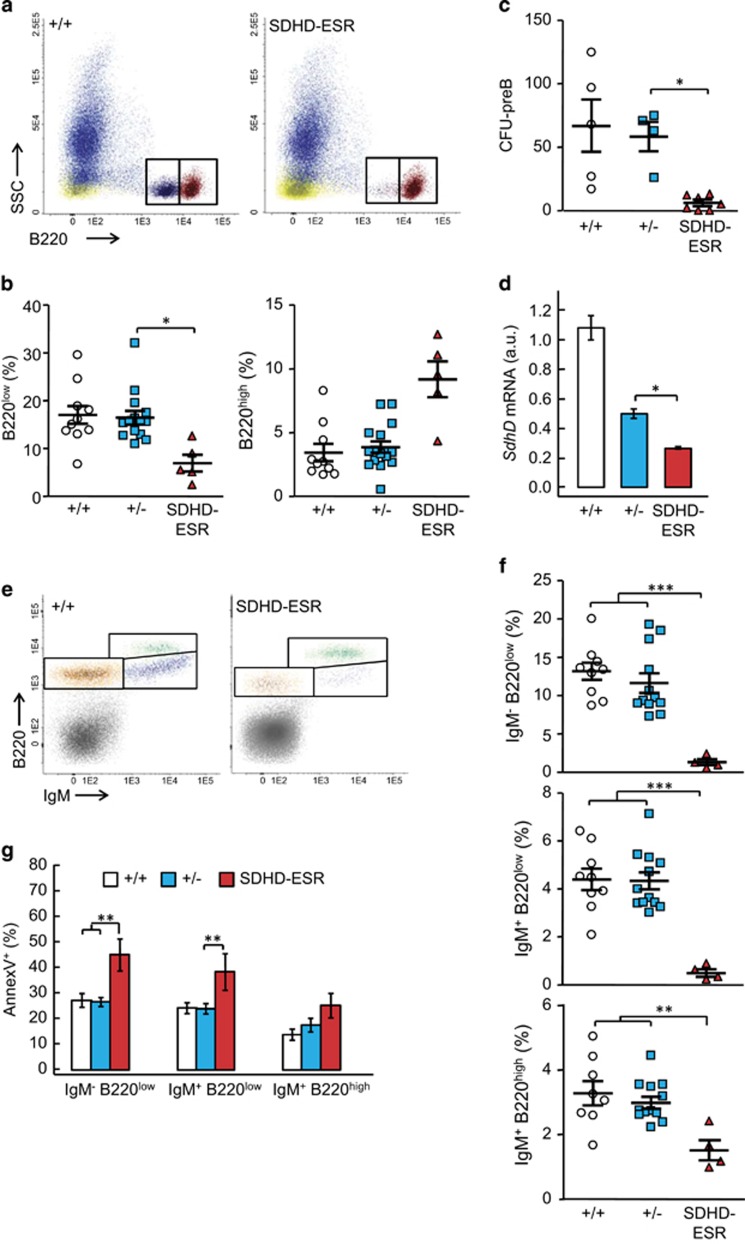
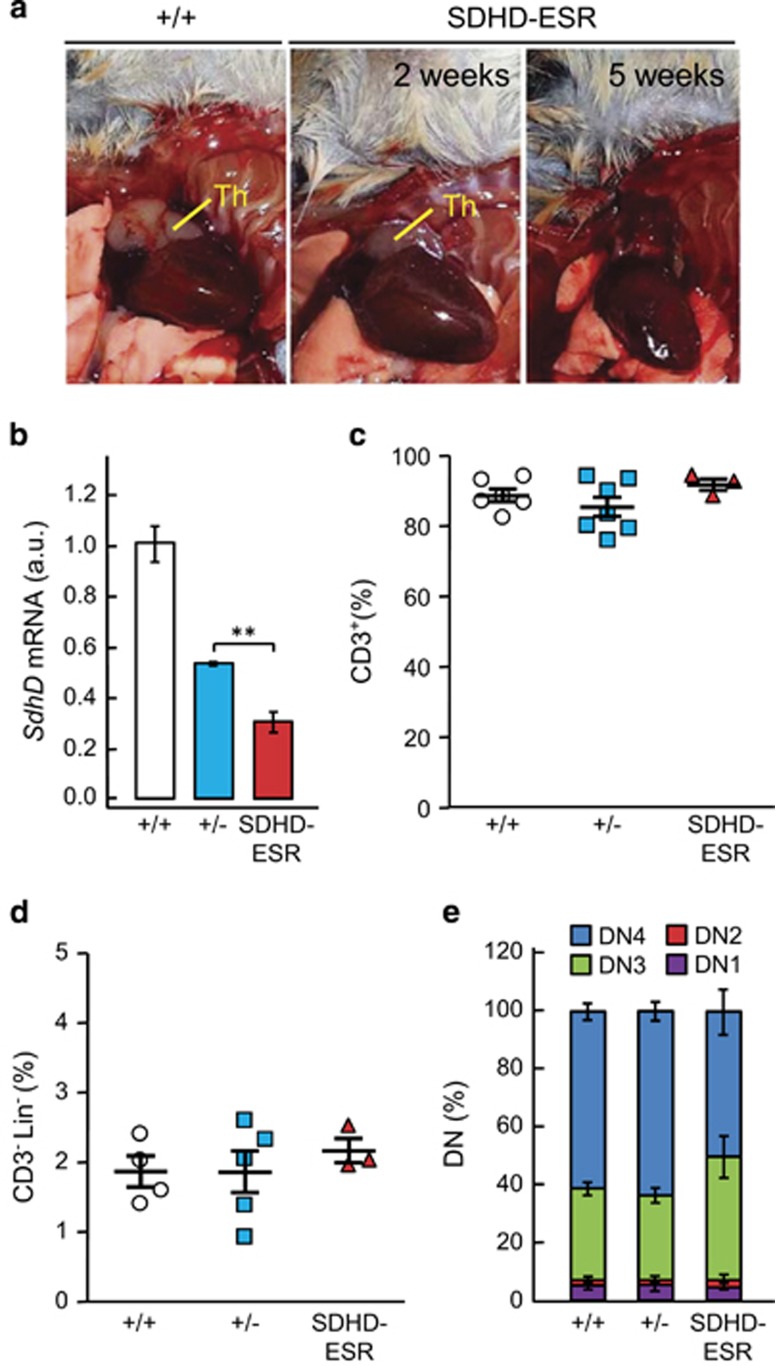
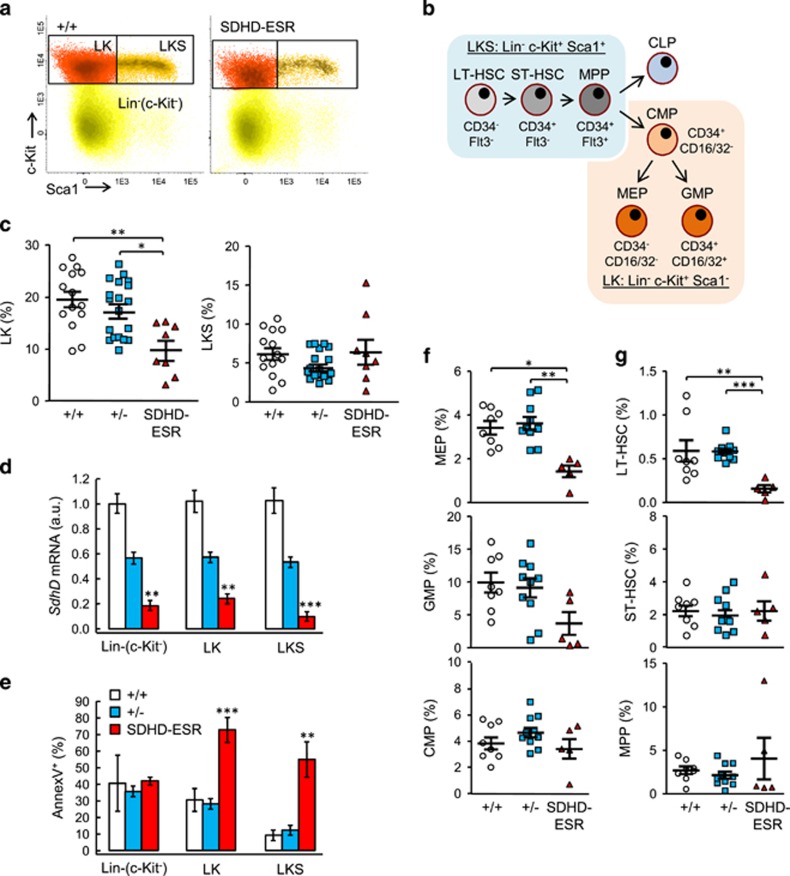
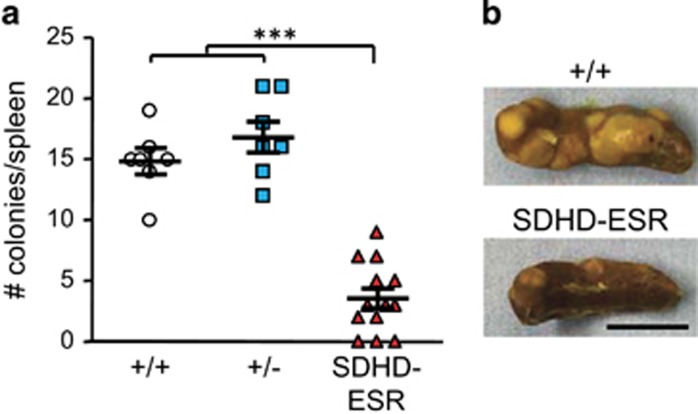
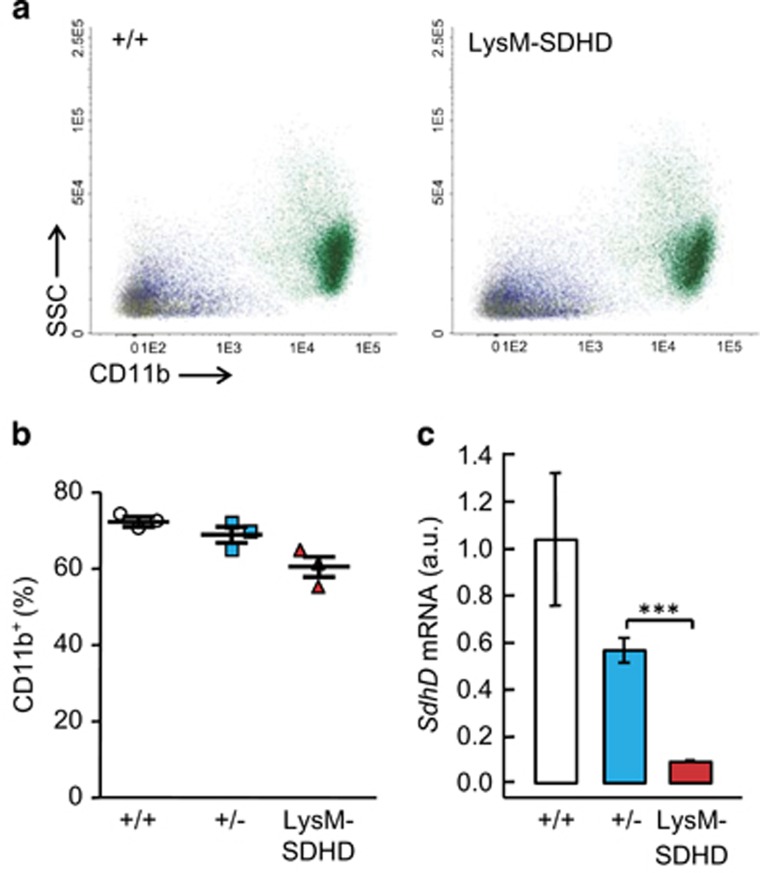
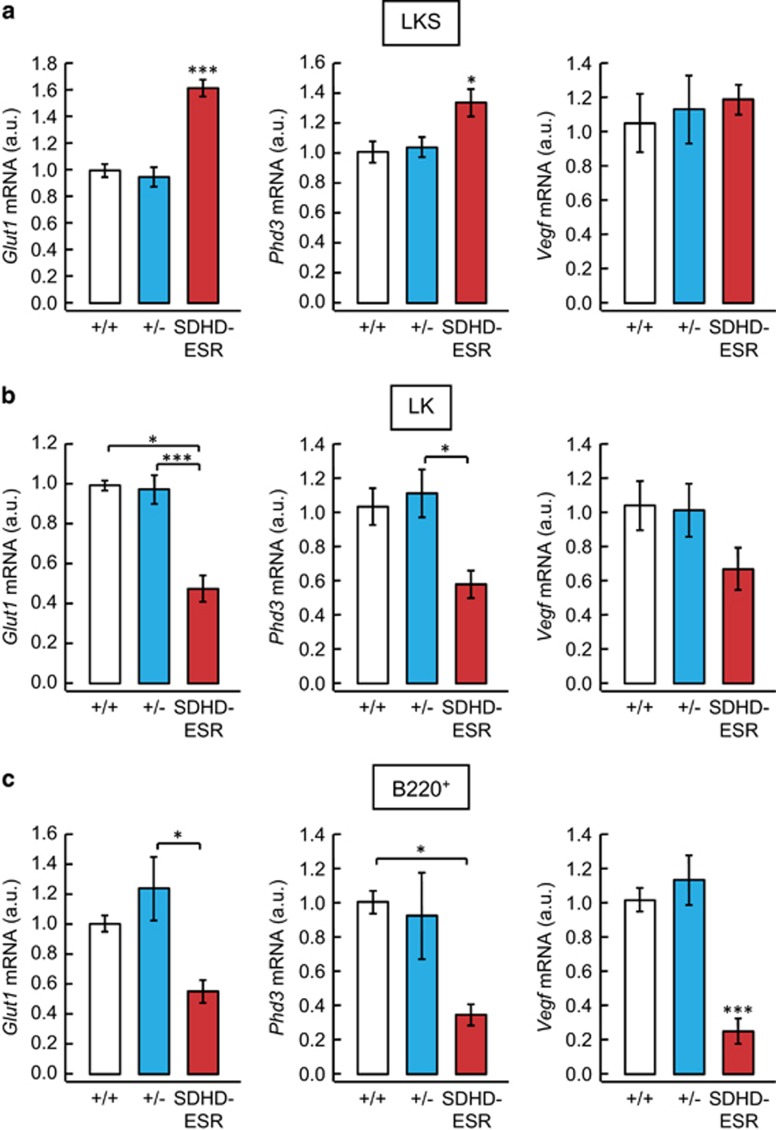
It is established that hematopoietic stem cells (HSC) in the hypoxic bone marrow have adapted their metabolism to oxygen-limiting conditions. This adaptation includes suppression of mitochondrial activity, induction of anerobic glycolysis, and activation of hypoxia-inducible transcription factor 1α (Hif1α)-dependent gene expression. During progression of hematopoiesis, a metabolic switch towards mitochondrial oxidative phosphorylation is observed, making this organelle essential for determining cell fate choice in bone marrow. However, given that HSC metabolism is essentially oxygen-independent, it is still unclear whether functional mitochondria are absolutely required for their survival. To assess the actual dependency of these undifferentiated cells on mitochondrial function, we have performed an analysis of the hematopoiesis in a mouse mutant, named SDHD-ESR, with inducible deletion of the mitochondrial protein-encoding SdhD gene. This gene encodes one of the subunits of the mitochondrial complex II (MCII). In this study, we demonstrate that, in contrast to what has been previously established, survival of HSC, and also myeloid and B-lymphoid progenitors, depends on proper mitochondrial activity. In addition, gene expression analysis of these hematopoietic lineages in SDHD-ESR mutants calls into question the proposed activation of Hif1α in response to MCII dysfunction.


Figures

Figure 1
Figure 1
Analysis of leukocytes in bone marrow of SDHD-ESR mice. Bone marrow cell preparations were labeled with antibodies against the common leukocyte antigen, CD45; granulocyte- and monocyte-specific, CD11b antigen; and T-cell-specific CD3 antigen, for the detection by flow cytometry. (a) Representative dot-plots of total BM cells labeled with CD45, CD11b, and CD3 markers from SdhDflox/+ (+/+) and SdhDflox/ CRE (SDHD-ESR) individuals. For simplicity, the SdhDflox/ (+/−) animal is omitted as it displays the same phenotype as the +/+ control. Populations are also distinguishable by colors. SSC, side-scattered component. (b) Quantification of CD45+ leukocytes relative to the total number of events, and granulocyte/macrophage and T cells relative to total CD45+ cells. Each symbol represents data from a single animal. (c) Percentage of Annexin V+ events in CD45+ population. N=7–17 per genotype. (d) Relative SdhD mRNA levels in granulocytes and monocytes/macrophages (CD11b+) and T cells (CD3+). N=6–11 per genotype. Bars represent the mean values±S.E.M. Statistical significance: *P⩽0.05; **P⩽0.01; ***P⩽0.001. a.u., arbitrary units
Figure 2
Figure 2
Analysis of B cells in bone marrow of SDHD-ESR mice. Bone marrow cell preparations were labeled with an antibody against the B-cell-specific antigens, B220 and IgM. (a) Representative flow cytometry dot-plots of CD45+ BM cells labeled with anti-B220 marker from +/+ and SDHD-ESR individuals. Two distinct B220+ populations, enclosed in rectangles, can be distinguished based on its high (B220high) or low (B220low) expression of the marker. (b) Quantification of B220low and B220high cells relative to the total number of CD45+ events. (c) Number of colony-forming units from B-cell precursors (CFU-preB) per 105 cells seeded. Each dot is the average result of two different cultures from each animal. (d) Relative SdhD mRNA levels in total B220+ population N=3–11 per genotype. (e) Representative flow cytometry dot-plots of total BM cells expressing B220 and IgM markers from +/+ and SDHD-ESR individuals. Three distinct B220+ populations can be distinguished based on IgM and high (B220high) or low (B220low) B220 expression of the marker corresponding to three stages of maturation: pro-B-cell (IgM B220low), intermediate precursor (IgM+ B220low) and mature B-cell (IgM+ B220high). (f) Quantification of number of cells in each maturation stage relative to the total number of cells. (g) Percentage of Annexin V+ events in each maturation stage. N=4–10 per genotype. Bars represent the mean values±S.E.M. Statistical significance: *P⩽0.05; **P⩽0.01; ***P⩽0.001
Figure 3
Figure 3
Analysis of T cells in thymus of SDHD-ESR mice at different maturation stages. (a) Photographs of thymi (Th) from +/+ and SDHD-ESR individuals at 2 and 5 weeks after tamoxifen treatment. Note the complete disappearance of the mutant organ after 5 weeks. (b) Relative SdhD mRNA levels in the whole organ. N=3–5 per genotype and group. (c) Quantification of T cells (CD3+) relative to the total number of events. (d) Quantification of undifferentiated thymocytes (Lin CD3) relative to the total number of events. (e) Percentages of cells at different maturation stages, from double-negative (DN)1 to DN4, within the Lin CD3 fraction. DN1 to DN4 were defined by the expression of CD44 and CD25 markers (more details in the text). N=3–7 per genotype. Bars represent the mean values±S.E.M. Statistical significance: **P⩽0.01
Figure 4
Figure 4
Analysis of hematopoietic stem (HSC) and progenitor (HPC) cells in bone marrow of SDHD-ESR mice. The lineage negative (Lin) cell fraction was identified as described in the ‘Materials and Methods' section. The Lin cells were labeled with antibodies against c-Kit, Sca1, CD34, CD16/32, and Flt3 antigens for detection by flow cyometry. (a) Representative dot-plots of Lin fractions from +/+ and SDHD-ESR individuals. Rectangles indicate Lin c-Kit+ Sca1 (LK) and Lin c-Kit+ Sca1+ (LKS) populations, also distinguishable by colors. (b) Diagram showing the cell types differentiated within LKS and LK populations as well as their immunophenotypes based on the expression of CD34, Flt3, and CD16/32 markers. (c) Quantification of LK and LKS cells relative to the total number of Lin events. (d) Relative SdhD mRNA levels in each subpopulation of the Lin fraction. N=5–16 per genotype and population. (e) Percentage of Annexin V+ events in each subpopulation. N=3–9 per genotype and population. Quantification of subpopulations contained in LK (f) and LKS (g) fractions relative to the total number of Lin events by flow cytometry with the corresponding antibodies (see the ‘Materials and Methods' section). CLP, common lymphoid progenitors; CMP, common myeloid progenitor; GMP, granulocyte/monocyte progenitor; LT-HSC, long-term HSC; MEP, megakaryocyte/erythroid progenitor; MPP, multipotent progenitors; ST-HSC, short-term HSC. Bars represent the mean values±S.E.M. Statistical significance: *P⩽0.05; **P⩽0.01; ***P⩽0.001
Figure 5
Figure 5
Colonies in spleen assay for detection of functional HSC. (a) Number of colonies in spleen per animal transplanted with bone marrow cells from two to three donors per genotype. (b) Representative photographs of spleens from receptors grafted with +/+ and SDHD-ESR BM cells. Bar size: 5 mm. Bars represent the mean values±S.E.M. Statistical significance: ***P⩽0.001
Figure 6
Figure 6
Analysis of granulocyte and monocytes in bone marrow of LysM-SDHD mice. Bone marrow cell preparations were labeled with antibodies against the common leukocyte antigen CD45, and granulocyte- and monocyte-specific CD11b; antigens for detection by flow cyometry. (a) Representative dot-plots of total BM cells labeled with antibodies against CD45 and CD11b markers from +/+ and SDHD-ESR individuals. SSC, side-scattered component. (b) Quantification of CD11b+ leukocytes relative to number of CD45+ events. (c) Relative SdhD mRNA levels in CD11b+ cells. N=3 per genotype. Bars represent the mean values±S.E.M. Statistical significance: ***P⩽0.001
Figure 7
Figure 7
Relative mRNA levels of Glut1, Phd3, and Vegf genes in BM LKS (a), LK (b), and B220+ (c) cells of SDHD-ESR mice. N=3–9 per genotype. Bars represent the mean values±S.E.M. Statistical significance: *P⩽0.05; ***P⩽0.001

References

    1. Draenert K, Draenert Y. The vascular system of bone marrow. Scan Electron Microsc 1980; 4: 113–122. - PubMed
    1. Grant JL, Smith B. Bone marrow gas tensions, bone marrow blood flow, and erythropoiesis in man. Ann Intern Med 1963; 58: 801–809. - PubMed
    1. Morrison SJ, Scadden DT. The bone marrow niche for haematopoietic stem cells. Nature 2014; 505: 327–334. - PMC - PubMed
    1. Spencer JA, Ferraro F, Roussakis E, Klein A, Wu J, Runnels JM et al. Direct measurement of local oxygen concentration in the bone marrow of live animals. Nature 2014; 508: 269–273. - PMC - PubMed
    1. Danet GH, Pan Y, Luongo JL, Bonnet DA, Simon MC. Expansion of human SCID-repopulating cells under hypoxic conditions. J Clin Invest 2003; 112: 126–135. - PMC - PubMed

MeSH terms