. 2016 Dec 20;113(51):14864-14869.
doi: 10.1073/pnas.1607695114. Epub 2016 Dec 5.

UV-B photoreceptor-mediated protection of the photosynthetic machinery in Chlamydomonas reinhardtii

Affiliations

UV-B photoreceptor-mediated protection of the photosynthetic machinery in Chlamydomonas reinhardtii

Guillaume Allorent et al. Proc Natl Acad Sci U S A. .

Abstract

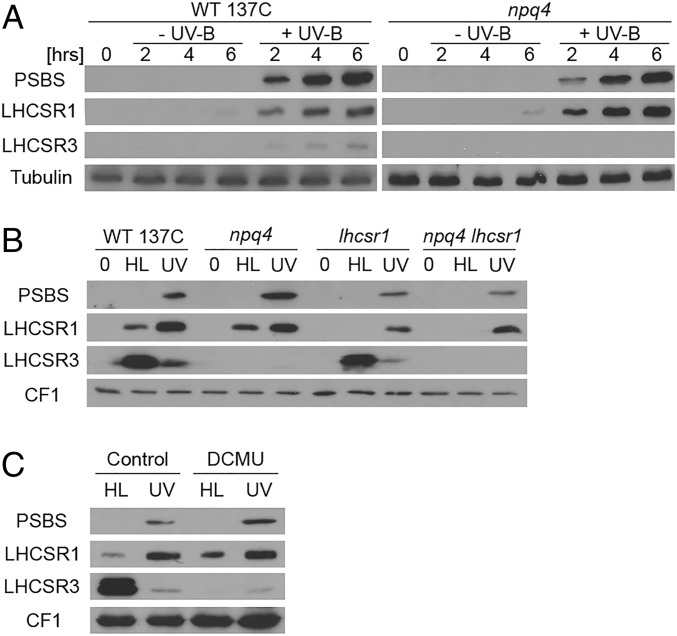
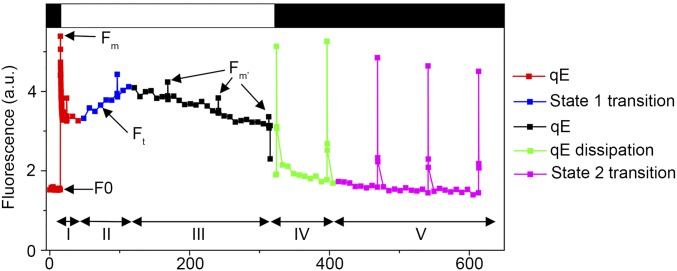
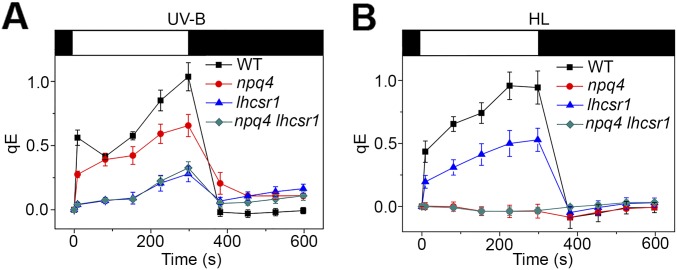
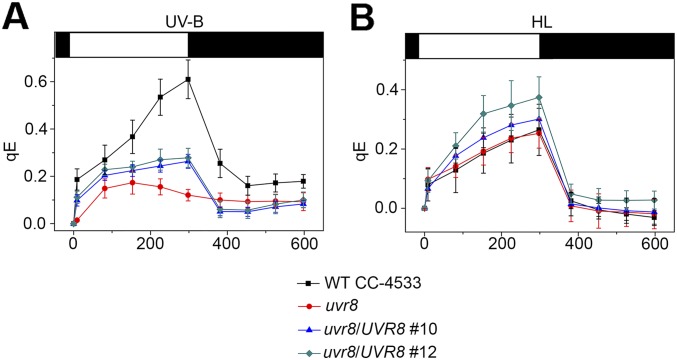
Life on earth is dependent on the photosynthetic conversion of light energy into chemical energy. However, absorption of excess sunlight can damage the photosynthetic machinery and limit photosynthetic activity, thereby affecting growth and productivity. Photosynthetic light harvesting can be down-regulated by nonphotochemical quenching (NPQ). A major component of NPQ is qE (energy-dependent nonphotochemical quenching), which allows dissipation of light energy as heat. Photodamage peaks in the UV-B part of the spectrum, but whether and how UV-B induces qE are unknown. Plants are responsive to UV-B via the UVR8 photoreceptor. Here, we report in the green alga Chlamydomonas reinhardtii that UVR8 induces accumulation of specific members of the light-harvesting complex (LHC) superfamily that contribute to qE, in particular LHC Stress-Related 1 (LHCSR1) and Photosystem II Subunit S (PSBS). The capacity for qE is strongly induced by UV-B, although the patterns of qE-related proteins accumulating in response to UV-B or to high light are clearly different. The competence for qE induced by acclimation to UV-B markedly contributes to photoprotection upon subsequent exposure to high light. Our study reveals an anterograde link between photoreceptor-mediated signaling in the nucleocytosolic compartment and the photoprotective regulation of photosynthetic activity in the chloroplast.

Keywords: LHCSR1; PSBS; UV-B photoreceptor; nonphotochemical quenching; photoprotection.


Conflict of interest statement

The authors declare no conflict of interest.

Figures

Fig. 1.
Fig. 1.
UV-B and high light induce distinct patterns of qE-related proteins. (A) Immunoblot analysis of PSBS, LHCSR1, and LHCSR3 protein levels in the WT (WT 137C) and npq4 mutant exposed to UV-B (+UV-B) for 2, 4, and 6 h or not exposed (−UV-B; protected by a UV-B–absorbing long-pass filter). Tubulin levels are shown as loading control. (B) Immunoblot analysis of PSBS, LHCSR1, and LHCSR3 protein levels in WT, npq4, lhcsr1, and npq4 lhcsr1 before treatment (0) and after exposure for 6 h to high light (HL) or to UV-B (UV). (C) Immunoblot analysis of PSBS, LHCSR1, and LHCSR3 protein levels in WT in the presence or absence of the photosynthetic electron transport inhibitor dichlorophenyl-dimethylurea (DCMU; 5 µM). (B and C) ATPase (CF1) levels are shown as loading control.
Fig. S1.
Fig. S1.
Expression of qE-related proteins under strong high light. Immunoblot analysis of PSBS, LHCSR1, and LHCSR3 protein levels in the WT (WT 137C) and the npq4, lhcsr1, and npq4 lhcsr1 mutants exposed for 6 h to UV-B or to high light (HL; 900 µmol⋅m−2⋅s−1). Tubulin levels are shown as loading control. Note that after the high-light treatment, the maximum quantum yield of PSII (Fv/Fm) drops to 0.309 ± 0.014 (n = 4) in npq4, indicative of photodamage.
Fig. 2.
Fig. 2.
UV-B induces the capacity for qE. The qE component of NPQ was determined by chlorophyll fluorescence measurements in the presence (red circles) or absence (black squares) of 10 µM nigericin. Dark-adapted cells (black bar at top) were exposed to strong light for 300 s (750 µmol⋅m−2⋅s−1; white bar) and then returned to the dark (dark bar). Fluorescence (relative units; r.u.) was monitored continuously (open symbols) and during saturating flashes (2,500 µmol⋅m−2⋅s−1 at 60-s intervals; filled symbols). (A and B) WT (WT 137C) (A) and npq4 (B) after exposure for 6 h to UV-B. (C and D) WT (C) and npq4 (D) after exposure for 6 h to high light (HL). (E and F) qE values after 2, 4 or 6 h of exposure to UV-B (+UV-B) or without exposure (−UV-B) and after 6 h of exposure to high light (HL). Means ± SD are shown (n = 3) for qE calculated at the end of the actinic light treatment. (G) qE values after 6-h exposure of the WT and in mutants npq4, lhcsr1 and npq4 lhcsr1 to UV-B or to high light (HL). Means ± SD are shown (n = 4 for HL; n = 6 for UV samples).
Fig. S2.
Fig. S2.
Five distinguishable phases in the fluorescence dynamics of Chlamydomonas cells. The kinetics of the WT + UV-B sample of Fig. 2A (without nigericin) is reproduced here as an illustration. Fluorescence dynamics were evaluated by using a chlorophyll fluorescence imaging system (Fluorcam; Photon Systems Instruments). The protocol included a dark preadaptation period of 5 min, a period of strong light (white bar; 5 min; 750 µmol⋅m−2⋅s−1) followed by a period of relaxation in the dark (black bar; 5 min). Maximal chlorophyll fluorescence was measured with saturating flashes (2,500 µmol⋅m−2⋅s−1) at regular 60-s intervals (to measure Fm at the end of the dark preadaptation and Fm′ during light exposure). Chlorophyll fluorescence was also monitored throughout the experiment (Fo after the dark preadaptation, Ft in the light). The approximate time ranges of the successive phases attributed to the qE and qT components of NPQ upon light exposure are indicated at the bottom of the panels with roman numerals IV as described (33). The predominant component in each of the five phases is also highlighted in color according to the key shown in the box on the right. Upon exposure to strong light, the fast initial quenching of Fm′ is due to qE (phase I), followed by a transient increase due to a counteracting qT transition toward state 1 (phase II). When this state transition saturates, the qE component becomes more prevalent again, and Fm′ decreases (phase III). During the subsequent dark period, a rapid rise of the Fm′ peaks corresponds to the fast relaxation of qE (phase IV), followed by a Fm′ decrease due to a slower qT transition toward state 2 (phase V). a.u., arbitrary units.
Fig. S3.
Fig. S3.
Time course of qE induction in Chlamydomonas WT 137C, npq4, lhcsr1, and npq4 lhcsr1 cultures that had been exposed for 6 h to UV-B (A) or high light (B). The qE component of NPQ was determined by chlorophyll fluorescence measurements in the presence or absence of nigericin as described in Fig. 2.
Fig. S4.
Fig. S4.
Constitutive PSBS expression suppresses the reduced qE phenotype of the npq4 mutant after UV-B exposure. (A) Sequence of the PSBS1 protein with the transit peptide predicted by the PredAlgo algorithm shown in red. It should be noted that the two paralogous genes PSBS.1 and PSBS.2 of C. reinhardtii encode proteins that differ in only one residue (at position 28). (B) Synthetic sequence of the psbS transgene excluding the predicted transit peptide, optimized for the codon use of the C. reinhardtii chloroplast. (C) Map of the transgene inserted in the inverted repeat of the chloroplast genome. Expression of the psbS sequence is driven by the psaA promoter/5′ UTR and by the rbcL 3′ UTR. The selection marker atpA::aadA::rbcL confers resistance to spectinomycin. The primers used for genotyping (AG1, AG2, and AG3) are indicated by arrows below the map. (D) Genotyping of psaA::psbS transformants in the npq4 nuclear background. DNA extracts from eight independent transformants (nos. 1–8) served as template for PCR amplification with the primers AG1/AG2 or AG1/AG3 (the products are loaded in alternate lanes of the agarose gel used for electrophoresis). AG1: 5′-GTC GTG GAG TAT TTA ATA CAG C-3′; AG2: ​5′-GAC TTG TTG GTA AAA CTG C-3′; AG3: 5′-GCT TTT GTT CCC TTT AGT G-3′. The PCR of the untransformed npq4 mutant is shown as a control. PCR of an 80-fold dilution of the npq4 template (npq4/80) indicates that even a single copy of the untransformed genome would have been detected had the transformants been heteroplasmic (each Chlamydomonas cell harbors a single chloroplast containing ∼80 copies of the chloroplast genome). This analysis shows that lines 1, 2, 4, 6, and 7 were homoplasmic. (E) Cultures of untransformed npq4 and psaA::psbS transformants in the npq4 background were grown in acetate-containing medium (Tris acetate phosphate) under dim white light (10 µmol⋅m−2⋅s−1). Total proteins were extracted and analyzed by SDS/PAGE and immunoblotting with antisera against PSBS or tubulin as a control. (F and G) Immunodetection of PSBS (F) and LHCSR1 (G) in npq4 and psaA::psbS transformant no. 4 exposed to UV-B for 6 h. Increasing protein amounts of npq4/psaA::psbS (F) or npq4 (G) are loaded to show the linearity of the detection. CF1 (ATPase) is shown as a loading control. (H) qE values in npq4 (n = 6) and npq4/psaA::psbS strains (n = 5) after 6-h UV-B exposure. (I) Time course of qE induction in npq4 (n = 6) and npq4/psaA::psbS (n = 5) after 6 h UV-B exposure. (J) Cultures of npq4 and npq4/psaA::psbS (grown in minimal medium and not exposed to UV-B, because PSBS expression is constitutive in the latter strain) were photographed (t = 0), exposed to high light (1,000 µmol⋅m−2⋅s−1) for 5 h, and photographed again (t = 5 h). Constitutive overexpression of PSBS leads to a delay in photobleaching. Data shown are representative of four independent biological repetitions.
Fig. S5.
Fig. S5.
UV-B induces violaxanthin accumulation. The xanthophyll pigments were analyzed in WT 137C in growth conditions (0; n = 3), after 6 h high light (HL; n = 2) and in cells exposed to UV-B for 6 h (+UV-B; n = 3) or not exposed (−UV-B; n = 3). An additional sample was collected at the end of the 5-min high-light period used for the measurement of qE after 6-h exposure to UV-B (+ UV-B + 5 min HL). (A) Relative violaxanthin content (normalized to β-carotene). (B) Deepoxidation ratio [DES; evaluated as zeaxanthin/(zeaxanthin + violaxanthin); antheraxanthin levels were negligible]. (C) Relative violaxanthin content, with or without UV-B exposure, in the WT and in two biological replicates (A and B) of the npq4 lhcsr1 double mutant.
Fig. 3.
Fig. 3.
UVR8 is required for the UV-B response leading to enhanced qE. (A) Immunoblot analysis of UVR8 in the WT (WT CC-4533), uvr8, and two independent uvr8/UVR8 complemented lines (nos. 10 and 12). (B) Immunoblot analysis of PSBS, LHCSR1, and LHCSR3 protein levels in the WT, uvr8, and complemented lines in normal growth conditions (0) or after 6-h exposure to UV-B (UV). The ATPase (CF1) levels are shown as loading control. (C) The quantum yield of PSII (Fv/Fm) was monitored in the WT, uvr8, and complemented strains exposed for 6 h to UV-B or to high light (HL). Note that Fv/Fm of untreated uvr8 was comparable to WT: uvr8 = 0.760 ± 0.022; WT = 0.745 ± 0.017; n = 4. (D) Quantitative RT-PCR analysis of PSBS, LHCSR1, and LHCSR3 RNA expression after 1-h UV-B exposure of the WT, uvr8, and uvr8/UVR8 complemented line (no. 10). (E) qE values in the WT, uvr8, and complemented lines (nos. 10 and 12) exposed for 6 h to UV-B or to high light (HL). Note that CC-4533 has a lower qE after HL than the other WT strains used in this work. (F) Immunoblot analysis of PSBS, LHCSR1, and LHCSR3 in WT (CC-4533) and uvr8 in normal growth conditions (0) or after exposure to UV-B (UV) or for 4 h to high light (HL). The ATPase (CF1) levels are shown as loading control.
Fig. S6.
Fig. S6.
The UVR8 dimer monomerizes under UV-B. Immunodetection of UVR8 in uvr8 and cop1hit1 and their respective WTs (CC-4533 and CC-124) exposed (+) or not (−) to UV-B for 1 h. Nondenatured protein samples (Upper) or boiled samples (Lower) were loaded for each strain. Stars indicate a nonspecific band.
Fig. S7.
Fig. S7.
Time course of qE induction in Chlamydomonas WT CC-4533, uvr8, and rescued lines (uvr8/UVR8 10 and 12) cultures that had been exposed for 6 h to UV-B (A) or high light (B). The qE component of NPQ was determined by chlorophyll fluorescence measurements in the presence or absence of nigericin as described in Fig. S1. Note that in the uvr8 mutant after UV-B (A; red), the residual signal does not show a fast reversibility in the dark, which would be expected for a true qE response as observed in the WT and the rescued lines.
Fig. S8.
Fig. S8.
COP1 is required for the UV-B response leading to enhanced qE. (A) Immunoblot analysis of PSBS, LHCSR1, and LHCSR3 in WT (WT CC-124), cop1hit1, and cop1hit1/COP1 complemented strains (nos. 157 and 166) exposed for 6 h to UV-B. Tubulin levels are shown as loading control. (B) Quantitative RT-PCR analysis of PSBS, LHCSR1, and LHCSR3 RNA expression after 1 h of UV-B exposure in the WT, cop1hit1, and cop1hit1/COP1 complemented strain (no. 166). Data are normalized to levels in the WT in growth conditions (0). CNRQ, calibrated normalized relative quantities. (C) qE values after 6-h UV-B exposure in the WT, cop1hit1, and cop1hit1/COP1 complemented strains (nos. 157 and 166).
Fig. 4.
Fig. 4.
UV-B acclimation promotes photoprotection. (A) The maximum quantum yield of PSII was monitored in cell cultures of WT (WT CC-4533), uvr8, and uvr8/UVR8 complemented line 10 that had been previously exposed for 16 h to UV-B (Fv/Fm +UV) or were left untreated (Fv/Fm –UV). The effect of acclimation is expressed as the ratio (Fv/Fm +UV)/(Fv/Fm –UV) (error bars represent the SEM; n = 5) measured at the end of acclimation (0) and after a subsequent high-light treatment (1 h, 700 µmol⋅m−2⋅s−1). (B) Cell cultures that had been exposed for 16 h to UV-B (+UV) or untreated controls (−UV) were photographed (t = 0) and then exposed to high light (1,000 µmol⋅m−2⋅s−1) for 5 h and photographed again (t = 5 h). Data shown are representative of three independent biological repetitions. (C and D) As A and B, but for the WT (WT 137C) and mutants npq4, lhcsr1, and npq4 lhcsr1. (C) Error bars represent the SEM; n = 3. (D) Data shown are representative of three independent biological repetitions. (E) Scheme of photoreceptor-mediated photoprotection of the photosynthetic machinery after UV-B exposure compared with high light.
Fig. S9.
Fig. S9.
Specificity of the anti-PSBS antibodies assayed by peptide competition. Immunoblot analysis of protein extracts from WT cells treated with UV-B for 6 h (+UV) to induce the expression of endogenous PSBS or left untreated (−UV). The blots were probed with anti-PSBS antibodies only (−) or in competition with the peptide used for immunization (Pep 93: C+AINEGSGKFVDEESA, corresponding to CrPSBS231–245) or of a control peptide (Pep 94: C+DTISERPAGPLQDPR, corresponding to CrPSBS140–154) (both 7 μg⋅mL−1). Pep 93, but not the Pep 94 control, efficiently prevents binding of the antibodies to PSBS.

References

    1. Li Z, Wakao S, Fischer BB, Niyogi KK. Sensing and responding to excess light. Annu Rev Plant Biol. 2009;60:239–260. - PubMed
    1. Erickson E, Wakao S, Niyogi KK. Light stress and photoprotection in Chlamydomonas reinhardtii. Plant J. 2015;82(3):449–465. - PubMed
    1. Minagawa J, Tokutsu R. Dynamic regulation of photosynthesis in Chlamydomonas reinhardtii. Plant J. 2015;82(3):413–428. - PubMed
    1. Niyogi KK, Truong TB. Evolution of flexible non-photochemical quenching mechanisms that regulate light harvesting in oxygenic photosynthesis. Curr Opin Plant Biol. 2013;16(3):307–314. - PubMed
    1. Wobbe L, Bassi R, Kruse O. Multi-level light capture control in plants and green algae. Trends Plant Sci. 2016;21(1):55–68. - PubMed

Publication types

MeSH terms

Substances

LinkOut - more resources