. 2016 Dec 20;113(51):E8286-E8295.
doi: 10.1073/pnas.1612024114. Epub 2016 Dec 5.

miR-17∼92 family clusters control iNKT cell ontogenesis via modulation of TGF-β signaling

Affiliations

miR-17∼92 family clusters control iNKT cell ontogenesis via modulation of TGF-β signaling

Maya Fedeli et al. Proc Natl Acad Sci U S A. .

Abstract

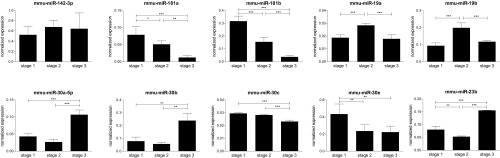
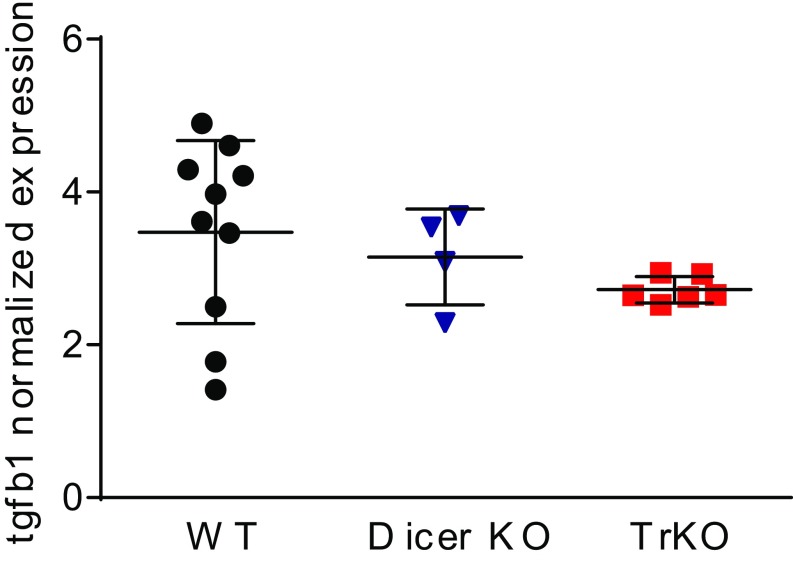
Invariant natural killer T cells (iNKT) cells are T lymphocytes displaying innate effector functions, acquired through a distinct thymic developmental program regulated by microRNAs (miRNAs). Deleting miRNAs by Dicer ablation (Dicer KO) in thymocytes selectively impairs iNKT cell survival and functional differentiation. To unravel this miRNA-dependent program, we systemically identified transcripts that were differentially expressed between WT and Dicer KO iNKT cells at different differentiation stages and predicted to be targeted by the iNKT cell-specific miRNAs. TGF-β receptor II (TGF-βRII), critically implicated in iNKT cell differentiation, was found up-regulated in iNKT Dicer KO cells together with enhanced TGF-β signaling. miRNA members of the miR-17∼92 family clusters were predicted to target Tgfbr2 mRNA upon iNKT cell development. iNKT cells lacking all three miR-17∼92 family clusters (miR-17∼92, miR-106a∼363, miR-106b∼25) phenocopied both increased TGF-βRII expression and signaling, and defective effector differentiation, displayed by iNKT Dicer KO cells. Consistently, genetic ablation of TGF-β signaling in the absence of miRNAs rescued iNKT cell differentiation. These results elucidate the global impact of miRNAs on the iNKT cell developmental program and uncover the targeting of a lineage-specific cytokine signaling by miRNAs as a mechanism regulating innate-like T-cell development and effector differentiation.

Keywords: CD1d; NKT cells; TGF-β; development; miRNA.


Conflict of interest statement

The authors declare no conflict of interest.

Figures

Fig. 1.
Fig. 1.
iNKT and T-cell transcriptome in presence or absence of Dicer. (A) Thymic HSAlow iNKT and TCR-βhigh SP T cells were sorted from 4-wk-old Dicer KO and Dicer(lox/lox) WT littermate mice. In Dicer WT mice, stages 1 and 2 iNKT cells were pooled together (iNKT 1–2 WT), separated from stage 3 iNKT cells (iNKT 3 WT). In Dicer KO mice, sorted iNKT cells were collected in a single sample (iNKT KO cells). (B) Principal component analysis of microarray data were made on normalized expression levels of expressed genes in the array (detection P value 0.01 in at least one sample). A three-dimensional visualization of the first three principal components is shown. The first three principal components accounted for the 79% of explained variance and clustered apart samples. (C) Differentially expressed genes in the indicated samples were analyzed in biological triplicates of Illumina beadchip arrays. Significantly expressed genes were identified by Limma analysis with a 5% FDR threshold. The graph shows the number and percentage of up- and down-modulated genes in each biological comparison within 8,357 total genes. (D–F) Volcano plots showing magnitude of change of the genes differentially expressed in the indicated samples and statistical significance. Genes represent a subset of the statistically significant differentially expressed genes. (G) Venn diagram depicting overlapping genes differentially expressed in the indicated comparisons.
Fig. 2.
Fig. 2.
Genes differentially expressed between KO iNKT cells and stage 1–2 WT iNKT cells. The heatmaps of the hierarchical clustering of the 255 genes differentially expressed between iNKT KO cells and stage 1–2 iNKT WT cells with adjusted P < 0.05 (Benjamini correction). Red in the red/blue scale color indicates higher expression. (A) The heatmap contains the genes up-regulated either in iNKT KO cells compared with both iNKT 3 and iNKT 1–2 WT samples (black cluster), or in both iNKT KO and iNKT 3 WT cells compared with iNKT 1–2 WT ones (red cluster). Solid boxes on the right show predicted targeting of the 3′UTR contained in each gene by the miRNAs (grouped by families) expressed by thymic iNKT cells. Black or red boxes indicate one or two miRNA seeds in the 3′UTR of the target gene, respectively. (B) The heatmap contains the genes that are down-regulated either in both iNKT KO and iNKT 3 WT cells compared with iNKT 1–2 WT cells (red cluster), or in iNKT KO cells compared with both iNKT 3 and iNKT 1–2 WT cells (black cluster). Solid boxes on the right show the predicted miRNA targeting of each differentially expressed gene as in A.
Fig. S1.
Fig. S1.
Hierarchical clustering of genes differentially expressed between iNKT KO cells and stage 1–2 iNKT WT cells. Heatmap of 255 genes differentially expressed between KO iNKT cells and stage 1–2 WT iNKT cells, with adjusted P < 0.05 (Benjamini correction), as in Fig. 2. Red in the red-blue scale color indicates higher expression.
Fig. S2.
Fig. S2.
GOSemSim analysis highlights four clusters of gene ontologies. GOSemSim analysis showing semantic similarity among GO biological process (BP) terms. Rows and columns show the list of enriched GO BP terms derived from term enrichment analysis, performed on the genes differentially expressed between iNKT KO and iNKT 1–2 WT. The colors represent the semantic distances calculated using GOSemSim Bioconductor package. Clusters identify groups of terms sharing semantic similarity about biological processes.
Fig. 3.
Fig. 3.
TGF-βRII expression and signaling are augmented in Dicer KO iNKT cells. (A) TGF-βRII surface expression detected by flow cytometry on the indicated iNKT cell samples. (B) Intracellular phospho-SMAD2/3 (p-SMAD2/3) levels detected in the indicated iNKT cell samples. Expression histograms (Left) and calculated relative fluorescence intensity (RFI; Right) are shown. Gray filled histograms represent fluorescence-minus-one (FMO) staining controls or, in the case of p-SMAD2/3, the background staining by the secondary antibody. RFI is calculated as the ratio between samples and control staining. iNKT cells were identified as HSAlowCD1d-tetramer+TCR-β+ cells. Data representative of two to three experiments with three to four mice per experiment. Histograms data represent mean ± SD; **P ≤ 0.01; ***P ≤ 0.001 by ANOVA test.
Fig. S3.
Fig. S3.
Expression levels of miRNAs potentially involved in controlling iNKT cells among the three developmental stages. Total RNA was extracted from stage 1, 2, 3 iNKT cells that were sorted from HSAlow thymocytes of 4-wk-old C57BL/6 WT mice and submitted to qRT-PCR using oligonucleotides specific for miRNAs listed in Table 1. Data represents means of three experiments with pools of 10 mice per experiment.
Fig. 4.
Fig. 4.
Expression dynamics of Tgfbr2 transcript and predicted targeting miRNAs in thymic iNKT cells. RNA extracted from stage 1, 2, and 3 iNKT cells sorted from 4-wk-old C57BL/6 WT mice and analyzed by qRT-PCR. (A) Expression of Tgfbr2 transcripts. (B) Schematic representation of Tgfbr2 3′UTR and miRNAs expressed by thymic iNKT cells that were predicted to target it. (C) Expression of the members of the miR-17∼92 family clusters that were predicted targeting (black) or not targeting (gray) Tgfbr2. (D) Expression of miR-21a-5p and miR-23-3p. (E) Representation of all miRNAs belonging to miR-17∼92 family clusters and their seed sequences. Data show one representative experiment of three, with pools of 10 mice per experiment. Histogram data represent mean ± SD; *P ≤ 0.05; **P ≤ 0.01; ***P ≤ 0.001 by ANOVA test.
Fig. 5.
Fig. 5.
Defective iNKT cell maturation in miR-17∼92, miR-106a∼363, and miR-106b∼25 triple KO mice. Thymic iNKT cells from 4-wk-old WT, Dicer KO and TrKO mice were stained with the indicated mAbs and analyzed by flow cytometry. (A) Shown are the percentages of iNKT cells, subdivided in stage 1, 2, or 3 on the basis of CD44 and NK1.1 expression. (B) Frequency and absolute number of total iNKT cells or (C) stage 1, 2, and 3 iNKT cells from the indicated mice. (D) Expression of TGF-βRII or (E) Intracellular p-SMAD2/3 in iNKT cells of the indicated mice. Gray filled histograms represent FMO staining controls or, in the case of p-SMAD2/3, the staining of the secondary antibody without the primary antibody. (F) Intracellular pSMAD2/3 in WT or TrKO iNKT cells, among HSAlow thymocytes enriched from seven to nine WT or TrKO mice and stimulated for 30 min at 37 °C with αCD3/CD28 beads ± 3 ng/mL hrTGF-β1. (G) Thymic iNKT1, iNKT2, iNKT17 subsets identified by intranuclear staining for PLZF and RORγt. The statistics refer to differences between the iNKT cell subsets in Dicer KO or TrKO and WT mice. Subsets were comparable between the two KO mice. (H) Absolute numbers of iNKT1, iNKT2, iNKT17 subsets identified in G. Data are representative of more than 20 mice per group (A–C) or of two to three experiments with three to four individual mice each (D–G). Histograms and plots in F represent mean ± SD; *P ≤ 0.05; **P ≤ 0.01; ***P ≤ 0.001 by ANOVA test.
Fig. S4.
Fig. S4.
Impaired proliferation and normal survival in TrKO iNKT cells. (A) BrdU was injected intraperitoneally in 4-wk-old C57BL/6N WT and TrKO mice. After 40 min, mice were killed and total thymocytes were stained for surface markers and intracellular BrdU and 7-AAD or CaspACE. Shown is the cell cycle distribution of HSAlowTCR-β+ CD1dtet+ iNKT cells in WT and TrKO mice. The graphs represent the percentages and numbers of BrdU+ cells among the developmental stages. (B) Apoptotic CaspACE+ HSAlowTCR-β+ CD1dtet+ iNKT cells in thymi from WT and TrKO mice. The graphs represent the percentages and numbers of CaspACE+ cells among the developmental stages. Staining data are representative of two to three experiments with three to four individual mice per experiment. *P ≤ 0.05; **P ≤ 0.01; ***P ≤ 0.001; ****P ≤ 0.0001 by Student t test.
Fig. S5.
Fig. S5.
TrKO mice display the most profound iNKT cell developmental defect compared with either miR-17∼92/miR-106b∼25 or miR-106a∼363/miR-106b∼25 double KO combinations. Thymic iNKT cells from 4-wk-old WT, Dicer KO, miR-17∼92/miR-106b∼25, miR-106a∼363/miR-106b∼25, and TrKO mice were analyzed by flow cytometry. (A) Percentages of iNKT cells among HSAlow thymocytes. (B) Percentages of iNKT cells subdivided in stage 1, 2, or 3 based on CD44 and NK1.1 expression. (C) Expression of TGF-βRII in iNKT cells of the indicated mice. *P ≤ 0.05; **P ≤ 0.01; ***P ≤ 0.001; ****P ≤ 0.0001 by Student t test.
Fig. S6.
Fig. S6.
Tgfb1 expression is conserved in Dicer KO and TrKO thymocytes. RNA was extracted from single-cell suspensions obtained from thymi of WT, Dicer KO, and TrKO mice. qRT-PCR with Tgfb1-specific oligonucleotides was performed with Taqman assay; Hprt was used as endogenous control. Differences in gene expression between the three mouse strains were not statistically significant. Each symbol represents an independent mouse.
Fig. S7.
Fig. S7.
TGF-β–dependent targets are specifically modulated at stage 2 in TrKO mice iNKT cells. Total RNA was extracted from thymic stage 1, 2, and 3 iNKT cells and T cells that were sorted from 4-wk-old C57BL/6N WT or TrKO mice. Expression of indicated transcriptional targets of TGF-β signaling was assessed by qRT-PCR and depicted as fold-change value in TrKO iNKT cells compared with WT T cells or iNKT cells of the same stage (horizontal value 1). (A) Expression of targets expected to be transcriptionally down-regulated by TGF-β signaling. (B) Expression of targets expected to be transcriptionally up-regulated by TGF-β signaling. Data are representative of three experiments with pools of 10 mice per experiment. *P ≤ 0.05; **P ≤ 0.01; ***P ≤ 0.001; ****P ≤ 0.0001 by Student t test.
Fig. S8.
Fig. S8.
iNKT cells are skewed toward the iNKT2 subset. (A) iNKT1, iNKT2, and iNKT17 subsets identified by intranuclear staining for PLZF and RORγt in the thymus, spleen, liver, and lymph nodes (LN) of 8-wk-old WT and TrKO mice. (B) Percentages and absolute numbers of iNKT1, iNKT2, and iNKT17 subsets identified in A. Data are representative of two to three experiments with three to four individual mice each. Histograms and plots in B represent mean ± SD; *P ≤ 0.05; **P ≤ 0.01; ***P ≤ 0.001; ****P ≤ 0.0001 by ANOVA test.
Fig. 6.
Fig. 6.
TGF-βRII deletion in Dicer KO mice rescues iNKT cell maturation. Thymic iNKT cells from 2- to 3-wk-old Dicer KO, TGF-βRII KO, and Dicer × TGF-βRII double KO mice were stained and analyzed by flow cytometry. (A) One representative staining and (B) graphs summarizing frequency and absolute number of total iNKT cells from the indicated mice. (C) Representative staining and (D) graphs summarizing frequency and absolute number of stage 1, 2, or 3 iNKT cells, identified by the expression of CD44 and NK1.1, from the indicated mice. Histogram data represent mean ± SD. Data are representative of two to three experiments with three to four individual mice per experiment. *P ≤ 0.05; **P ≤ 0.01; ***P ≤ 0.001 by ANOVA test.

Similar articles

Cited by

References

    1. Bendelac A, Savage PB, Teyton L. The biology of NKT cells. Annu Rev Immunol. 2007;25:297–336. - PubMed
    1. Brennan PJ, Brigl M, Brenner MB. Invariant natural killer T cells: An innate activation scheme linked to diverse effector functions. Nat Rev Immunol. 2013;13(2):101–117. - PubMed
    1. Bendelac A. Selection and adaptation of cells expressing major histocompatibility complex class I-specific receptors of the natural killer complex. J Exp Med. 1997;186(3):349–351. - PMC - PubMed
    1. Pellicci DG, et al. A natural killer T (NKT) cell developmental pathway iInvolving a thymus-dependent NK1.1(-)CD4(+) CD1d-dependent precursor stage. J Exp Med. 2002;195(7):835–844. - PMC - PubMed
    1. Benlagha K, Kyin T, Beavis A, Teyton L, Bendelac A. A thymic precursor to the NK T cell lineage. Science. 2002;296(5567):553–555. - PubMed

Publication types