. 2016 Dec 20;113(51):14787-14792.
doi: 10.1073/pnas.1612158114. Epub 2016 Dec 7.

Cosmc is an X-linked inflammatory bowel disease risk gene that spatially regulates gut microbiota and contributes to sex-specific risk

Affiliations

Cosmc is an X-linked inflammatory bowel disease risk gene that spatially regulates gut microbiota and contributes to sex-specific risk

Matthew R Kudelka et al. Proc Natl Acad Sci U S A. .

Abstract

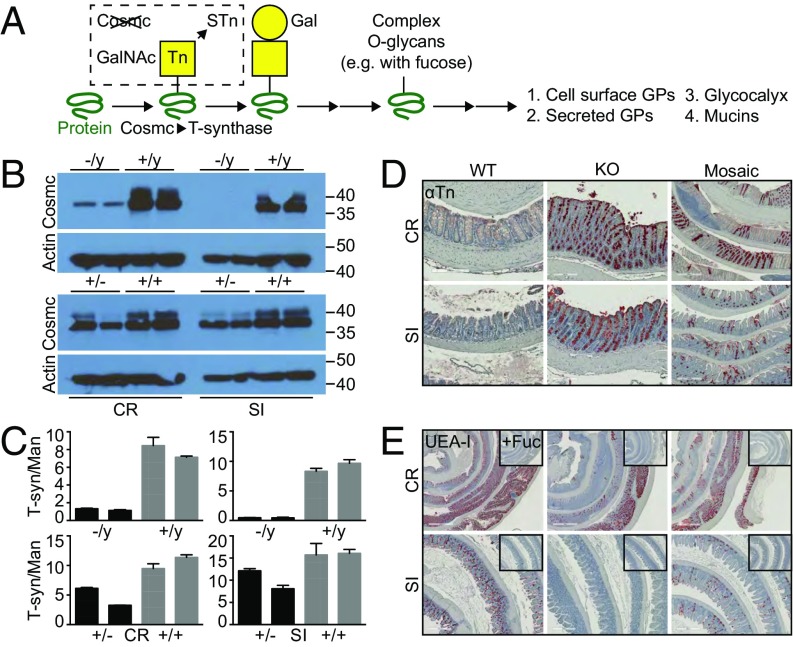
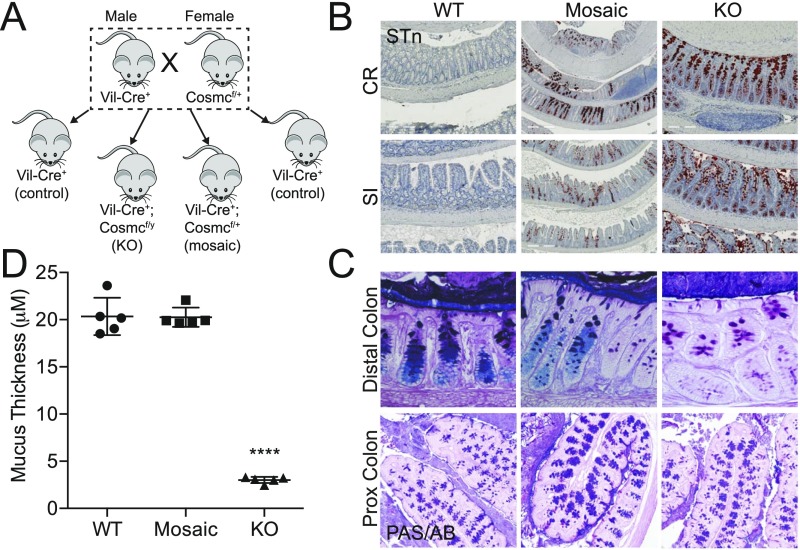
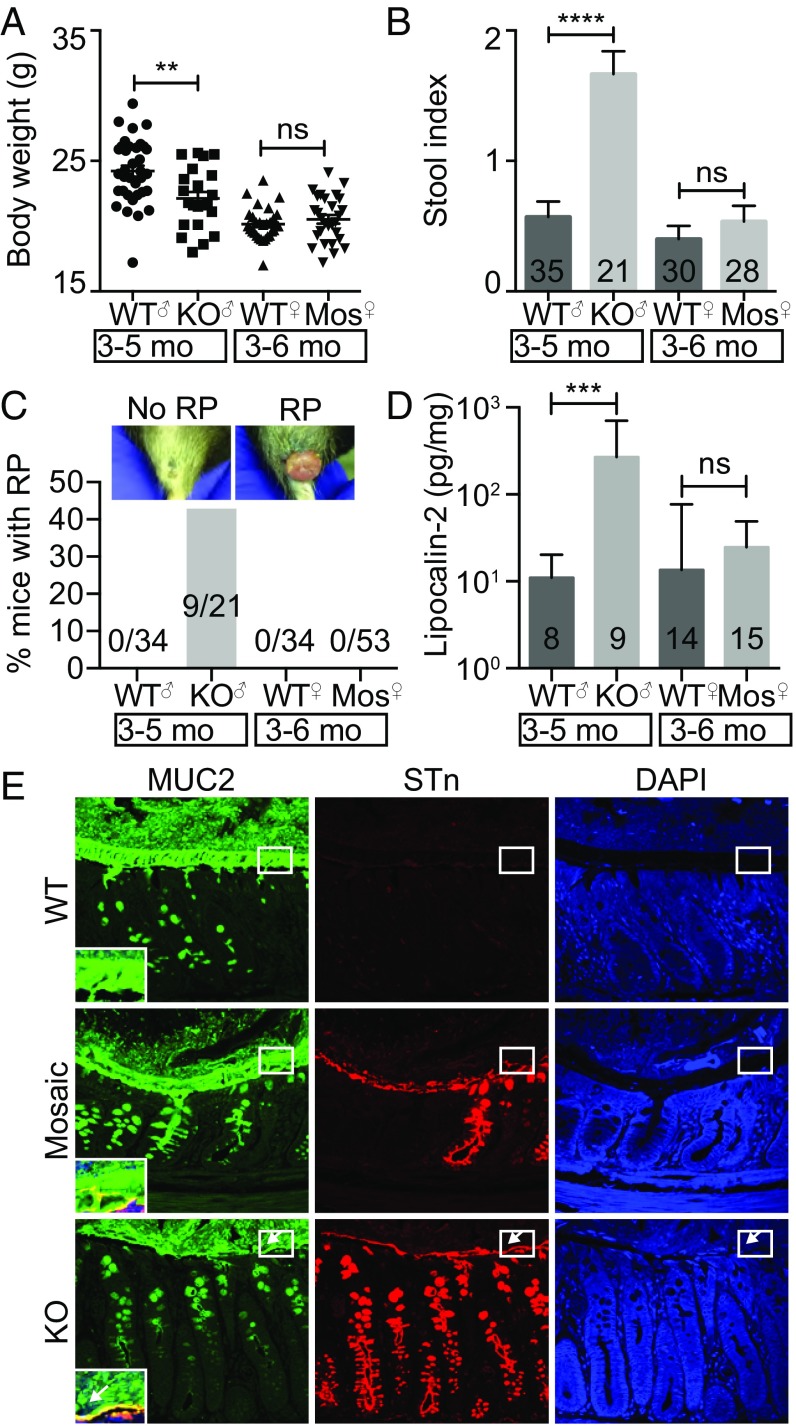
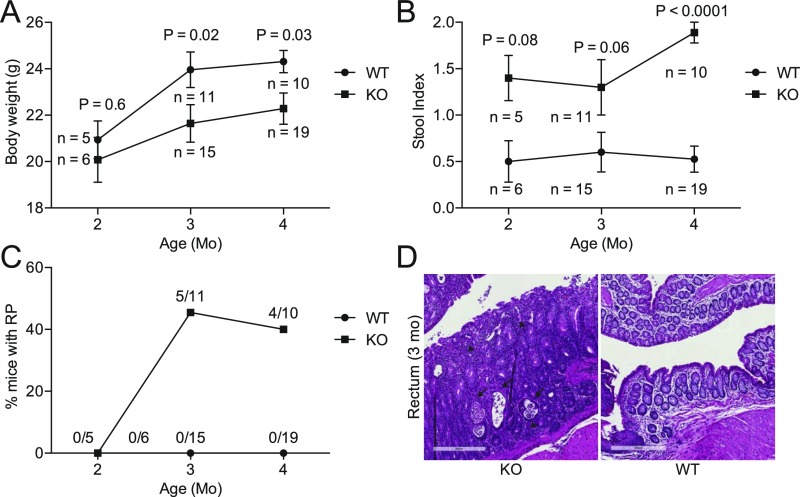
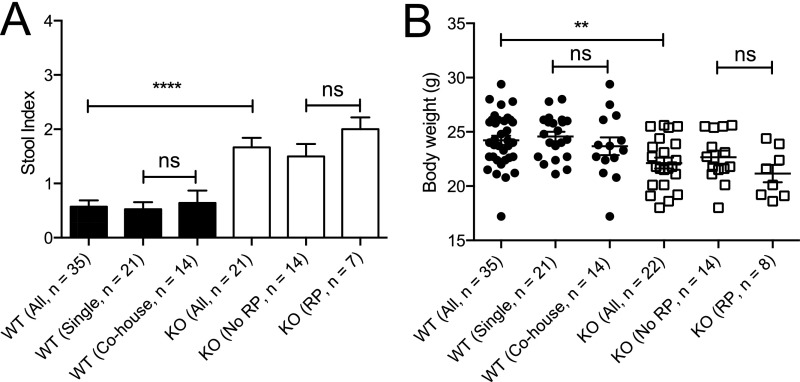
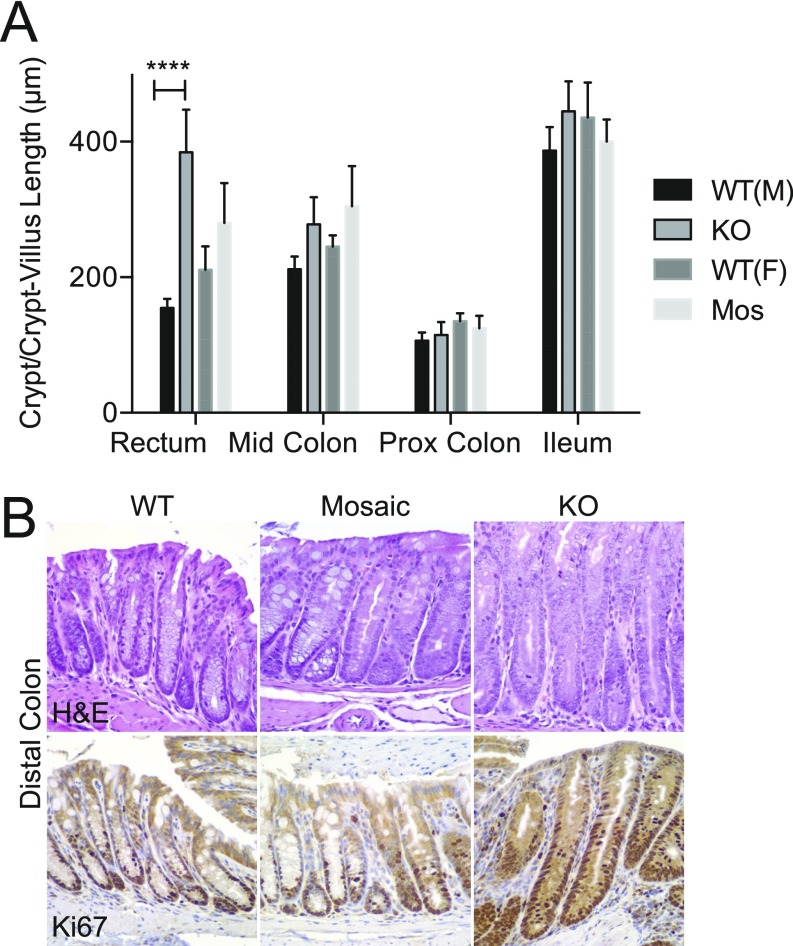
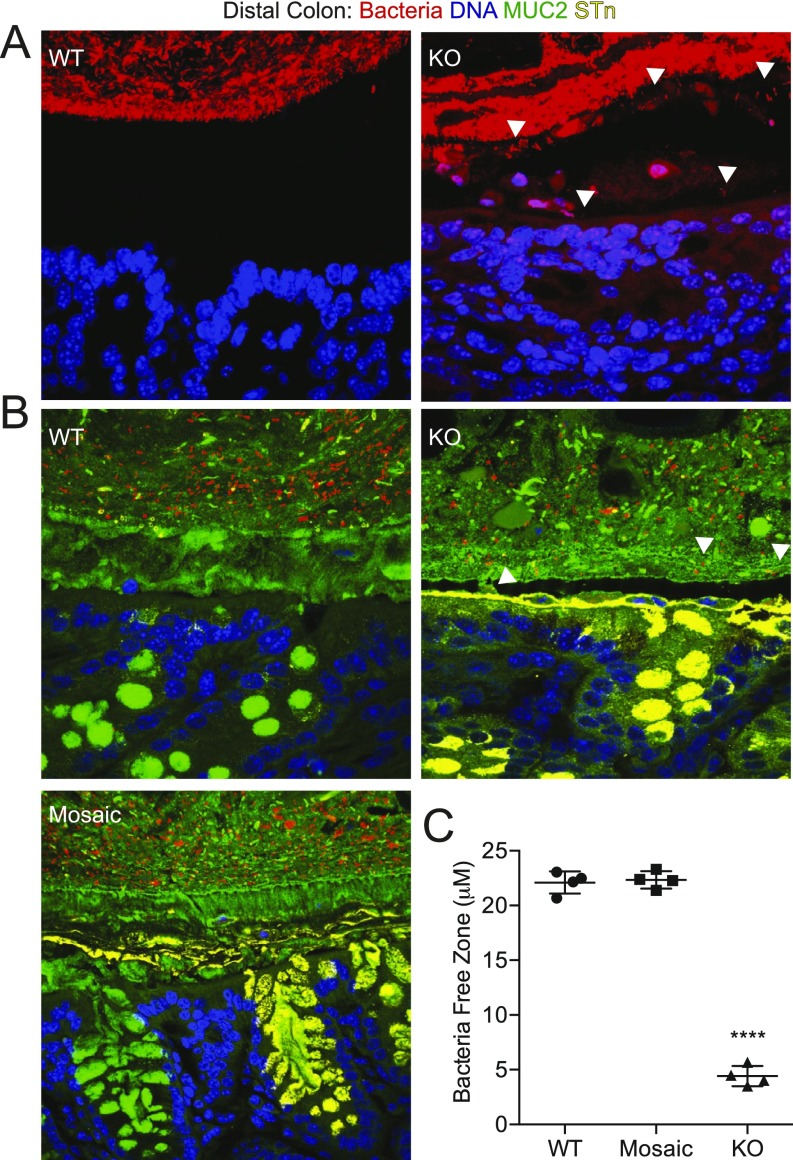
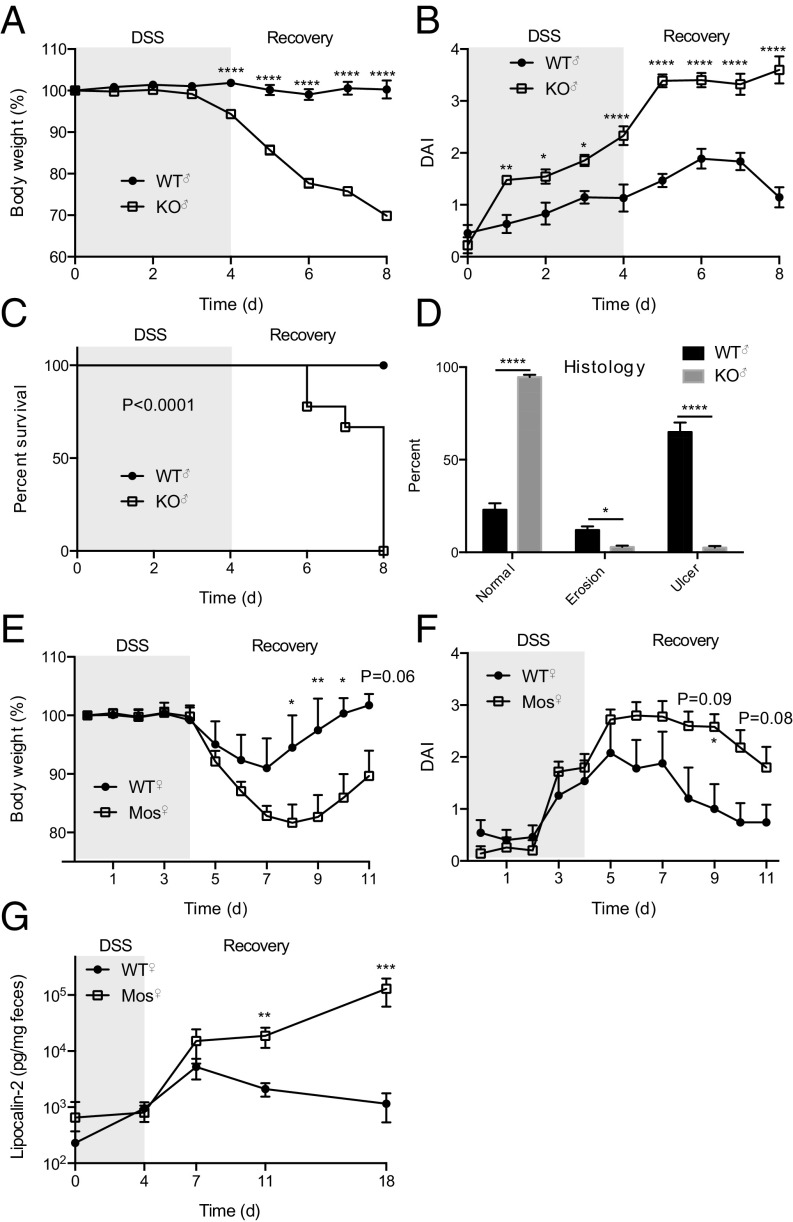
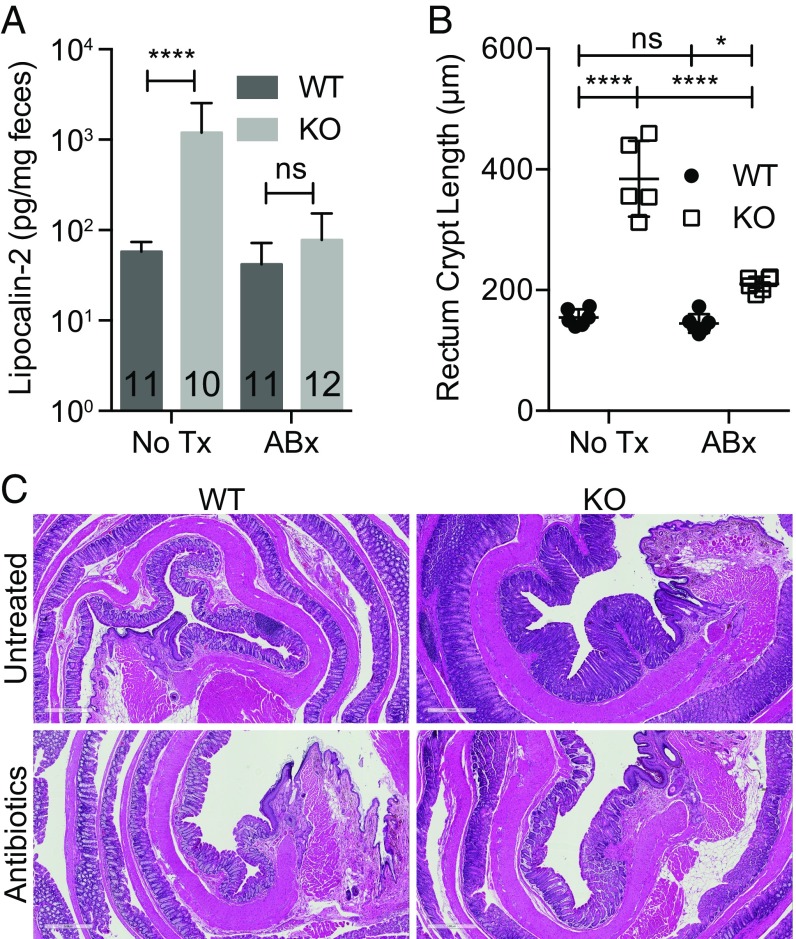
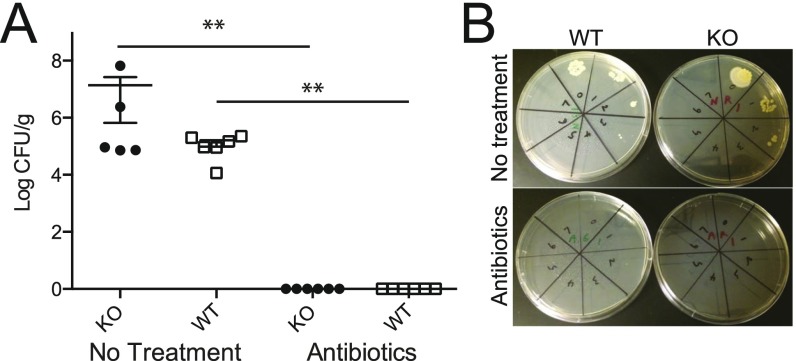
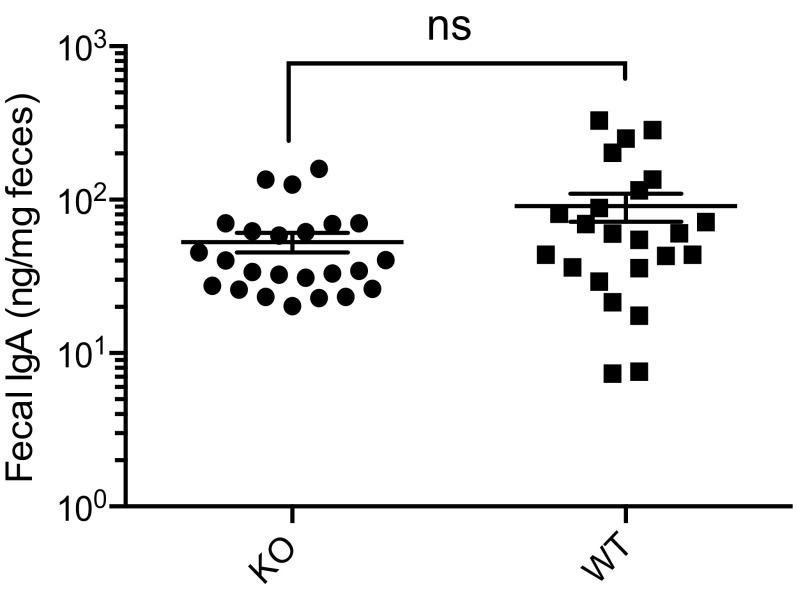
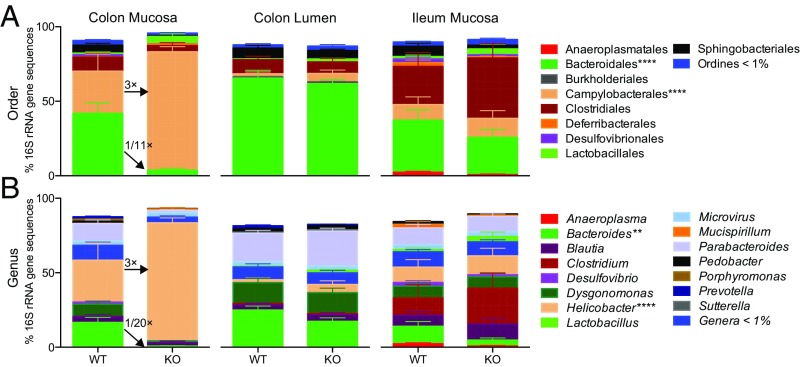
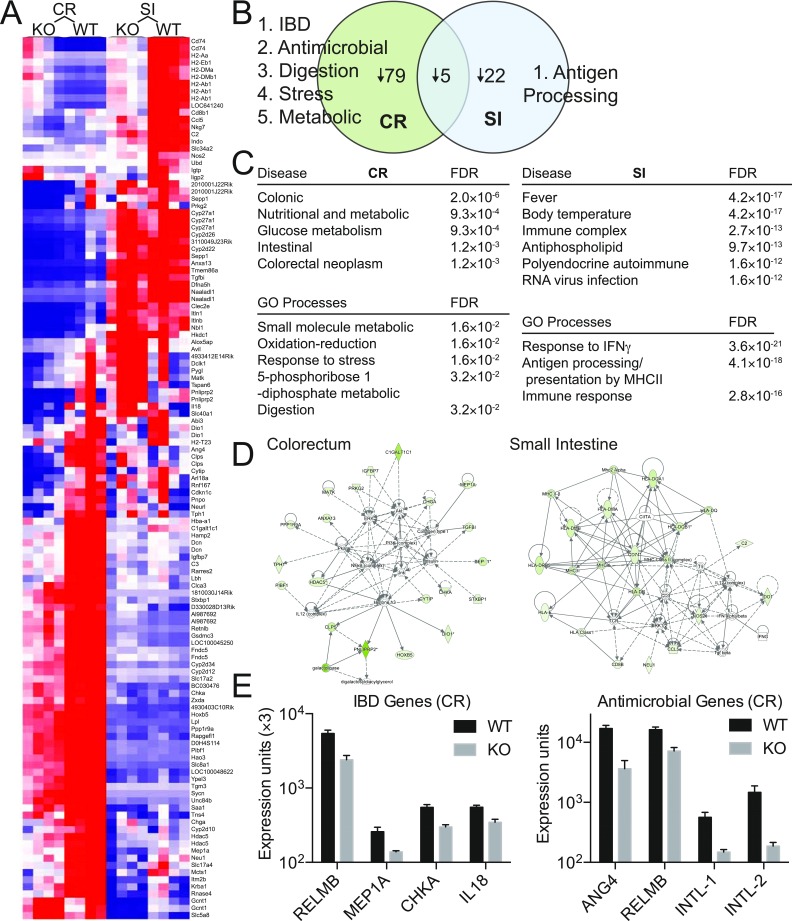
Inflammatory bowel disease (IBD) results from aberrant immune stimulation against a dysbiotic mucosal but relatively preserved luminal microbiota and preferentially affects males in early onset disease. However, factors contributing to sex-specific risk and the pattern of dysbiosis are largely unexplored. Core 1 β3GalT-specific molecular chaperone (Cosmc), which encodes an X-linked chaperone important for glycocalyx formation, was recently identified as an IBD risk factor by genome-wide association study. We deleted Cosmc in mouse intestinal epithelial cells (IECs) and found marked reduction of microbiota diversity in progression from the proximal to the distal gut mucosa, but not in the overlying lumen, as seen in IBD. This loss of diversity coincided with local emergence of a proinflammatory pathobiont and distal gut restricted pathology. Mechanistically, we found that Cosmc regulates host genes, bacterial ligands, and nutrient availability to control microbiota biogeography. Loss of one Cosmc allele in males (IEC-Cosmc-/y) resulted in a compromised mucus layer, spontaneous microbe-dependent inflammation, and enhanced experimental colitis; however, females with loss of one allele and mosaic deletion of Cosmc in 50% of crypts (IEC-Cosmc+/-) were protected from spontaneous inflammation and partially protected from experimental colitis, likely due to lateral migration of normal mucin glycocalyx from WT cells over KO crypts. These studies functionally validate Cosmc as an IBD risk factor and implicate it in regulating the spatial pattern of dysbiosis and sex bias in IBD.

Keywords: Cosmc; IBD; inflammation; microbiota; sex.


Conflict of interest statement

The authors declare no conflict of interest.

Figures

Fig. 1.
Fig. 1.
Characterization of IEC-Cosmc mice. (A) Schematic of O-glycan biosynthesis: Cosmc is the chaperone for the T-synthase and required to extend O-glycans beyond the Tn antigen. GPs, glycoproteins. Purified IECs from CR and SI from KO, mosaic, and gender-matched WT mice were probed with anti-Cosmc and anti-Actin antibodies by Western blot (B) and assayed for T-synthase and mannosidase activities (2 mice pooled per group; 2 groups evaluated/tissue per genotype; age 2–3 mo) (C). (D) Tn expression was analyzed by IHC on formalin fixed colorectum (CR) and ileum (SI) from KO, mosaic, and WT mice (n = 3–5 mice per group, 3 mo old). (Scale bars: Left and Center, 200 μM; Right, 500 μM.) (E) UEA-I lectin was used to analyze α1,2-fucose expression in the colorectum and ileum from KO, mosaic, and WT mice; Insets show UEA-I preincubated with 100 mM free fucose denoted as “+Fuc” (n = 3–5 mice per group, 3 mo old). Representative images shown. (Scale bars: Top, 1 mm; Bottom, 500 μM.)
Fig. S1.
Fig. S1.
Breeding strategy and characterization of IEC-Cosmc mice. (A) Breeding strategy: Vil-Cre+ males were bred to Cosmcf/+ females to generate intestinal epithelia-specific KO (Vil-Cre+;Cosmcf/y), mosaic (Vil-Cre+;Cosmcf/+), and WT control (Vil-Cre+;Cosmc+/y OR +/+) mice. (B) Sialyl-Tn expression was analyzed by monoclonal antibody on FFPE, swiss-rolled CR, and SI from KO, mosaic, and WT mice (distal segment in center of swiss-roll). (Scale bars: Left and Center, 200 μM; Right, 500 μM.) PAS/AB staining was performed on Carnoy’s fixed distal (magnification: 40×) and proximal (magnification: 10×) colon from WT, mosaic, and KO mice (C), and the inner mucus layer thickness was quantified in the distal colorectum (5 measurements per mouse per replicate, n = 5 mice per group) (D). n = 3–5 mice per group, age 3 mo (B and C). ****P ≤ 0.0001 from one-way ANOVA with Tukey’s post hoc test for multiple comparisons; mean ± SD.
Fig. 2.
Fig. 2.
Spontaneous inflammation in IEC-Cosmc-KO but not mosaic mice. Body weight (n = 35 WT males, 21 KOs; 30 WT females, 28 mosaics) (A), stool index (average of softness and blood content) (B), and rectal prolapse for KO, mosaics, and gender matched WTs (C). (D) Fecal lipocalin-2 in KO, mosaics, and gender-matched WTs. (E) Distal colon from WT, mosaic, and KO were fixed with Carnoy’s reagent and stained with antibodies against MUC2 (green), STn (red), or with DAPI (blue) (3 mice per group, representative images shown); white boxes indicate the inner mucus layer, enlarged and merged in lower left corner; white arrows show where the inner mucus layer was lost. (Magnification: 40×.) **P ≤ 0.01; ***P ≤ 0.001; ****P ≤ 0.0001; ns, not signficant from two-tailed Student’s t test (A) or Mann–Whitney (B and D); mean ± SE (A and B) or median ± interquartile range (D); number of mice are indicated on the graph (BD).
Fig. S2.
Fig. S2.
Time course of clinical inflammation. Body weight (A), stool index (B), and percent of mice with RP (C) were measured in KO and WT mice at 2, 3, and 4 mo of age. Measurements are the same as in Fig. 2. (D) Histologic evidence for active inflammation in distal colon of KO but not WT: crypt abscesses (arrows) and inflammatory infiltrate consisting of neutrophils, lymphocytes, and plasma cells (arrowheads) (n = 4 mice, < 1 y, 3 mo old mice shown). (Scale bars: 300 μM.) Number of mice indicated on graphs (AC); P values from two-tailed Student’s t test (A) or Mann–Whitney (B); mean ± SE (A and B).
Fig. S3.
Fig. S3.
Effects of cohousing and rectal prolapse on inflammation in KO mice. Stool index (average of softness and blood content) (A) and body weight (B) in 3- to 5-mo-old KO and WT mice. WT mice segregated by single housing (WT with WT) or cohousing (WT with KO); KO mice segregated by presence or absence of rectal prolapse. **P ≤ 0.01, ****P ≤ 0.0001 from Kruskal Wallis test with Dunn’s post hoc test for multiple comparisons (A) or one-way ANOVA with Sidak’s post hoc test for multiple comparisons (B); mean ± SE (A and B); number of mice indicated on graph (A and B). ns, not significant.
Fig. S4.
Fig. S4.
Hyperplasia in KO mice but not mosaic mice. Crypt length (A) and Ki67 (B) were analyzed in WT, mosaic, and KO mice. Summary data (n = 4–6 mice per group, 20 individual measurements/region per mouse for each replicate value) (A) and representative images (n = 3 mice per group) (B) are shown (magnification: 40×); ****P ≤ 0.0001 from two-way ANOVA with Sidak’s post hoc test for multiple comparisons (A and B).
Fig. S5.
Fig. S5.
Bacteria–epithelial interactions in the distal colon. Bacteria were visualized with EUB-16S rRNA Universal Bacteria FISH probe (red) and epithelia by DAPI (blue) (n = 2–3 mice per group, representative images shown) in A or additionally with antibodies against MUC2 (green) and STn (yellow) in Lower (n = 3 mice per group, representative images shown) (B) and the bacterial–epithelial distance was quantified (5 measurements per mouse per replicate from B, n = 4 mice per group) (C). White arrows indicate invading bacteria. ****P ≤ 0.0001 from one-way ANOVA with Tukey’s post hoc test for multiple comparisons; mean ± SD. (Magnification: A, 100×; B, 40×.)
Fig. 3.
Fig. 3.
DSS colitis in KO and mosaic mice. KO (AD), mosaic (EG), and WT mice (A–G) were treated with 2.5% DSS for 4 d and then switched to drinking water. Body weight (A and E), disease activity index (% weight change, stool softness, blood in stool) (B and F), survival (Mantel–Cox test) (C), histology (D), and fecal lipocalin-2 (G) were measured. n = 9 mice per group, age 3 mo (AC); n = 6 KO, 9 WT, killed on day 8 and the percent normal, eroded, and ulcerated epithelia on H&E-stained CR was quantified (D); n = 5–6 mice per group, age 3 mo (EG): repeated two independent times, one representative experiment shown (E and F) or pooled data (G); *P ≤ 0.05, **P ≤ 0.01, ***P ≤ 0.001, ****P ≤ 0.0001 from ANOVA with Sidak’s post hoc test for multiple comparisons (A, B, and DF) or Mann–Whitney (G); 0.05 < P < 0.1 listed; mean ± SE (A, B, and DG).
Fig. 4.
Fig. 4.
Microbes drive inflammation in KO mice. Fecal lipocalin-2 (number of mice indicated on graph, data pooled from two independent experiments) (A), summary data (B), and representative images of rectum crypt length (C) in WT and KO mice treated with NMVA antibiotics or untreated for 4 wk beginning at 2 mo of age (n = 4–6 mice per group, 20 individual measurements/region per mouse for each replicate value); *P ≤ 0.05, ****P ≤ 0.0001 from two-way ANOVA with Sidak’s post hoc test for multiple comparisons (A and B). ns, not significant. (Scale bars: 500 μM.)
Fig. S6.
Fig. S6.
Bacterial counts of mice treated with antibiotics. (A) Two-mo-old KO and WT mice were treated with NMVA antibiotics for 4 wk, and CFUs were assessed from feces (n = 6 per group) with untreated KO (n = 5) and WT (n = 6) mice for comparison (two independent experiments, one representative shown; all antibiotic-treated groups had 0 CFUs/g, which were set at log 0 for display on the graph). (B) Representative plates are shown. **P ≤ 0.01 from Mann–Whitney test; mean ± SE.
Fig. S7.
Fig. S7.
Analysis of fecal IgA. Fecal IgA was analyzed in KO (n = 24) and WT (n = 23) mice by ELISA (age-matched, 3–5 mo). ns, not significant from Mann–Whitney; mean ± SE.
Fig. 5.
Fig. 5.
Cosmc regionally regulates the gut microbiota community structure. (A and B) The microbiota was harvested from the gut lumen (distal colon) and mucosa (distal colon, ileum) from KO and WT mice for amplification of the V4 region and 16S rRNA gene sequencing (n = 7–8 mice per group, 2 mo old). Microbiota composition at the order (A) and genus (B) levels were plotted for all regions. Only colon mucosa contained significantly altered taxa (indicated with asterisks); ****P ≤ 0.0001 from two-way ANOVA with Sidak post hoc test for multiple comparisons.
Fig. S8.
Fig. S8.
Cosmc controls diverse host pathways that regulate the microbiota and inflammation in the distal colon. Epithelial cells were purified from the CR or SI from KO and WT mice, and gene expression was performed on Illumina mouse ref 8 v2.0 expression chip. (A) Heat map indicating genes significantly altered by Cosmc KO (n = 4 mice per group, age 2 mo; fold change > 1.5, FDR < 0.05). (B) The number of genes altered in only CR, SI, or both are indicated with the most relevant gene sets from C or individual genes from E bulleted. No change in ST6GALNAC1 was seen. (C) Metacore GSEA was performed on CR and SI for gene sets enriched for diseases or GO processes. (D) Ingenuity pathway analysis used for gene expression from KO and WT epithelia isolated from colorectum. (E) Expression of individual IBD or antimicrobial genes from the CR as determined from the expression array.

References

    1. Sauer CG, Kugathasan S. Pediatric inflammatory bowel disease: Highlighting pediatric differences in IBD. Med Clin North Am. 2010;94(1):35–52. - PubMed
    1. Sekirov I, Russell SL, Antunes LC, Finlay BB. Gut microbiota in health and disease. Physiol Rev. 2010;90(3):859–904. - PubMed
    1. Donaldson GP, Lee SM, Mazmanian SK. Gut biogeography of the bacterial microbiota. Nat Rev Microbiol. 2016;14(1):20–32. - PMC - PubMed
    1. Gevers D, et al. The treatment-naive microbiome in new-onset Crohn’s disease. Cell Host Microbe. 2014;15(3):382–392. - PMC - PubMed
    1. Steentoft C, et al. Precision mapping of the human O-GalNAc glycoproteome through SimpleCell technology. EMBO J. 2013;32(10):1478–1488. - PMC - PubMed

Publication types

MeSH terms