

Development of RNA-FISH Assay for Detection of Oncogenic FGFR3-TACC3 Fusion Genes in FFPE Samples
- PMID: 27930669
- PMCID: PMC5145148
- DOI: 10.1371/journal.pone.0165109
Development of RNA-FISH Assay for Detection of Oncogenic FGFR3-TACC3 Fusion Genes in FFPE Samples
Abstract
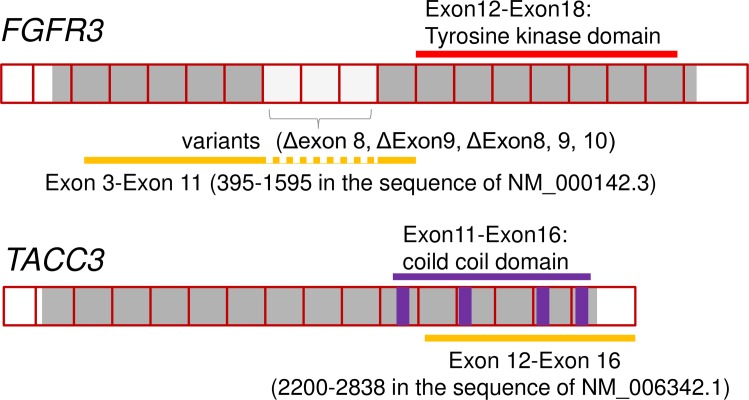
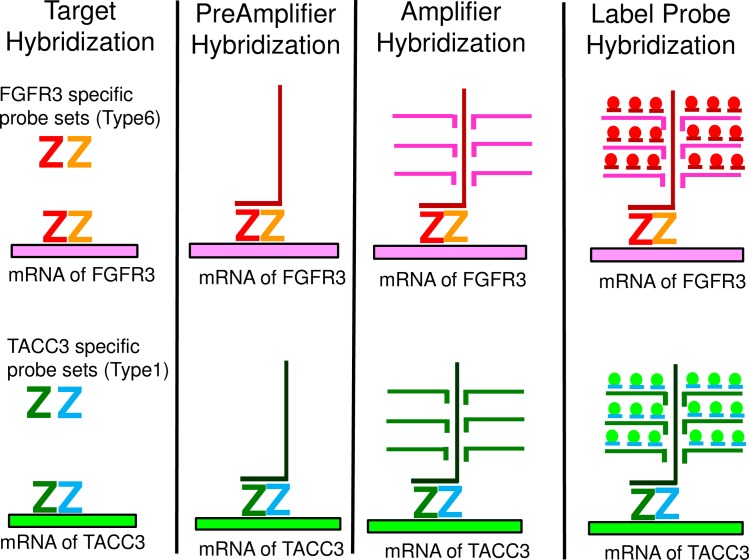
Introduction and objectives: Oncogenic FGFR3-TACC3 fusions and FGFR3 mutations are target candidates for small molecule inhibitors in bladder cancer (BC). Because FGFR3 and TACC3 genes are located very closely on chromosome 4p16.3, detection of the fusion by DNA-FISH (fluorescent in situ hybridization) is not a feasible option. In this study, we developed a novel RNA-FISH assay using branched DNA probe to detect FGFR3-TACC3 fusions in formaldehyde-fixed paraffin-embedded (FFPE) human BC samples.
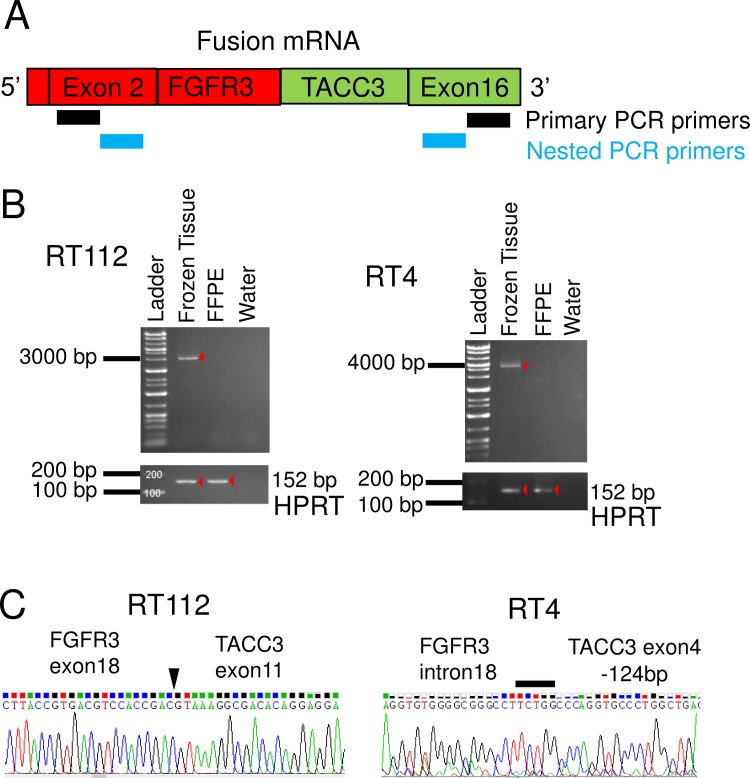
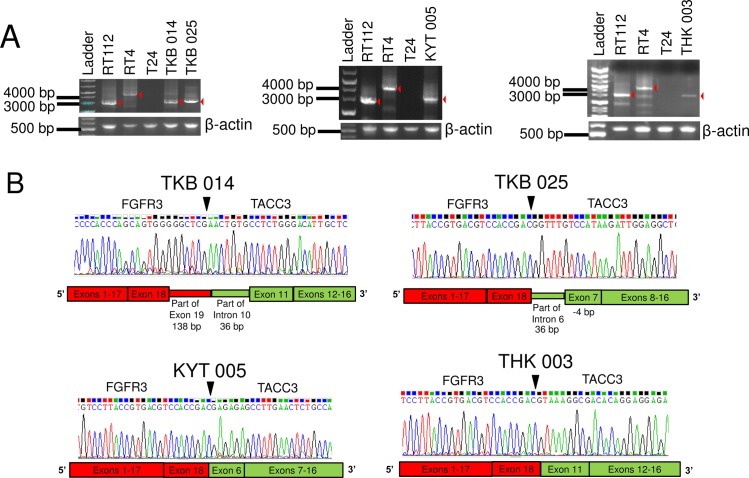
Materials and methods: The RNA-FISH assay was developed and validated using a mouse xenograft model with human BC cell lines. Next, we assessed the consistency of the RNA-FISH assay using 104 human BC samples. In this study, primary BC tissues were stored as frozen and FFPE tissues. FGFR3-TACC3 fusions were independently detected in FFPE sections by the RNA-FISH assay and in frozen tissues by RT-PCR. We also analyzed the presence of FGFR3 mutations by targeted sequencing of genomic DNA extracted from deparaffinized FFPE sections.
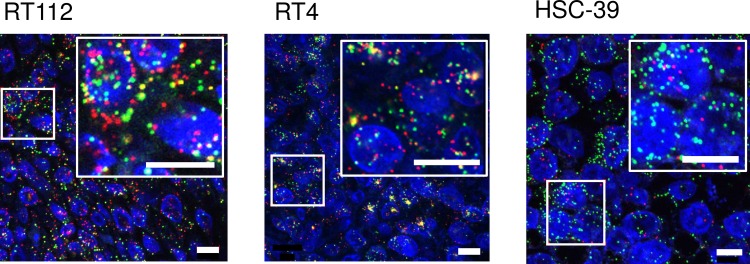
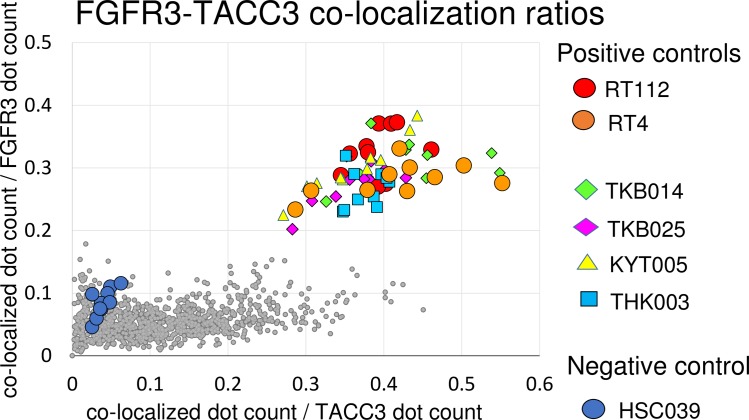
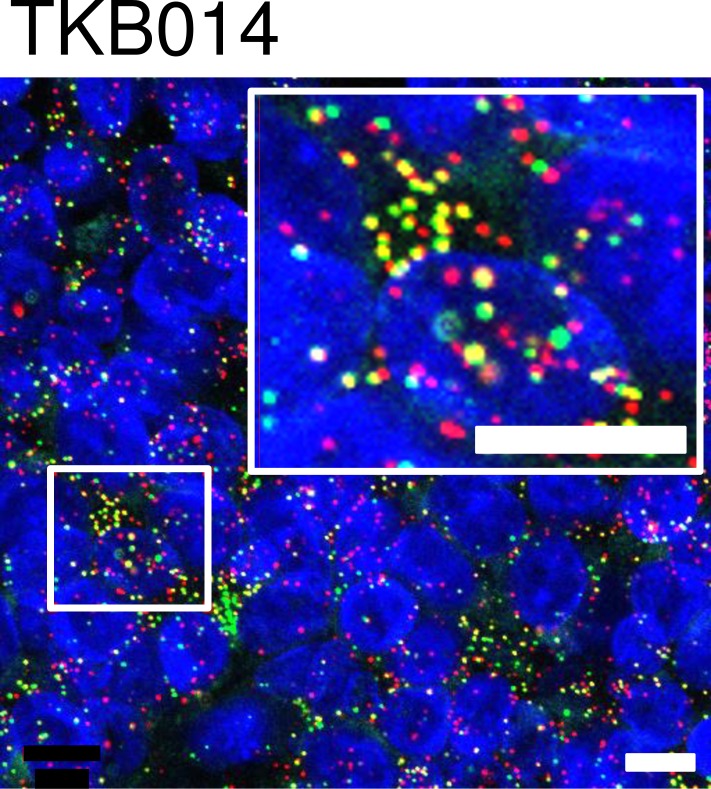
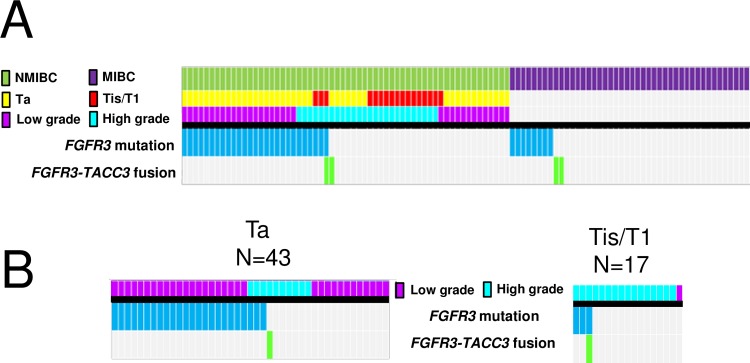
Results: FGFR3-TACC3 fusion transcripts were identified by RNA-FISH and RT-PCR in mouse xenograft FFPE tissues using the human BC cell lines RT112 and RT4. These cell lines have been reported to be fusion-positive. Signals for FGFR3-TACC3 fusions by RNA-FISH were positive in 2/60 (3%) of non-muscle-invasive BC (NMIBC) and 2/44 (5%) muscle-invasive BC (MIBC) patients. The results of RT-PCR of all 104 patients were identical to those of RNA-FISH. FGFR3 mutations were detected in 27/60 (45%) NMIBC and 8/44 (18%) MIBC patients. Except for one NMIBC patient, FGFR3 mutation and FGFR3-TACC3 fusion were mutually exclusive.
Conclusions: We developed an RNA-FISH assay for detection of the FGFR3-TACC3 fusion in FFPE samples of human BC tissues. Screening for not only FGFR3 mutations, but also for FGFR3-TACC3 fusion transcripts has the potential to identify additional patients that can be treated with FGFR inhibitors.
Conflict of interest statement
I have read the journal's policy and the authors of this manuscript have the following competing interests. One co-author, Kouichi Nishimura, is currently a full-time employee at Astellas. This does not alter the authors’ adherence to PLOS ONE policies on sharing data and materials. All remaining authors have declared no competing interests.
Figures
Similar articles
-
FGFR3-TACCs3 Fusions and Their Clinical Relevance in Human Glioblastoma.Int J Mol Sci. 2022 Aug 4;23(15):8675. doi: 10.3390/ijms23158675. Int J Mol Sci. 2022. PMID: 35955806 Free PMC article. Review.
-
RT-PCR assay to detect FGFR3::TACC3 fusions in formalin-fixed, paraffin-embedded glioblastoma samples.Neurooncol Pract. 2024 Jan 5;11(2):142-149. doi: 10.1093/nop/npad081. eCollection 2024 Apr. Neurooncol Pract. 2024. PMID: 38496910 Free PMC article.
-
Detection, Characterization, and Inhibition of FGFR-TACC Fusions in IDH Wild-type Glioma.Clin Cancer Res. 2015 Jul 15;21(14):3307-17. doi: 10.1158/1078-0432.CCR-14-2199. Epub 2015 Jan 21. Clin Cancer Res. 2015. PMID: 25609060 Free PMC article. Clinical Trial.
-
Emergence of FGFR3-TACC3 fusions as a potential by-pass resistance mechanism to EGFR tyrosine kinase inhibitors in EGFR mutated NSCLC patients.Lung Cancer. 2017 Sep;111:61-64. doi: 10.1016/j.lungcan.2017.07.006. Epub 2017 Jul 11. Lung Cancer. 2017. PMID: 28838400 Free PMC article.
-
FGFR3-TACC3 fusion in solid tumors: mini review.Oncotarget. 2016 Aug 23;7(34):55924-55938. doi: 10.18632/oncotarget.10482. Oncotarget. 2016. PMID: 27409839 Free PMC article. Review.
Cited by
-
Recent advances in cancer fusion transcript detection.Brief Bioinform. 2023 Jan 19;24(1):bbac519. doi: 10.1093/bib/bbac519. Brief Bioinform. 2023. PMID: 36527429 Free PMC article. Review.
-
TP53 codon 72 polymorphism is associated with FGFR3 and RAS mutation in non-muscle-invasive bladder cancer.PLoS One. 2019 Aug 1;14(8):e0220173. doi: 10.1371/journal.pone.0220173. eCollection 2019. PLoS One. 2019. PMID: 31369573 Free PMC article.
-
FGFR Fusions in Cancer: From Diagnostic Approaches to Therapeutic Intervention.Int J Mol Sci. 2020 Sep 18;21(18):6856. doi: 10.3390/ijms21186856. Int J Mol Sci. 2020. PMID: 32962091 Free PMC article. Review.
-
FGFR3-TACCs3 Fusions and Their Clinical Relevance in Human Glioblastoma.Int J Mol Sci. 2022 Aug 4;23(15):8675. doi: 10.3390/ijms23158675. Int J Mol Sci. 2022. PMID: 35955806 Free PMC article. Review.
-
TACC3: a multi-functional protein promoting cancer cell survival and aggressiveness.Cell Cycle. 2023 Dec-Dec;22(23-24):2637-2655. doi: 10.1080/15384101.2024.2302243. Epub 2024 Jan 10. Cell Cycle. 2023. PMID: 38197196 Free PMC article. Review.
References
-
- d'Avis PY, Robertson SC, Meyer AN, Bardwell WM, Webster MK, Donoghue DJ. Constitutive activation of fibroblast growth factor receptor 3 by mutations responsible for the lethal skeletal dysplasia thanatophoric dysplasia type I. Cell Growth Differ 1998;9:71–78. - PubMed
MeSH terms
Substances
LinkOut - more resources
Full Text Sources
Other Literature Sources
