. 2016 Dec 8;11(12):e0167490.
doi: 10.1371/journal.pone.0167490. eCollection 2016.

Major Depression as a Complex Dynamic System

Affiliations

Major Depression as a Complex Dynamic System

Angélique O J Cramer et al. PLoS One. .

Abstract

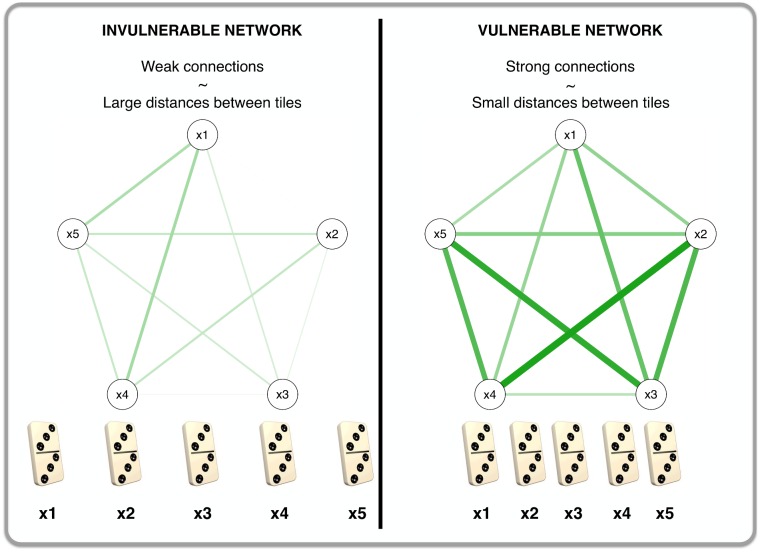
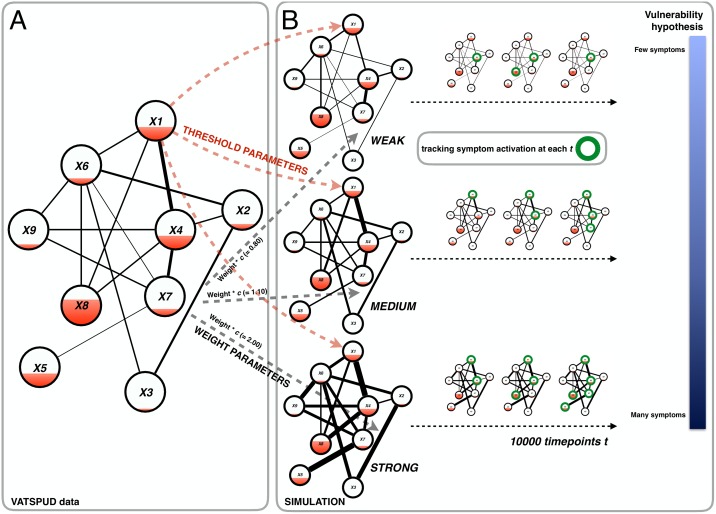
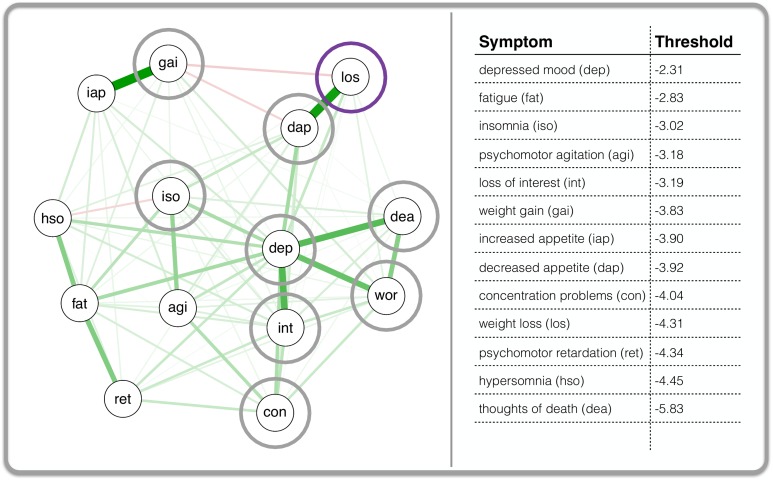
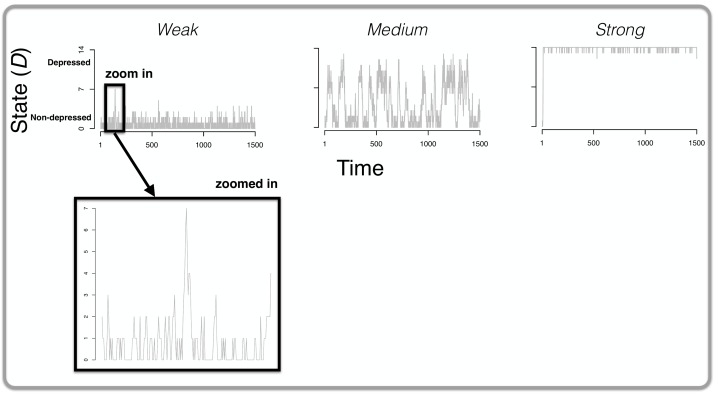
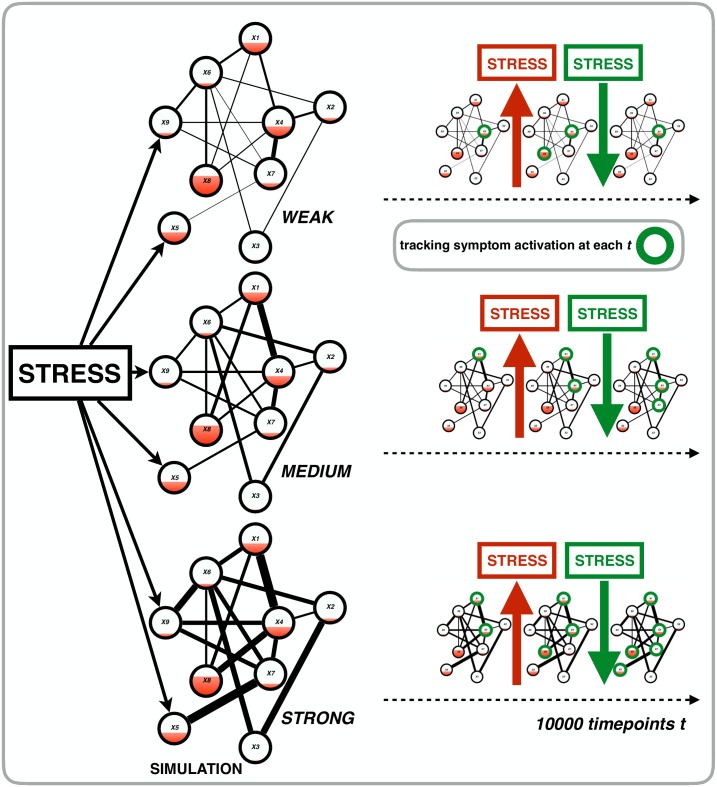
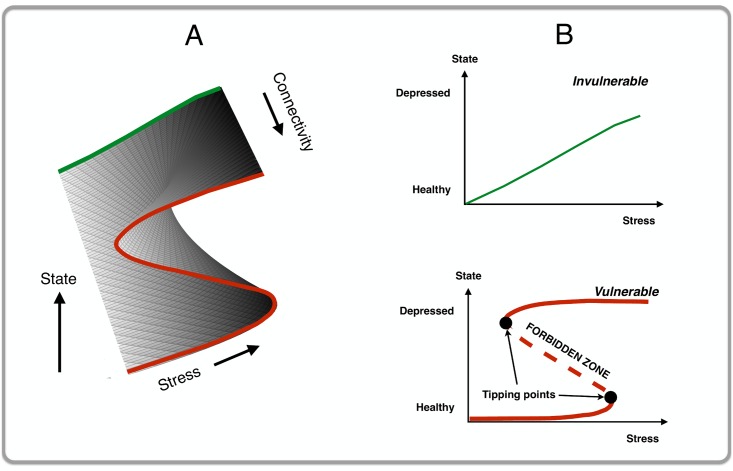
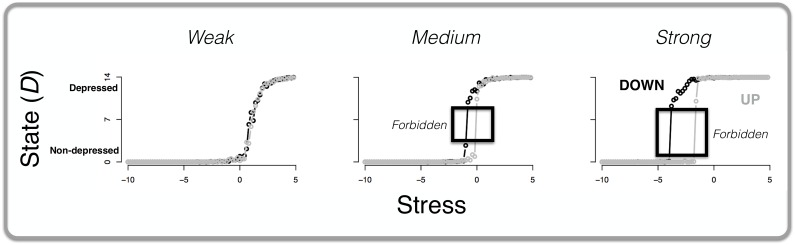
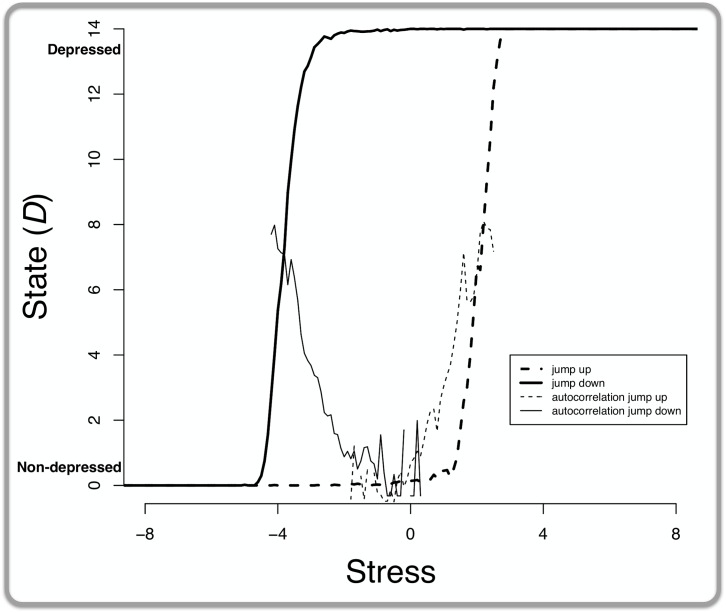
In this paper, we characterize major depression (MD) as a complex dynamic system in which symptoms (e.g., insomnia and fatigue) are directly connected to one another in a network structure. We hypothesize that individuals can be characterized by their own network with unique architecture and resulting dynamics. With respect to architecture, we show that individuals vulnerable to developing MD are those with strong connections between symptoms: e.g., only one night of poor sleep suffices to make a particular person feel tired. Such vulnerable networks, when pushed by forces external to the system such as stress, are more likely to end up in a depressed state; whereas networks with weaker connections tend to remain in or return to a non-depressed state. We show this with a simulation in which we model the probability of a symptom becoming 'active' as a logistic function of the activity of its neighboring symptoms. Additionally, we show that this model potentially explains some well-known empirical phenomena such as spontaneous recovery as well as accommodates existing theories about the various subtypes of MD. To our knowledge, we offer the first intra-individual, symptom-based, process model with the potential to explain the pathogenesis and maintenance of major depression.


Conflict of interest statement

The authors have declared that no competing interests exist.

Figures

Fig 1
Fig 1. An analogy between vulnerability in a network and spacing of domino tiles.
Fig 2
Fig 2. A visualization of the setup of Simulation I.
Panel A features a simplified network for variables X1X9 of the VATSPUD data. From this data we estimated weight parameters (i.e., the lines between the symptoms: the thicker the line the stronger the connection) and thresholds (i.e., the filling of each node: the more filling the higher the threshold). These empirical parameters were entered into the simulation model (black and red dashed arrows from panel A to panel B). To create three MD systems, we multiplied the empirical weight parameters with a connectivity parameter c to create a system with weak, medium and strong connectivity. Panel B shows a gist of the actual simulation: for the three MD systems, we simulated 1000 time points (with the equations given in the main text) and at each time point, we tracked symptom activation. Our goal was to investigate our hypothesis (most right part of panel B) that the system with strong connectivity would be the most vulnerable system, i.e., with the most symptoms active over time.
Fig 3
Fig 3. The inter-individual MD symptom network based on the VATSPUD data.
Each node in the left panel of the figure represents one of the 14 disaggregated symptoms of MD according to DSM-III-R. A line (i.e., edge) between any two nodes represents a logistic regression weight: the line is green when that weight is positive, and red when negative. An edge becomes thicker as the regression weight becomes larger. As an example, the grey circles are the neighbor of the symptom that is encircled in purple (i.e., they have a connection with the purple symptom). The right part of the figure shows the estimated thresholds for each symptom. dep: depressed mood; int: loss of interest; los: weight loss; gai: weight gain; dap: decreased appetite; iap: increased appetite; iso: insomnia; hso: hypersomnia; ret: psychomotor retardation; agi: psychomotor agitation; fat: fatigue; wor: feelings of worthlessness; con: concentration problems; dea: thoughts of death.
Fig 4
Fig 4. The results of Simulation I.
The top of the figure displays three graphs: in each graph, the state of the system D (i.e., the total number of active symptoms; y-axis) is plotted over time (the x-axis). From left to right, the results are displayed for a weakly, medium and strongly connected network respectively. For the network with weak connections, we zoom in on one particular part of the graph in which spontaneous recovery is evident: there is a peak of symptom development and these symptoms spontaneously become deactivated (i.e., without any change to the parameters of the system) within a relatively short period of time.
Fig 5
Fig 5. A visualization of a cusp catastrophe model.
This figure features two panels: (A) The 3D cusp catastrophe model with stress on the x-axis, connectivity on the y-axis and the state of the system (i.e., D: the total number of active symptoms) on the z-axis; and (B) A 2D visualization of the cusp as depicted in (A). In the case of weak connectivity (top graph in (B)), the system shows smooth continuous behavior in response to increasing stress (green line, invulnerable networks). In the case of strong connectivity (bottom graph in (B)), the system shows discontinuous behavior with sudden jumps from non-depressed to more depressed states and vice versa (red line, vulnerable networks). Additionally, the system with strong connectivity shows two tipping points with in between a so-called forbidden zone (i.e., the dashed part of the red line): in that zone, the state of the system is unstable to such an extent that even a minor perturbation will force the system out of that state into a stable state (i.e., the solid parts of the red line).
Fig 6
Fig 6. A visualization of the setup of Simulation II.
First, we put stress on all the symptoms of the systems with weak, medium and strong connectivity by adding a stress value to the total activation function of each symptom (left part of the figure). Then, we simulate 10000 time points during which we 1) increase and decrease stress and 2) track symptom activation at each time point (right part of the figure).
Fig 7
Fig 7. The state of the MD system in response to stress for varying connectivity.
The x-axis represents stress while the y-axis depicts the average state of the MD system, D: that is, the total number of active symptoms averaged over every 0.20 range of the stress parameter value. The grey line (and points) depicts the situation where stress is increasing (UP; from -15 to 15, with steps of 0.01) whereas the black line (and points) depicts the situation where stress is decreasing (DOWN; from 15 to -15, with steps of 0.01). The three graphs represent, from left to right, the simulation results for networks with low, medium, and high connectivity, respectively.
Fig 8
Fig 8. Increasing autocorrelation as an early warning signal in the MD system with strong connectivity.
The x-axis represents stress while the y-axis represents the average state: that is, the total number of active symptoms averaged over every 0.20 range of the stress parameter value. The dashed lines depict the situation where stress is increasing whereas the solid lines depict the situation where stress is decreasing. The “jump” lines show the total number of active symptoms (i.e., state), the “autocorrelation” lines track the autocorrelation between these states over time.

References

    1. Greden JF. The burden of recurrent depression: Causes, consequences, and future prospects. J Clin Psychiatry. 2001;62: 5–9. - PubMed
    1. Hammen CL, Peters SD. Interpersonal consequences of depression: Responses to men and women enacting a depressed role. J Abnorm Psychol. 1978;87: 322–332. - PubMed
    1. Whiteford HA, Degenhardt L, Rehm J, Baxter AJ, Ferrari AJ, Erskine HE, et al. Global burden of disease attributable to mental and substance use disorders: findings from the Global Burden of Disease Study 2010. The Lancet. 2013;382(9904): 1575–1586. - PubMed
    1. Wang J, Fick G, Adair C, Lai D. Gender specific correlates of stigma toward depression in a Canadian general population sample. J Affect Disord. 2007;103: 91–97. 10.1016/j.jad.2007.01.010 - DOI - PubMed
    1. Kessler RC, McGonagle KA, Zhao S, Nelson CB, Hughes M, Eshleman S, et al. Lifetime and 12-month prevalence of DSM-III-R psychiatric disorders in the United States: Results from the National Comorbidity Survey. Arch Gen Psychiatry. 1994;51: 8–19. - PubMed

MeSH terms

LinkOut - more resources