. 2016 Dec 8;35(1):192.
doi: 10.1186/s13046-016-0457-1.

A piperazidine derivative of 23-hydroxy betulinic acid induces a mitochondria-derived ROS burst to trigger apoptotic cell death in hepatocellular carcinoma cells

Affiliations

A piperazidine derivative of 23-hydroxy betulinic acid induces a mitochondria-derived ROS burst to trigger apoptotic cell death in hepatocellular carcinoma cells

Nan Yao et al. J Exp Clin Cancer Res. .

Abstract

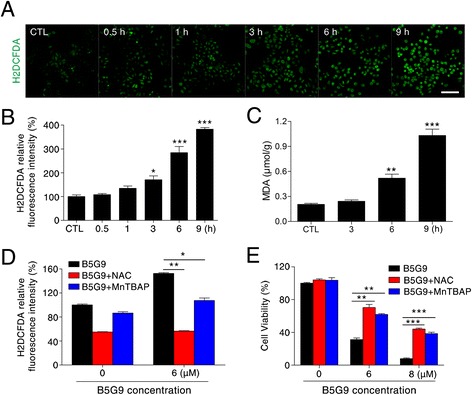
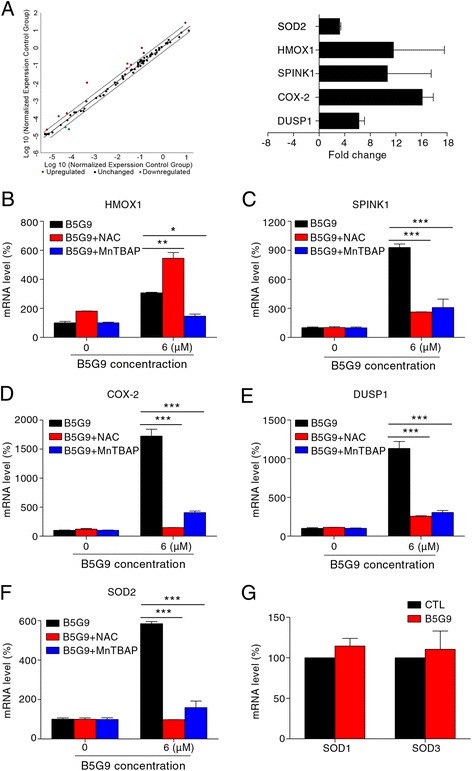
Background: Elevated production of reactive oxygen species (ROS) and an altered redox state have frequently been observed in hepatocellular carcinoma (HCC); therefore, selective killing of HCC cells by chemotherapeutic agents that stimulate ROS generation or impair antioxidant systems may be a feasible approach in HCC chemotherapy. Recently, betulinic acid and its derivatives have attracted attention because they showed anti-cancer effects via a ROS- and mitochondria-related mechanism. However, the source of ROS overproduction and the role of mitochondria were poorly identified, and the weak in vivo antitumour activity of these compounds limits their development as drugs.

Methods: Cytotoxicity was detected using MTT assays. In vivo anti-HCC effects were assessed using nude mice bearing HepG2 tumour xenografts. Cell cycle analysis, apoptosis rate and mitochondrial membrane potential were measured by flow cytometry. ROS production was detected using a microplate reader or a fluorescence microscope. Changes in gene and protein levels were measured by RT-PCR and western blotting, respectively. Other assays were performed using related detection kits.

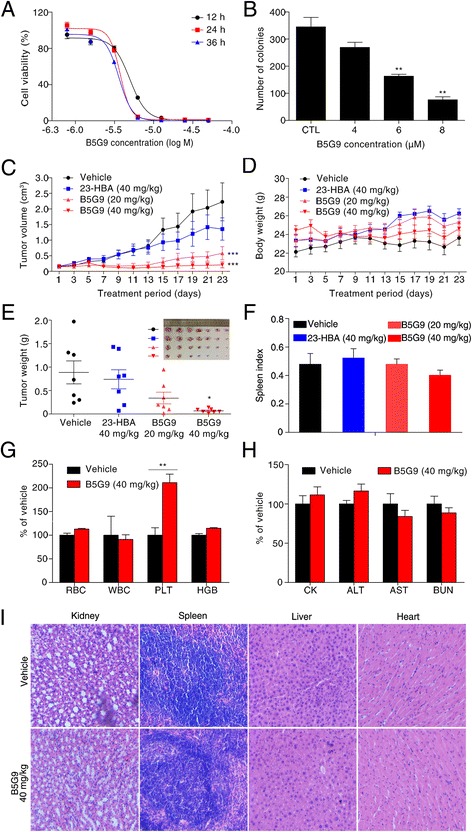
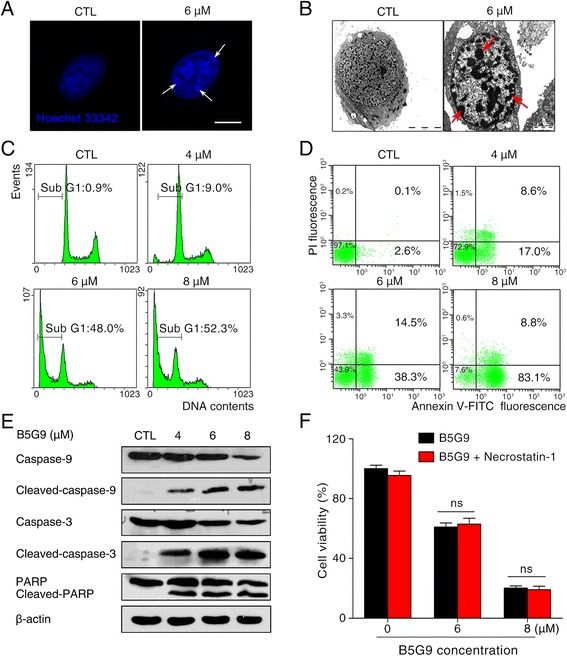
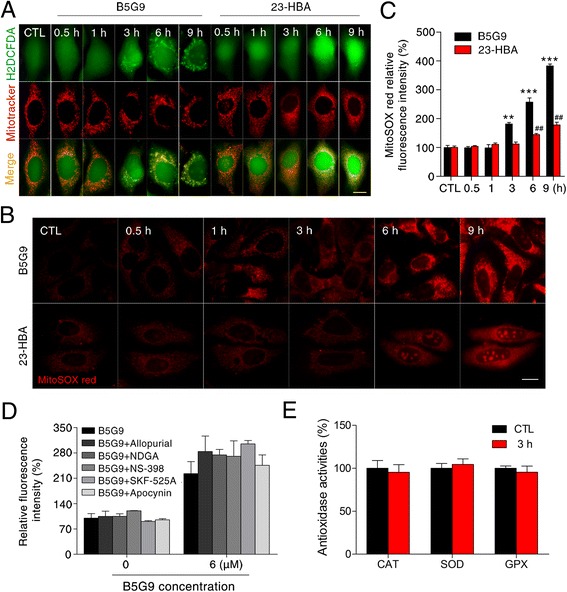
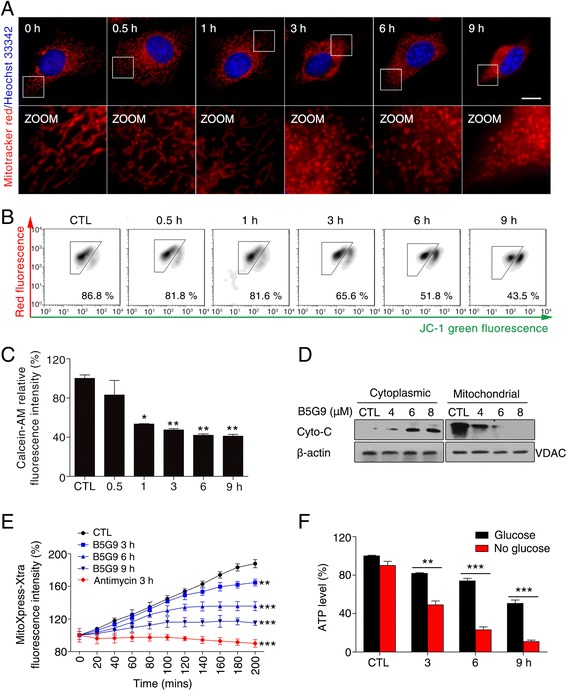
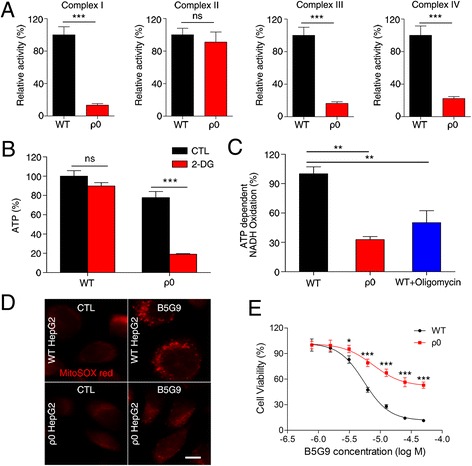
Results: B5G9, a piperazidine derivative of 23-hydroxy betulinic acid (23-HBA), showed excellent in vivo anti-HCC effects, with a tumour growth inhibitory rate of greater than 80%, and no significant side effects. B5G9 stimulated the production of ROS, which were derived from the mitochondria, but it had no effect on various other antioxidant systems. Moreover, B5G9 induced mitochondrial dysfunction, which was characterized by morphological changes, membrane potential collapse, membrane permeabilization, and decreases in the O2 consumption rate and ATP production. Furthermore, mtDNA-depleted ρ0 HepG2 cells were less sensitive to B5G9 treatment than wt HepG2 cells, indicating the importance of mitochondria in B5G9-induced cell death.

Conclusion: We discovered a piperazidine derivative of 23-HBA, B5G9, with excellent anti-HCC effects both in vivo and in vitro and no obvious toxic effects. The underlying mechanism was associated with mitochondria-derived ROS overproduction, and mitochondria played essential roles in B5G9-induced cell death. This study identified a potential agent for anti-HCC therapy and elucidated the mitochondria-related mechanism of BA and its derivatives.

Keywords: Apoptosis; Betulinic acid; Hepatocellular carcinoma; Mitochondria; Reactive oxygen species.


Figures

Fig. 1
Fig. 1
B5G9 suppresses HepG2 cells in vitro and in vivo. a The cytotoxicity of B5G9 on HepG2 cells. HepG2 cells were treated with different concentrations of B5G9 for 12, 24 and 36 h. Cell viability was measured by MTT assay. b The inhibitory effect of B5G9 on the colony formation of HepG2 cells. HepG2 cells were treated with different concentrations of B5G9 for 24 h. Clonogenic survival of HepG2 cells after B5G9 treatment was measured by the number of clones capable of anchorage-dependent growth. ** P ≤ 0.01 vs control. c The growth curves of HepG2 xenografts. Nude mice bearing HepG2 xenografts were treated with B5G9 (20 or 40 mg/kg/day), 23-HBA (20 mg/kg/day) for 23 days. Tumor size was measured every other day. *** P ≤ 0.001 vs vehicle. d The body weight curves of the mice measured every 2 days. e Tumor weights of HepG2 xenografts dissected after 23 days treatment and the photograph of the tumours isolated from nude mice. * P ≤ 0.05 vs vehicle. f B5G9 had no effect on the spleen index. g-h B5G9 had no significant effect on routine blood indices and serum biochemistrical indices. After 23 days treatment, the mice were killed and blood was collected. Routine blood indices (RBC, WBC, PLT, HGB) and serum biochemistrical indices (CK, AST, ALT and BUN) were measured, ** P ≤ 0.01. i B5G9 had no influence on the function of kidney, spleen, liver and heart. After 23 days treatment, viscera were taken out for H&E staining
Fig. 2
Fig. 2
B5G9 induces apoptotic cell death in HepG2 cells. a HepG2 cells treated B5G9 (6 μM) were stained with Hoechst 33342 (10 μg/mL) and then observed under a fluorescence microscope. Apoptotic cells with chromatin shrinking were observed (as indicated by the arrow). Original magnifications: × 630; scale bar: 10 μm. b The ultrastructure of HepG2 cells after B5G9 (6 μM) treatment for 24 h was observed by transmission electron microscopy. Original magnifications: × 8900; scale bar: CTL, 5 μm; B5G9 (6 μM), 2 μm. c B5G9 triggered the accumulation of HepG2 cells in the sub-G1 phase of the cell cycle. After B5G9 treatment, HepG2 cells were stained with PI (0.02 mg/mL). Cell cycle distribution was determined by flow cytometry. d Apoptotic cells after B5G9 treatment were quantified by the Annexin V/PI assay. HepG2 cells treated with various concentrations of B5G9 were stained using an Annexin V/PI kit and detected by flow cytometry. e Effects of B5G9 on the apoptosis-related proteins level. Total cell lysate from HepG2 cells treated with B5G9 at indicated concentrations for 24 h was evaluated by western blotting, and β-actin was used as a loading control. f B5G9-induced cell death is necrosis-independent. HepG2 cells were cultured with various concentrations of B5G9 in the presence or absence of necrostatin-1 (50 μM) for 12 h. Cell viability was measured by the MTT assay. The results were presented as the mean ± S.D
Fig. 3
Fig. 3
B5G9-induced apoptosis is ROS-dependent. a B5G9 elevated ROS level by a time-dependent manner in HepG2 cells. HepG2 cells were stained with H2DCFDA (10 μM) after being treated with B5G9 (6 μM) at the indicated times. The H2DCFDA fluorescence was observed by a fluorescence microscope. Original magnifications: 100 ×; scale bar: 200 μm. b The H2DCFDA fluorescence intensity of HepG2 cells treated with B5G9 at the indicated times was detected by a microplate reader. * P ≤ 0.05, *** P ≤ 0.001 vs control. c B5G9 induced lipid peroxidation. After being treated with B5G9 (6 μM) for the indicated times, MDA level were detection by a Lipid Peroxidation MDA Assay Kit. ** P ≤ 0.01, *** P ≤ 0.001 vs control. d The elevated ROS level induced by B5G9 was abrogated by NAC or MnTBAP. HepG2 cells were treated with B5G9 (6 μM) in the presence or absence of NAC (20 mM) or MnTBAP (200 μM) for 3 h. The H2DCFDA fluorescence intensity was detected by a microplate reader. * P ≤ 0.05, ** P ≤ 0.01. e NAC or MnTBAP alleviates B5G9-induced cell death. HepG2 cells were treated with B5G9 (6 μM) in the presence or absence of NAC (20 mM) or MnTBAP (200 μM) for 12 h. Cell viability was measured by MTT assay. ** P ≤0.01, *** P ≤ 0.001
Fig. 4
Fig. 4
Identification of ROS-associated genes by Human Oxidative Stress Plus PCR Array. a The gene screening of oxidative stress-related proteins. HepG2 cells were treated with B5G9 (6 μM) for 3 h, the RT2 Profiler PCR Array was performed (left panel). The fold change values of these genes were calculated (right panel). The changes of HMOX1 (b), SPINK1 (c), COX-2 (d) DUSP1 (e) and SOD2 (f) gene levels were consequences of ROS overload. HepG2 cells were treated with B5G9 (6 μM) in the presence or absence of NAC (20 mM) or MnTBAP (200 μM) for 3 h, the fold changes of these genes were detected by RT-PCR. * P ≤ 0.05, ** P ≤ 0.01, *** P ≤ 0.001. g B5G9 had no effect on mRNA level of SOD1 and SOD3. HepG2 cells were treated with B5G9 (6 μM) in the presence or absence of NAC (20 mM) for 3 h, the fold changes of these genes were detected by RT-PCR
Fig. 5
Fig. 5
Mitochondria are the main source of B5G9-induced ROS overproduction. a B5G9-induced punctate H2DCFDA fluorescence co-localized with mitochondrial tracker. HepG2 cells were treated with B5G9 (6 μM) or 23-HBA (30 μM) for indicated times. Then cells were stained with H2DCFDA (10 μM) and mitotracker (100 nM) for 30 min. The fluorescence was observed by a fluorescence microscope. Original magnifications: 630 ×, scale bar: 10 μm. b-c B5G9 induced mitochondrial ROS overload. HepG2 cells were treated with B5G9 (6 μM) or 23-HBA (30 μM) for indicated times, and then cells were stained with mitoSOX (5 μM) red for 10 min. The fluorescence was observed by a fluorescence microscope (b). Original magnifications: 630 ×; scale bar: 10 μm. The fluorescence was also detected by a microplate reader (c), ** P ≤ 0.01, *** P ≤ 0.001, B5G9 vs control, ## P ≤ 0.01, 23-HBA vs control. d B5G9-induced elevated ROS was independent of xanthine oxidase, lipoxygenase, cyclooxygenase, cytochrome p450 or NADPH oxidase. HepG2 cells were pretreated with allopurinol (10 μM), NDGA (10 μM), NS-398 (10 μM), SKF-525A (10 μM) or apocynin (20 μM), followed by B5G9 (6 μM) treatment for 3 h, the H2DCFDA fluorescence intensity was detected by a microplate reader. e B5G9 had no influence on activities of CAT, SOD and GPx. After being treated with B5G9 (6 μM) treatment for 3 h, the activities of antioxidases were measured by detection kits
Fig. 6
Fig. 6
B5G9 treatment induces mitochondrial dysfunction. a B5G9 induced mitochondrial morphology changes. HepG2 cells treated with B5G9 (6 μM) for indicated times were stained with MitoTracker Red CMXRos (100 nM) for 20 min, the cells were observed by a fluorescence microscope. Original magnifications: 630 ×; scale bar: 10 μm, (b) B5G9 induced mitochondrial membrane potential collapse. HepG2 cells were treated with B5G9 (6 μM) for indicated times, and then stained with JC-1 (5 μM) fluorescence dye, and changes of ΔΨm were determined by flow cytometry. c B5G9 increased mitochondrial membrane permeabilization. HepG2 cells were treated with B5G9 (6 μM) for indicated times, then cells were incubated with calcein-AM for 30 min, the fluorescence was detected by a microplate reader, * P ≤ 0.05, ** P ≤ 0.01 vs control. d Cyto c released from mitochondria to cytoplasm after B5G9 treatment. After being treated with various concentrations of B5G9 for 24 h, HepG2 cells lysate was divided into mitochondrial fraction and cytoplasmic fraction and detected by western bolt, β-actin and VDAC were used as loading controls for cytoplasm and mitochondria respectively. e O2 consumption rate was inhibited by B5G9. HepG2 cells were treated with B5G9 (6 μM) for 3, 6, 9 h and antimycin (6 μM) for 3 h, the O2 consumption rate was measured by a MitoXpress-Xtra-based assay. ** P ≤ 0.01, *** P ≤ 0.001 vs control. f B5G9 impaired mitochondrial ATP production. HepG2 cells were treated with B5G9 (6 μM) for 3, 6 and 9 h in complete medium or no-glucose medium, the ATP level was detected by a CellTiter-Glo Luminescent Assay, ** P ≤ 0.01, *** P ≤ 0.001
Fig. 7
Fig. 7
ρ0 HepG2 cells were less sensitive to B5G9 treatment. a Mitochondrial complex activities of wt HepG2 or ρ0 HepG2 were detected by related assay kits, *** P ≤ 0.001. b ATP production of ρ0 HepG2 cells was significantly decreased in the present of 2-DG. After being treated with 2-DG (2 mM) for 2 h, ATP level of wt HepG2 or ρ0 HepG2 was measured by a CellTiter-Glo Luminescent Assay, *** P ≤ 0.001. c ρ0 HepG2 had a lower ATP synthetase activity than wt HepG2. The ATP synthetase activity of wt HepG2 treated in the present or absent of oligomycin (6 μM) and ρ0 HepG2 was measured by a cayman ATP synthetase activity kit, ** P ≤ 0.01. d ρ0 HepG2 cells had no significant change in mitoSOX red fluorescence after B5G9 treatment, original magnifications : 630 ×; scale bar: 10 μm. e ρ0 HepG2 cells were less sensitive to B5G9 treatment. Being treated with various concentrations of B5G9 for 12 h, cell viability was measured by MTT assay. * P ≤ 0.01, *** P ≤ 0.001

References

    1. Ferlay J, Shin HR, Bray F, Forman D, Mathers C, Parkin DM. Estimates of worldwide burden of cancer in 2008: GLOBOCAN 2008. Int J Cancer. 2010;127:2893–2917. doi: 10.1002/ijc.25516. - DOI - PubMed
    1. Leung T, Johnson PJ. Systemic therapy for hepatocellular carcinoma. Cancer J. 2013;2:514–520. - PubMed
    1. Bruix J, Gores GJ, Mazzaferro V. Hepatocellular carcinoma: clinical frontiers and perspectives. Gut. 2014;63:844–855. doi: 10.1136/gutjnl-2013-306627. - DOI - PMC - PubMed
    1. Wang X, Wang N, Cheung F, Lao L, Li C, Feng Y. Chinese medicines for prevention and treatment of human hepatocellular carcinoma: current progress on pharmacological actions and mechanisms. J Integr Med. 2015;13:142–164. doi: 10.1016/S2095-4964(15)60171-6. - DOI - PubMed
    1. Devasagayam TP, Tilak JC, Boloor KK, Sane KS, Ghaskadbi SS, Lele RD. Free radicals and antioxidants in human health: current status and future prospects. J Assoc Physicians India. 2004;52:794–804. - PubMed

Publication types

MeSH terms