. 2016 Dec 8;11(1):74.
doi: 10.1186/s13024-016-0138-8.

Glymphatic distribution of CSF-derived apoE into brain is isoform specific and suppressed during sleep deprivation

Affiliations

Glymphatic distribution of CSF-derived apoE into brain is isoform specific and suppressed during sleep deprivation

Thiyagaragan M Achariyar et al. Mol Neurodegener. .

Erratum in

Abstract

Background: Apolipoprotein E (apoE) is a major carrier of cholesterol and essential for synaptic plasticity. In brain, it's expressed by many cells but highly expressed by the choroid plexus and the predominant apolipoprotein in cerebrospinal fluid (CSF). The role of apoE in the CSF is unclear. Recently, the glymphatic system was described as a clearance system whereby CSF and ISF (interstitial fluid) is exchanged via the peri-arterial space and convective flow of ISF clearance is mediated by aquaporin 4 (AQP4), a water channel. We reasoned that this system also serves to distribute essential molecules in CSF into brain. The aim was to establish whether apoE in CSF, secreted by the choroid plexus, is distributed into brain, and whether this distribution pattern was altered by sleep deprivation.

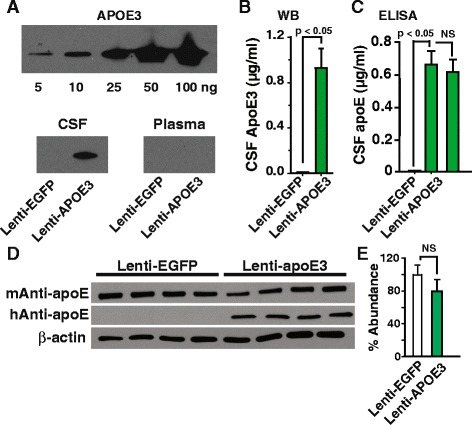
Methods: We used fluorescently labeled lipidated apoE isoforms, lenti-apoE3 delivered to the choroid plexus, immunohistochemistry to map apoE brain distribution, immunolabeled cells and proteins in brain, Western blot analysis and ELISA to determine apoE levels and radiolabeled molecules to quantify CSF inflow into brain and brain clearance in mice. Data were statistically analyzed using ANOVA or Student's t- test.

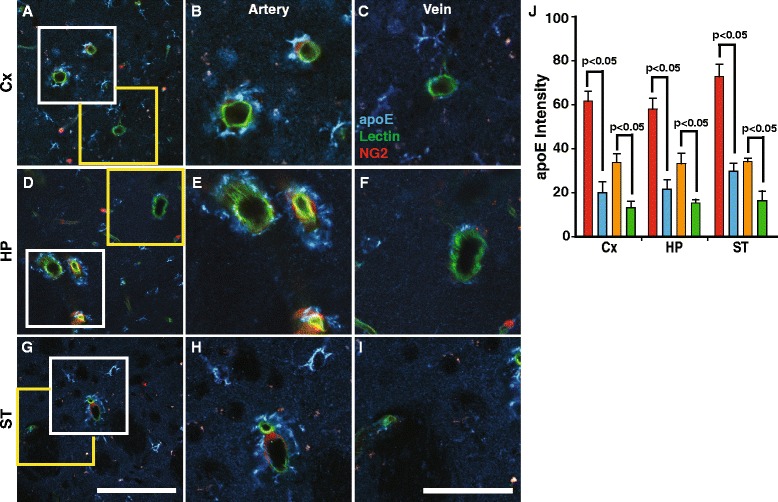
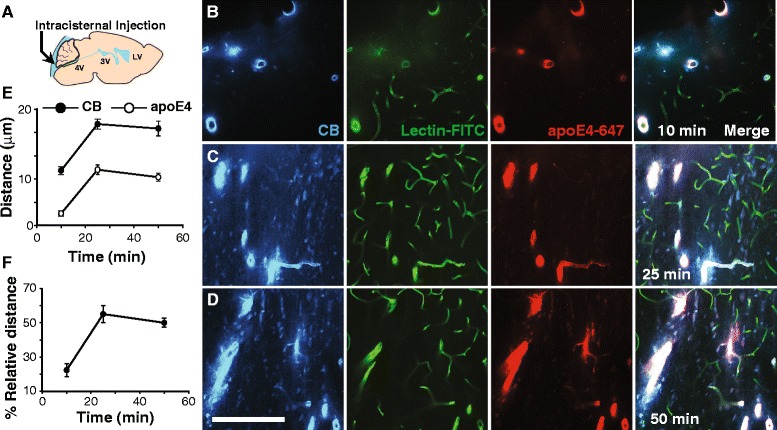
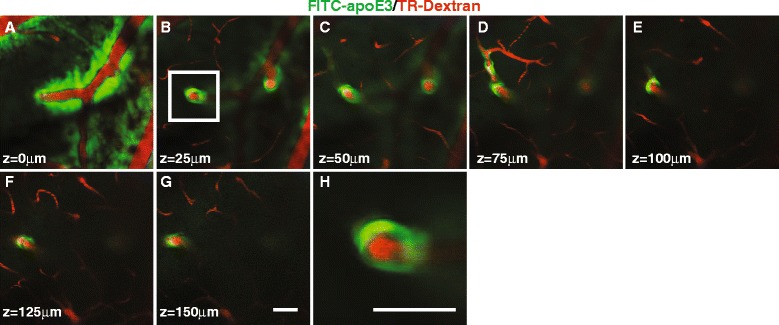
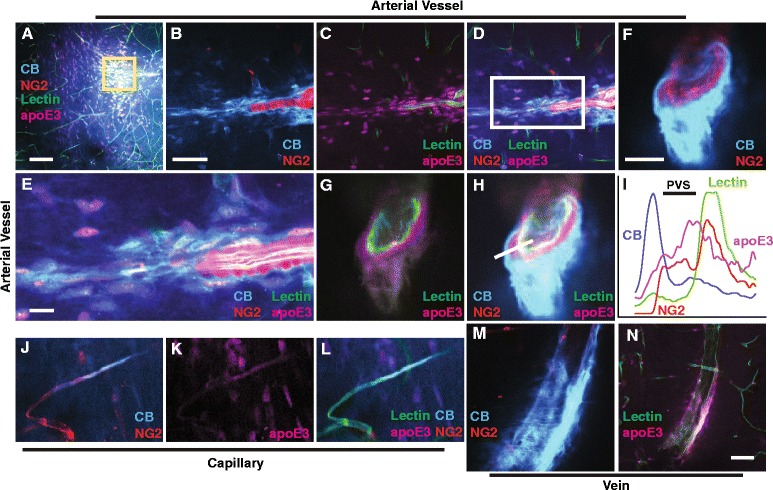
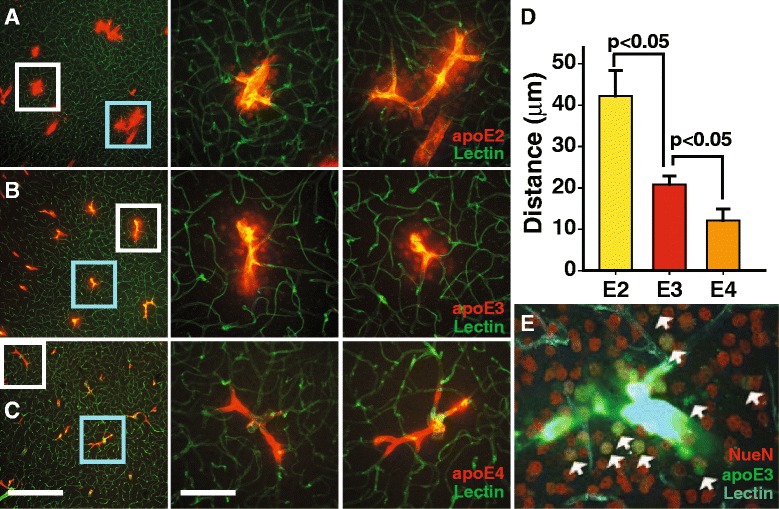
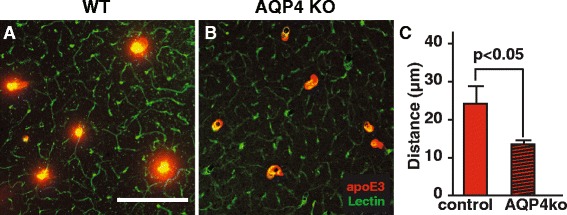
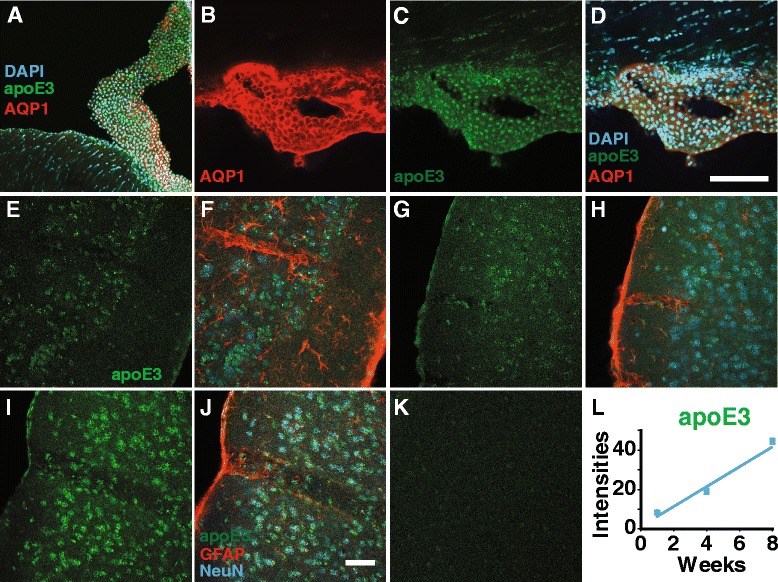
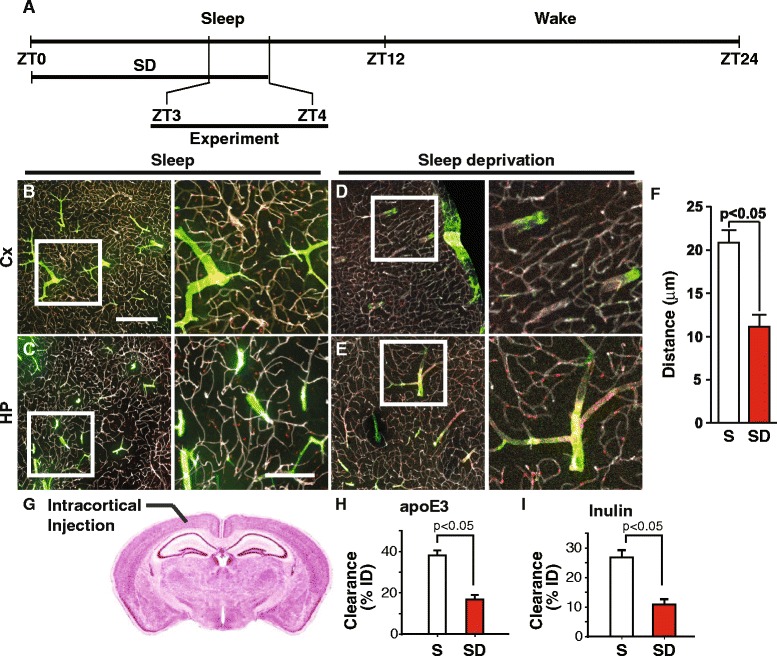
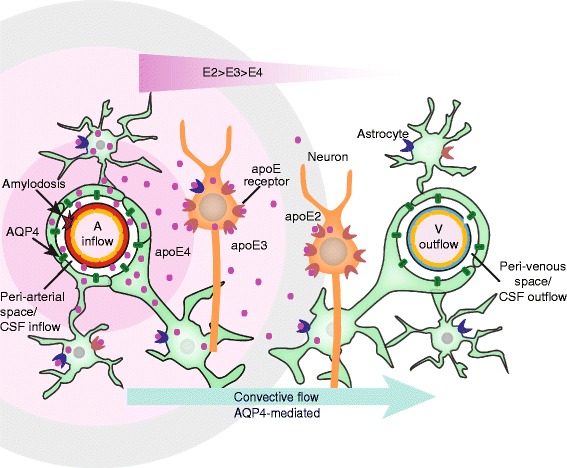
Results: We show that the glymphatic fluid transporting system contributes to the delivery of choroid plexus/CSF-derived human apoE to neurons. CSF-delivered human apoE entered brain via the perivascular space of penetrating arteries and flows radially around arteries, but not veins, in an isoform specific manner (apoE2 > apoE3 > apoE4). Flow of apoE around arteries was facilitated by AQP4, a characteristic feature of the glymphatic system. ApoE3, delivered by lentivirus to the choroid plexus and ependymal layer but not to the parenchymal cells, was present in the CSF, penetrating arteries and neurons. The inflow of CSF, which contains apoE, into brain and its clearance from the interstitium were severely suppressed by sleep deprivation compared to the sleep state.

Conclusions: Thus, choroid plexus/CSF provides an additional source of apoE and the glymphatic fluid transporting system delivers it to brain via the periarterial space. By implication, failure in this essential physiological role of the glymphatic fluid flow and ISF clearance may also contribute to apoE isoform-specific disorders in the long term.

Keywords: AQP4; Alzheimer’s disease; Brain clearance; Glymphatic pathways; Lymphatic system; Sleep/wake.


Figures

Fig. 1
Fig. 1
Greater levels of arterial endogenous mouse apoE than that on veins. Representative images of arteries and veins in brain regions (a, d and g at low magnification. Scale bar (100 μm). b cortical arteries with NG2-DsRed positive smooth muscle cells immunostained for apoE (blue) and (c) cortical vein lacking smooth muscle cells and with little apoE. Scale bar (50 μm). Similar pattern of apoE immunolabeling on arteries (e and h) and veins (f and i) in the hippocampus (d-f) and striatum (g-i). Blue, apoE; red, NG2-dsRed; green, Lectin. j Quantification of the apoE intensities on the vessel wall and around (a 5 μm circle around the vessel) arteries and veins in the different brain regions (cortex (Cx), hippocampus (HP) and striatum (ST)). Arterial wall (red column), peri-arterial (orange), vein (blue), peri-venous (green). White box (arterial vessels). Yellow box (venous vessels) Values are mean ± SEM. N = 4 mice per group
Fig. 2
Fig. 2
Distribution of CSF apoE4 around arteries but not veins (a) Schematic diagram showing the intracisternal injection site. b-d Representative images of apoE4-647 (red) and dextran-cascade blue (CB) radial distribution at 10, 25 and 50 min post-intracisternal injection. Scale bar = 100 μm. e Distribution distance of apoE4 and CB at different post-injection times. f ApoE4 distribution distance standardized as a percentage of that of CB. Values are mean ± SEM. N = 4. The vasculature was outlined by intravascular labeling with lectin (green)
Fig. 3
Fig. 3
ApoE periarterial inflow using in vivo 2-photon imaging (a) Pial surface arterial vessels showing apoE3-FITC within the perivascular space of arteries. b-g ApoE3-FITC along the perivascular space of penetrating arterial vessel at various depths below the brain surface. h Magnified image of the white boxed area in (panel b) (scale bar 50 μm). Following intracisternal injection (5 μL at 1 μL/min) of apoE3-FITC images were acquired every 25 μm below the brain surface at 15 min. The scale bar in (panel g) is 50 μm. Panels a-g are at the same magnification. The vasculature was identified by intravenously injected Texas Red-dextran (70 kDa)
Fig. 4
Fig. 4
ApoE is cleared from brain along perivascular pathways a Low magnification image showing the distribution of intracisternally injected apoE3-647 and cascade blue (10 kDa) in brain 15 min after their injection (5 μL at 1 μL/min). b-d Magnified images of the boxed area in (panel a). e Magnified images of the boxed area in (panel d). f-h Cross section of a cortical penetrating artery showing the perivascular flow of apoE3-647 and cascade blue. i Intensity graph of the various fluorescent markers across the white line drawn in (panel h). j-l Presence of apoE3-647 and cascade blue in a representative cortical capillary 60 min after intraparenchymal injection (caudate nucleus, 0.5 μL at 0.1 μL/min). m-n Presence of apoE3-647 and cascade blue in a representative deep cerebral parenchymal vein 60 min after intraparenchymal injection (caudate nucleus). Intracisternal apoE3-647 (magenta) and cascade blue (blue) entered brain via the penetrating cortical arterial vessels (red) and distributed within the parenchyma. Panels a-h are images after intracisternal injection of apoE3-647 and cascade blue in NG2-DsRed reporter mice. Lectin-FITC was injected intravascularly to identify vessels. Panels j-n are images after intraparenchymal (caudate nucleus) injection of apoE3-647 and cascade blue in NG2-DsRed reporter mice. Scale bars: A = 100 μm, B-D = 50 μm, E-H and J-N =10 μm. PVS = perivascular space
Fig. 5
Fig. 5
ApoE-isoform specific distribution around arteries. a-c Representative images of apoE2, apoE3 and apoE4 (colored red) radial distribution 15 min following their intracisternal injections. Scale bar 100 μm for the left panels and 50 μm for the middle/right panels. d Quantification of the distribution distance from the arteries. Values are mean ± SEM. N = 5–9. e FITC-apoE3 in the CSF binding to NeuN- positive neurons (red) in the vicinity of arteries. White arrows point to apoE3/NeuN- double positive cells (the image is 100 μm wide). The vasculature was outlined by intravascular labeling with lectin (blue)
Fig. 6
Fig. 6
CSF apoE distribution in brain is reduced in Aqp4 −/− mice. Representative images of FITC-apoE3 radial distribution from the arteries in littermate controls (a) and Aqp4 −/− (b) mice. c Quantification of the distribution distance from the arteries. Values are mean ± SEM, N = 5 mice per group
Fig. 7
Fig. 7
ApoE3 levels in brain cells increase following lenti-apoE3 transduction of the choroid plexus. a Lenti-apoE3 effectively transduced the choroid plexus and ependymal layer at 1 week post-transduction. ApoE3 immunolabeled with a human specific anti-apoE antibody. b-d Choroid plexus expression of apoE3 at 8 weeks post-transduction. Scale bar 100 μm. AQP1 (red; b); apoE3 (green; c) and merged images (d). e-j Parenchymal human apoE3 (green) at 1 (e-f), 4(g-h) and 8 (i-j) weeks post-transduction. Scale bar 100 μm. Neurons: NeuN-positive cells (blue). Astrocytes: GFAP -positive cells (red). k Human specific anti-apoE does not react with endogenous mouse apoE. l Quantification of apoE3 intensities in neurons (apoE co-localization with NeuN-positive cells) with post-transduction time. Lenti-apoE3 delivered intraventricularly (3 μL lenti- apoE (4.06 × 10⁸ TU/ml) and after 1 to 8 weeks the brains were perfusion fixed (PFA) followed by immunolabeling of brain sections. Representative images from 5 mice per group. Values are mean ± SEM. N = 5
Fig. 8
Fig. 8
Increased CSF and brain apoE3 levels in lenti-apoE3 transduced choroid plexus. a Representative Western blots of apoE3 standards (top) and apoE3 in CSF and plasma from lenti-EGFP (controls) and lenti-apoE3 transduced mice. Quantification of CSF apoE3 levels by Western blot analysis at 4 weeks post-transduction (b), and by ELISA at 4 (left) and 8 (right) weeks post-transduction (c). d Levels of brain endogenous apoE and human apoE3 in the transduced mice. e Quantification of mouse apoE levels by Western blot analysis. Values are mean ± SEM. N = 4-5. Intraventricular (unilateral) injection of 3 μL lenti-human apoE (4.06 × 10⁸ TU/ml) or 3 μL lenti-EGFP (1012 TU/ml). At 4 and 8 weeks post-transduction samples of CSF, plasma and brain were collected
Fig. 9
Fig. 9
Sleep deprivation reduces the apoE3 arterial radial diffusion and clearance. a Schematic representation of the experimental design. Representative images at low (left) and high (right) magnification of the cortex (b) and hippocampus (c) in mice on normal sleep cycle. Representative images at low (left) and high (right) magnification of the cortex (d) and hippocampus (e) in sleep deprived mice. f of the distribution distance from the arteries in the cortex of control (sleep (S); clear column) and sleep deprived (SD; red column) mice. Fluorescently-tagged apoE3 was injected into cisterna magna of NG2dsRed reporter mice and perfusion fixed (PFA) at 15 min. The vasculature was outline by lectin (gray). ApoE, green; NG2-dsRed, red. Scale bars 100 μm (A-D, left), 50 μm (A-D, right). g Schematic diagram showing the intracortical injection site. h-i 125I-ApoE3 and 14C-inulin clearance from the frontal cortex in the sleep and sleep deprived states. Values are mean ± SEM. N = 5 mice per group
Fig. 10
Fig. 10
Schematic diagram of our working model for apoE delivery and distribution by the glymphatic system. This schematic diagram shows the parenchymal distribution of CSF-derived apoE isoform-specific convective flow/bulk flow pattern (apoE2 > apoE3 > apoE4) around an artery. CSF-derived apoE is present on the vessel wall and around the artery. The apoE distribution is shown as a circle around the artery for simplicity but its bulk flow (unequal distribution around the artery). Within the brain there are many cells, such as neurons, astrocytes that express many membrane bound receptors that avidly binds apoE. Symbols: A - penetrating arteriole; V - vein; formula image - apoE; formula image - AQP4; There are many different types of apoE receptors, such as formula image - apoE receptor mainly on astrocyte and formula image - apoE receptor mainly on neuron

References

    1. Mahley RW, Rall SC., Jr Apolipoprotein E: far more than a lipid transport protein. Annu Rev Genomics Hum Genet. 2000;1:507–537. doi: 10.1146/annurev.genom.1.1.507. - DOI - PubMed
    1. Linton MF, Gish R, Hubl ST, Butler E, Esquivel C, Bry WI, Boyles JK, Wardell MR, Young SG. Phenotypes of Apolipoprotein-B and Apolipoprotein-E after Liver-Transplantation. J Clin Investig. 1991;88:270–281. doi: 10.1172/JCI115288. - DOI - PMC - PubMed
    1. Pitas RE, Boyles JK, Lee SH, Hui D, Weisgraber KH. Lipoproteins and their receptors in the central nervous system. Characterization of the lipoproteins in cerebrospinal fluid and identification of apolipoprotein B, E(LDL) receptors in the brain. J Biol Chem. 1987;262:14352–14360. - PubMed
    1. Hatters DM, Zhong N, Rutenber E, Weisgraber KH. Amino-terminal domain stability mediates apolipoprotein E aggregation into neurotoxic fibrils. J Mol Biol. 2006;361:932–944. doi: 10.1016/j.jmb.2006.06.080. - DOI - PubMed
    1. Verghese PB, Castellano JM, Holtzman DM. Apolipoprotein E in Alzheimer’s disease and other neurological disorders. Lancet Neurol. 2011;10:241–252. doi: 10.1016/S1474-4422(10)70325-2. - DOI - PMC - PubMed

Publication types