Review
. 2016 Dec;9(12):1446-1461.
doi: 10.1016/j.jcmg.2016.09.012.

Radiobiology in Cardiovascular Imaging

Affiliations
Review

Radiobiology in Cardiovascular Imaging

Pat Zanzonico et al. JACC Cardiovasc Imaging. 2016 Dec.

Abstract

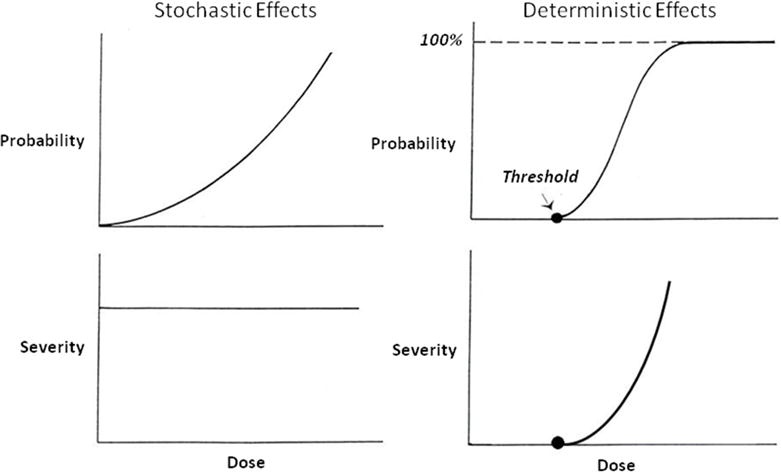
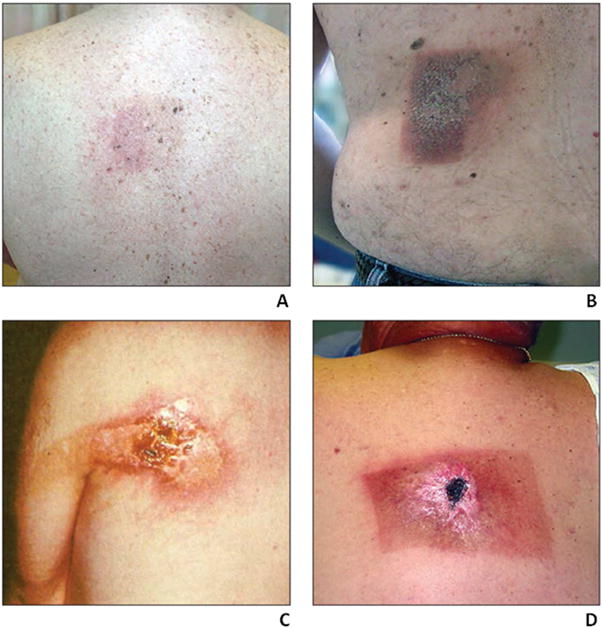
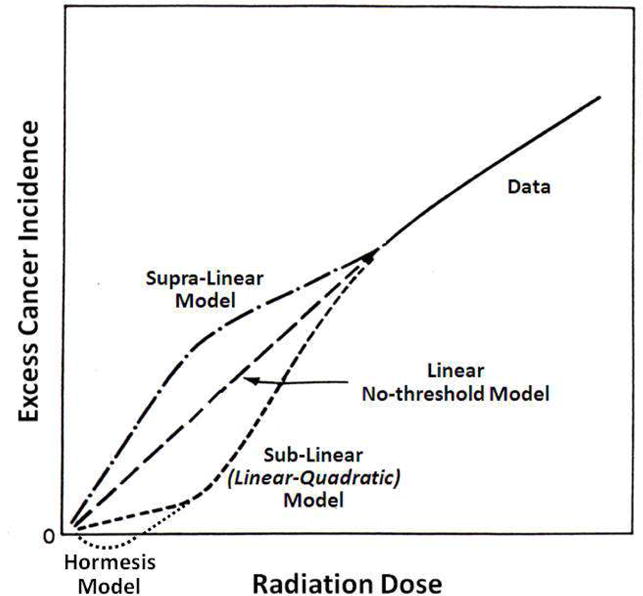
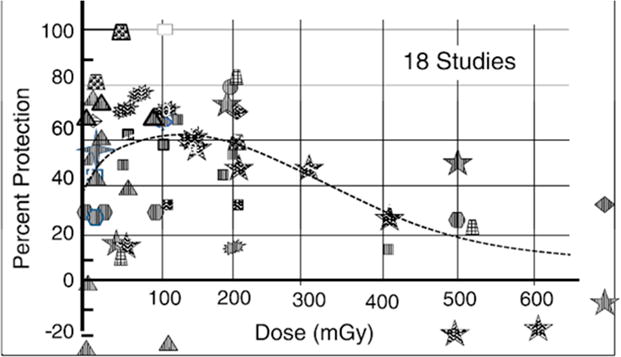
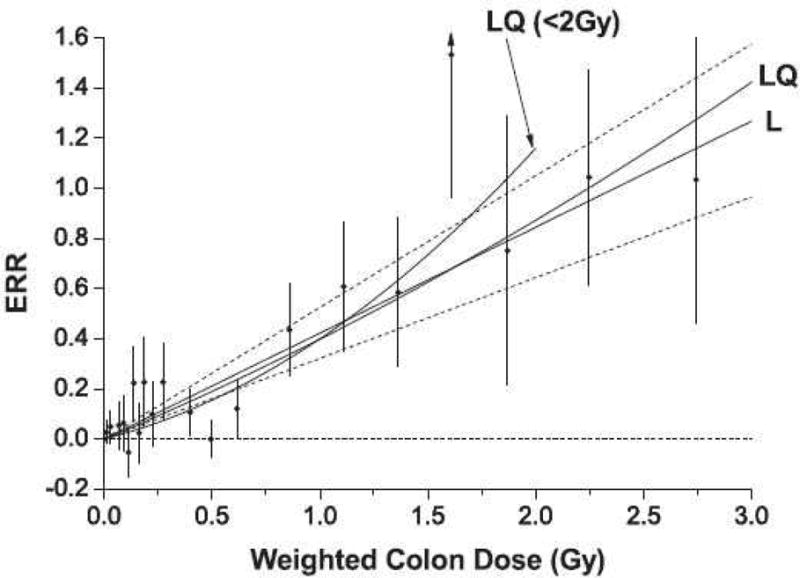
The introduction of ionizing radiation in medicine revolutionized the diagnosis and treatment of disease and dramatically improved and continues to improve the quality of health care. Cardiovascular imaging and medical imaging in general, however, are associated with a range of radiobiologic effects, including, in rare instances, moderate to severe skin damage resulting from cardiac fluoroscopy. For the dose range associated with diagnostic imaging (corresponding to effective doses on the order of 10 mSv [1 rem]), the possible effects are stochastic in nature and largely theoretical. The most notable of these effects, of course, is the possible increase in cancer risk. The current review addresses radiobiology relevant to cardiovascular imaging, with particular emphasis on radiation induction of cancer, including consideration of the linear nonthreshold dose-response model and of alternative models such as radiation hormesis.

Keywords: cancer risks; deterministic effects; hormesis; linear nonthreshold model; linear-quadratic model; radiation dosimetry; radiation effects; radiation genetic effects; radiobiology; reverse causation; stochastic effects.


Figures

Figure 1
Figure 1. Radiation effects
Stylized probability-dose and severity-dose relationships for stochastic and deterministic effects.
Figure 2
Figure 2. Radiation doses in cardiovascular imaging
Effective doses for common cardiovascular imaging procedures with current instruments and techniques. For comparison, the average annual effective dose per capita from natural background radiation in the Unites States is also shown (6). Reproduced with permission.
Figure 3
Figure 3. Congenital abnormalities and perinatal death from in utero irradiation
Incidence (percentage) of congenital abnormalities and of pre-natal and neonatal death in mice receiving an x-ray absorbed dose 2 Gy in utero as a function of gestational age (23, 26). Adapted from reference (23).
Figure 4
Figure 4. Mental retardation in children irradiated in utero
Incidence (percentage) of severe mental retardation in children irradiated in utero at the time of the atomic bombings of Hiroshima and Nagasaki (combined data) as a function of absorbed dose, stratified according to gestational age at the time of the bombings (24). Reproduced with permission.
Figure 5
Figure 5. Skin reactions from excessive fluoroscopic irradiation
Photographs of representative skin reaction grades resulting from excessive fluoroscopic irradiation and corresponding to those described in Table 3: A. Grade 1, B. Grade 2, C. Grade 3, and D. Grade 4 (55, 56). Reproduced with permission.
Figure 6
Figure 6. Dose-response curves for radiation carcinogenesis
Stylized dose-response curves for radiation carcinogenesis for the supra-linear, linear no-threshold (LNT), sub-linear (or linear-quadratic), and hormetic models. Note that for the hormetic model the excess incidence becomes negative at low radiation doses, indicating a cancer incidence less than the naturally occurring incidence and thus a radioprotective effect.
Figure 7
Figure 7. Radiation hormesis in pre-clinical models
Dose dependence of the radioprotective, or hormetic, adaptive response of acute low-dose irradiation in pre-clinical models. Each observation point of protection per study was plotted individually as a function of dose, yielding a total of 54 observation points. The categories of response include molecular-level, cellular-level, and cancer-level responses and included enzyme inactivation, DNA repair changes, chromosomal changes such as micronuclei formation, cell death, immune response, experimental cancer and metastasis induction, and by-stander protection (83). Reproduced with permission.
Figure 8
Figure 8. Risk of cancer among A-bomb survivors
Excess relative risk (ERR) for all solid cancers as a function of colon absorbed dose (as a surrogate of effective dose) in the A-bomb Life-Span Study (LSS). The black circles represent ERR and 95% CI for the dose categories and the solid lines the fits of the linear (L) (with 95% confidence intervals (CI) (dotted lines)) and linear-quadratic (LQ) models to these data. The fit of the LQ model for the data restricted to doses less than 2 Gy (LQ< 2 Gy) is also shown (32). Reproduced with permission.

References

    1. Ionizing Radiation NCRP. NCRP Report 160. Bethesda, MD: National Council on Radiation Protection and Measurements (NCRP); 2009. Exposure of the Population of the United States.
    1. Amis ES, Jr, Butler PF, Applegate KE, et al. American College of Radiology white paper on radiation dose in medicine. J Am Coll Radiol. 2007;4:272–84. - PubMed
    1. Redberg R, Smith-Bindman R. We are giving ourselves cancer. New York Times (Op-Ed) 2014
    1. Einstein AJ. Effects of radiation exposure from cardiac imaging: how good are the data? J Am Coll Cardiol. 2012;59:553–65. - PMC - PubMed
    1. Einstein AJ, Knuuti J. Cardiac imaging: does radiation matter? Eur Heart J. 2012;33:573–8. - PMC - PubMed

MeSH terms