. 2017 Mar;152(4):762-766.e7.
doi: 10.1053/j.gastro.2016.12.001. Epub 2016 Dec 5.

Targeted Apoptosis of Parietal Cells Is Insufficient to Induce Metaplasia in Stomach

Affiliations

Targeted Apoptosis of Parietal Cells Is Insufficient to Induce Metaplasia in Stomach

Joseph Burclaff et al. Gastroenterology. 2017 Mar.

Abstract

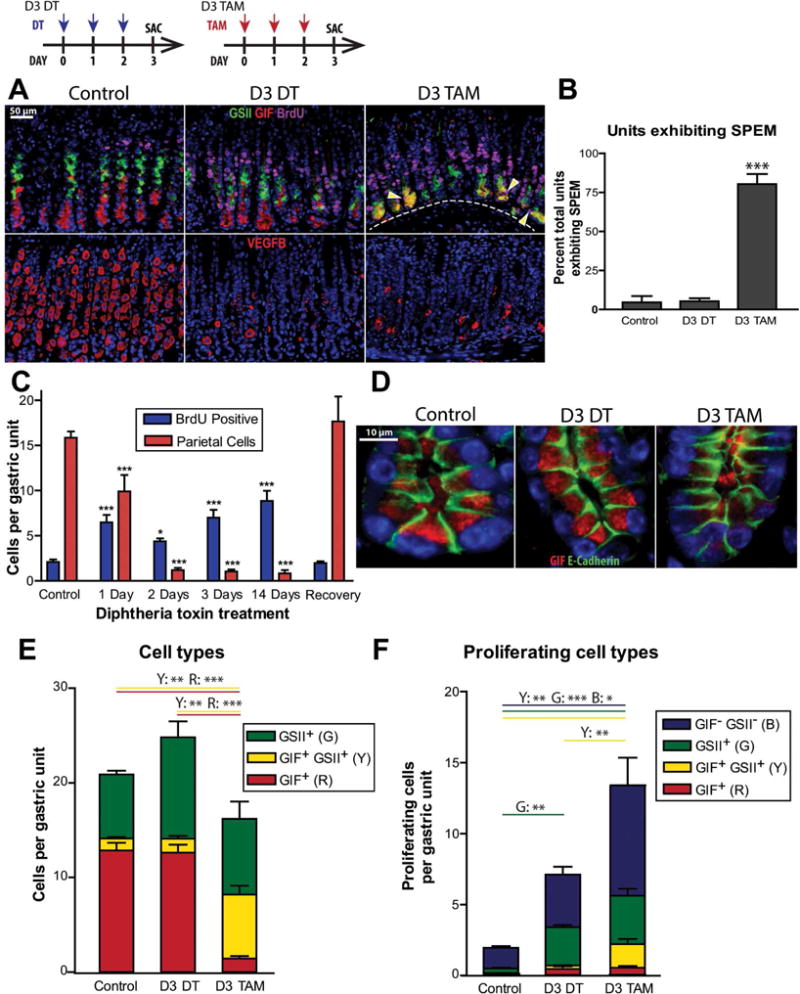
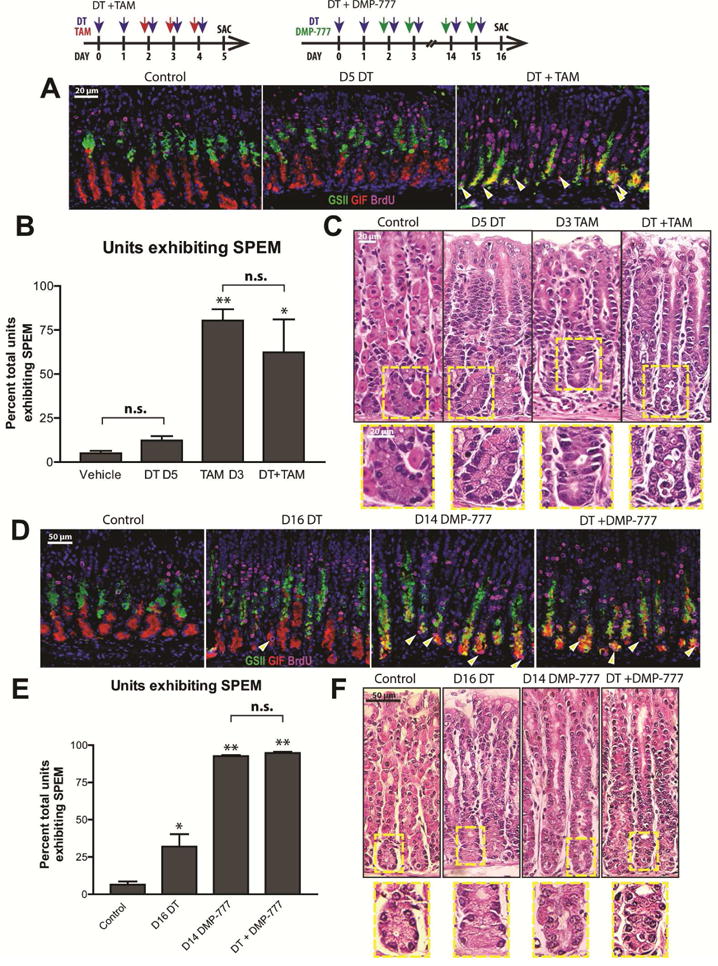
Parietal cell atrophy is considered to cause metaplasia in the stomach. We developed mice that express the diphtheria toxin receptor specifically in parietal cells to induce their death, and found this to increase proliferation in the normal stem cell zone and neck but not to cause metaplastic reprogramming of chief cells. Furthermore, the metaplasia-inducing agents tamoxifen or DMP-777 still induced metaplasia even after previous destruction of parietal cells by diphtheria toxin. Atrophy of parietal cells alone therefore is not sufficient to induce metaplasia: completion of metaplastic reprogramming of chief cells requires mechanisms beyond parietal cell injury or death.

Keywords: Atp4b-Cre; CD44 Variant 9; Organoids; SPEM.


Conflict of interest statement

The authors have no conflicts to disclose.

Figures

Figure 1
Figure 1
A) Stomachs following three days of vehicle, DT, or TAM (top: green: GSII, red: anti-GIF, magenta: anti-BrdU); arrowheads = proliferating SPEM cells. Bottom: red anti-VEGFB (parietal cells). B,C) Quantification. D) Unit bases with anti-E-Cadherin (green) and anti-GIF (red). E) Quantification of chief cells (GIF+, red), SPEM cells (GIF+/GSII+, yellow), and neck cells (GSII+, green) per unit. F) Quantification of proliferating cell types per unit with isthmal (double negative) cells in blue. “*” (p<0.05), “**” (p<0.01), “***” (p<0.001) in ANOVA; (B,C) with Dunnett; (E,F) with Tukey; n≥3 mice/group.
Figure 2
Figure 2
A Stomachs following five days control, DT, or DT then TAM (green: GSII, red: anti-GIF, magenta: anti-BrdU; arrowheads = proliferating SPEM cells. B) Quantification. C) H&E. D) Stomachs following 16 days control, DT, or DT then DMP-777, stained as panel A. E) Immunofluorescence data quantified. F) H&E. “*” (p<0.05), “**” (p<0.01), “***” (p<0.001) vs. Control, ANOVA with Dunnett; n≥3 mice/group.

References

    1. Adams JF, et al. Lancet. 1964;1:401–403. - PubMed
    1. Lennerz JK, et al. Am J Pathol. 2010;177:1514–1533. - PMC - PubMed
    1. Huh WJ, Khurana SS, et al. Gastroenterology. 2012;142:21–24.e27. - PMC - PubMed
    1. Nomura S, Yamaguchi H, et al. Am J Physiol Gastrointest Liver Physiol. 2005;288:G362–375. - PubMed
    1. Saenz JB, et al. Methods Mol Biol. 2016;1422:329–339. - PMC - PubMed

MeSH terms