. 2017 Feb 9;7(2):387-398.
doi: 10.1534/g3.116.037150.

The Long Noncoding RNA Transcriptome of Dictyostelium discoideum Development

Affiliations

The Long Noncoding RNA Transcriptome of Dictyostelium discoideum Development

Rafael D Rosengarten et al. G3 (Bethesda). .

Abstract

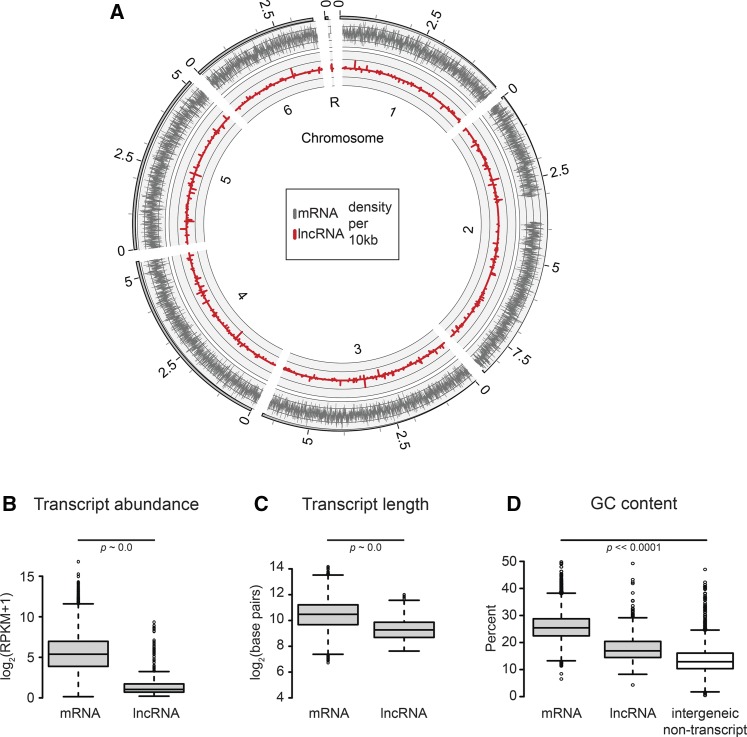
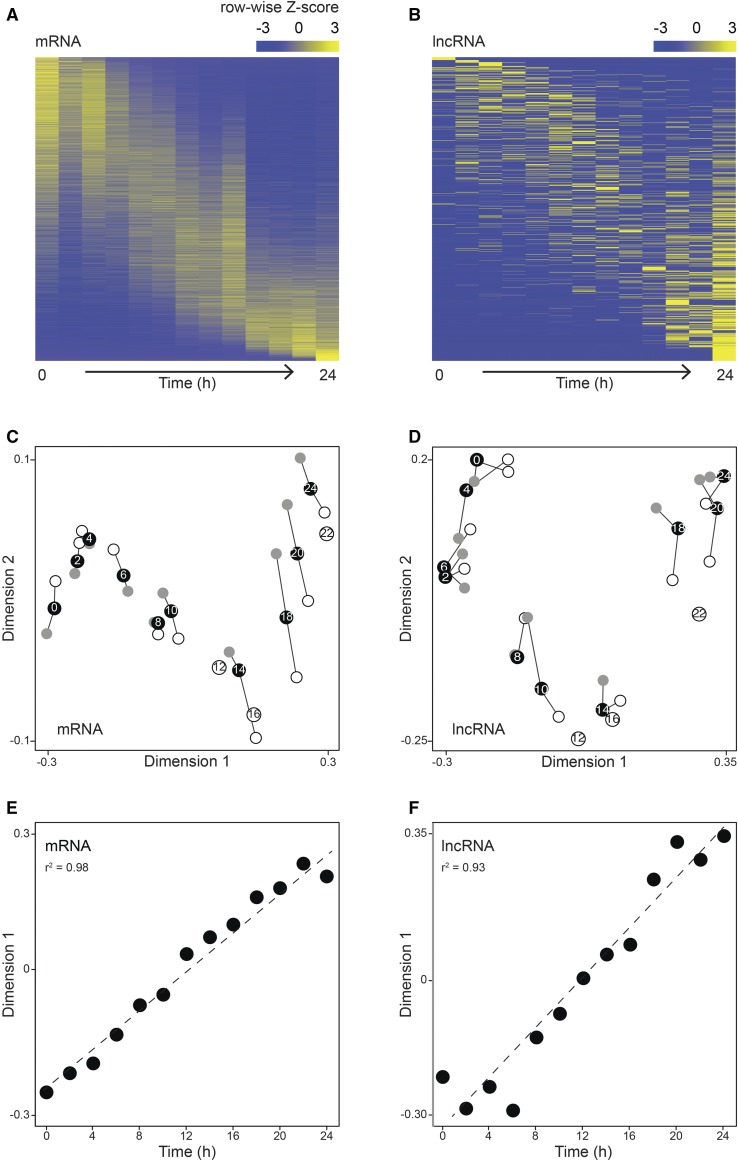
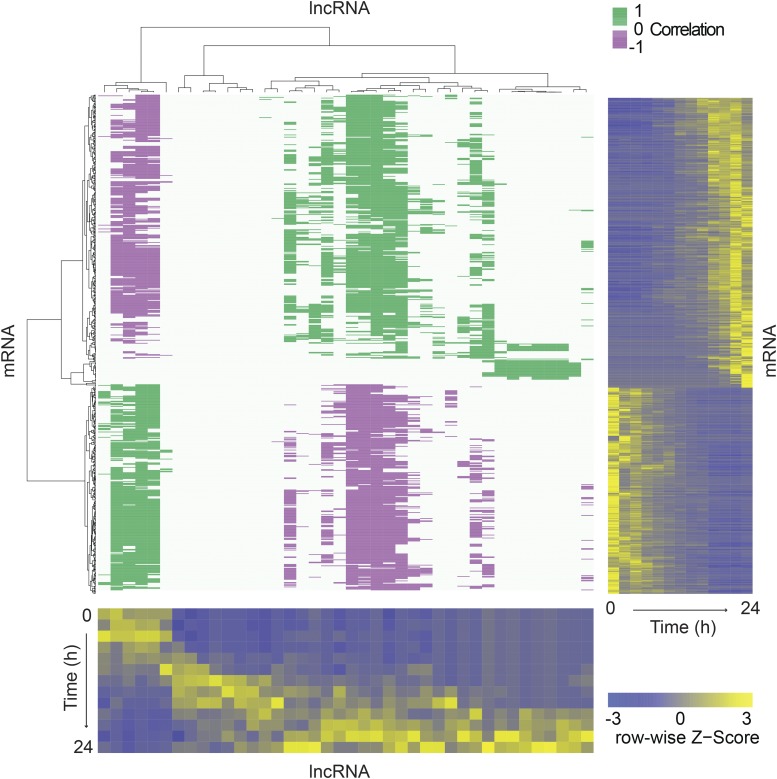
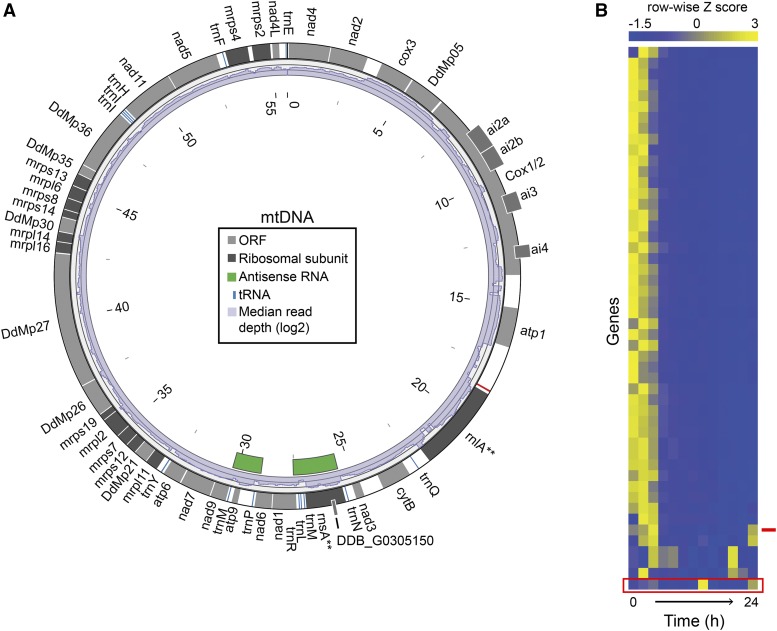
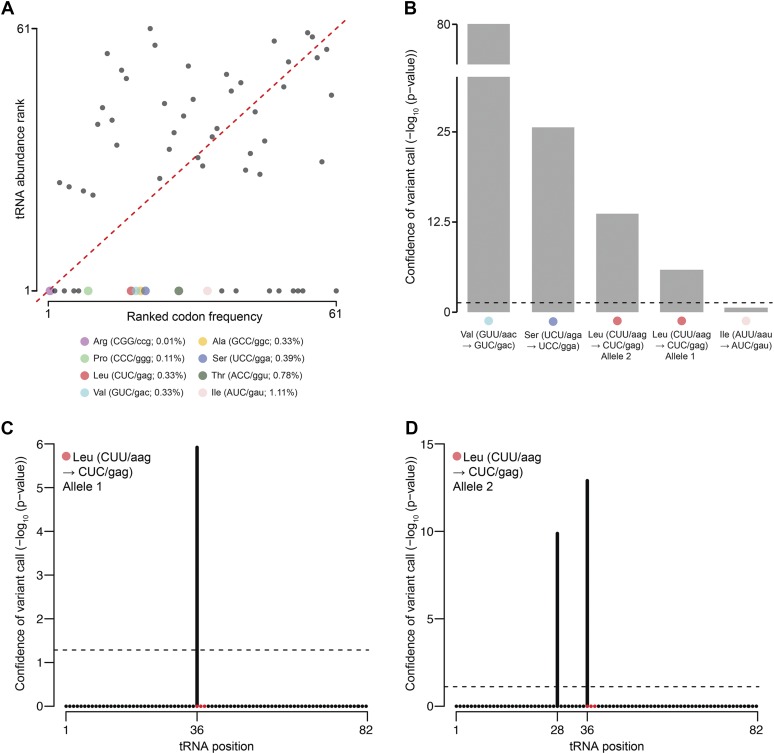
Dictyostelium discoideum live in the soil as single cells, engulfing bacteria and growing vegetatively. Upon starvation, tens of thousands of amoebae enter a developmental program that includes aggregation, multicellular differentiation, and sporulation. Major shifts across the protein-coding transcriptome accompany these developmental changes. However, no study has presented a global survey of long noncoding RNAs (ncRNAs) in D. discoideum To characterize the antisense and long intergenic noncoding RNA (lncRNA) transcriptome, we analyzed previously published developmental time course samples using an RNA-sequencing (RNA-seq) library preparation method that selectively depletes ribosomal RNAs (rRNAs). We detected the accumulation of transcripts for 9833 protein-coding messenger RNAs (mRNAs), 621 lncRNAs, and 162 putative antisense RNAs (asRNAs). The noncoding RNAs were interspersed throughout the genome, and were distinct in expression level, length, and nucleotide composition. The noncoding transcriptome displayed a temporal profile similar to the coding transcriptome, with stages of gradual change interspersed with larger leaps. The transcription profiles of some noncoding RNAs were strongly correlated with known differentially expressed coding RNAs, hinting at a functional role for these molecules during development. Examining the mitochondrial transcriptome, we modeled two novel antisense transcripts. We applied yet another ribosomal depletion method to a subset of the samples to better retain transfer RNA (tRNA) transcripts. We observed polymorphisms in tRNA anticodons that suggested a post-transcriptional means by which D. discoideum compensates for codons missing in the genomic complement of tRNAs. We concluded that the prevalence and characteristics of long ncRNAs indicate that these molecules are relevant to the progression of molecular and cellular phenotypes during development.

Keywords: Dictyostelium discoideum; development; noncoding RNA; ribosomal RNA depletion; slime mold; transcriptome time course.


Figures

Figure 1
Figure 1
Long noncoding RNAs are distributed throughout the genome and are characteristically distinct from annotated mRNAs. (A) Transcript density is shown on a Circos plot. The outermost ring, shaded solid gray, represents the scale of each chromosome, in megabase pairs. The six chromosomes and the ribosomal palindrome are labeled inside the plot (1–6, R). The black bars/white spaces on chromosomes 2 and R mark large duplications for which reads are mapped only to one region. Transcript density was calculated as the percentage of base pairs per 10 kbp window that mapped to messenger mRNA (gray, outer plot) and lncRNA (red, inner plot). Each plot is scaled from 0 to 1, with top-strand transcripts above the zero-axis, and bottom-strand transcripts below this axis. The distributions of (B) maximum transcript abundance, (C) transcript length, and (D) GC content are shown on the y-axis of the box and whisker plots, with RNA type on the x-axis. In all cases, the box height represents the first to third quartiles and the horizontal line, the median value. Whisker bars mark 1.5-fold the 1st/3rd quartile range, with outliers displayed as circles. (B) Maximum transcript abundance was determined for each transcript model across all developmental time points, and is plotted on a log scale. (C) Transcript length was also log scaled. (D) For the comparison of GC content, in addition to the three RNA classes, we randomly sampled 1000 intergenic regions per chromosome that did not overlap with any transcript model. All four distributions were significantly different. For plots (B–D), p-values were determined by Mann-Whitney U-test. lncRNA, intergenic long noncoding RNA; mRNA, messenger RNA; RPKM, reads per kb per million.
Figure 2
Figure 2
ncRNAs are developmentally regulated as well as mRNAs. (A and B) Heatmaps reveal temporal changes in RNA abundance throughout development. The heatmap rows each represent a gene/transcript model, clustered based on their transcript abundance, and columns correspond to sample time points (2 hr intervals), increasing from left to right. RNA abundance values are represented as row-wise Z-scores and are color coded as indicated in the scale above each heatmap. (C and D) Multidimensional scaling shows the distances between transcriptomes at each time point for each class of RNA. Dimension 1 is on the x-axis and dimension 2 on the y-axis, and distances between points (arbitrary units, not shown) on the two-dimensional plane are inversely proportional to the similarity (Spearman’s correlation) of the transcriptomes. Black circles represent sample averages with the time point labeled, while individual biological replicates 1 and 2 are shown as open and gray circles, respectively, connected by whiskers. Only replicate 1 for time points 16 and 22 passed our quality control, and thus these are shown as labeled open circles. (E and F) Plots of dimension 1 values (arbitrary units, y-axis) vs. time (hours, x-axis) for mRNA (E) and lncRNA (F). The dotted diagonal represents a linear best-fit curve, with coefficients of determination (r2) displayed on each plot. lncRNA, intergenic long noncoding RNA; mRNA, messenger RNA; ncRNA, noncoding RNA.
Figure 3
Figure 3
Subsets of lncRNAs are strongly correlated with mRNAs. The purple/green heatmap represents a matrix that relates the transcription profiles of 51 abundant lncRNAs (columns: x-axis dendrogram, bottom heatmap) with 858 developmentally regulated mRNAs (rows: y-axis dendrogram, side heatmap). Spearman’s correlation coefficients (false discovery rate < 0.01) are shown in green (≥0.85, positive correlation) and purple (≤−0.85, negative correlation) as indicated by the green/white/purple scale bar. Dendrograms display hierarchical clustering of transcripts based on their abundance during development, which is shown in the blue/yellow heatmaps. The color range is scaled to the row-wise Z-distribution as indicated by the blue/yellow scale bar. In these heatmaps, one axis represents developmental time points, from 0 to 24 hr in 2 hr increments as indicated, and the other axis represents individual transcripts. lncRNA, intergenic long noncoding RNA; mRNA, messenger RNA.
Figure 4
Figure 4
The mitochondrial transcriptome. (A) All ORFs (gray boxes), including genes encoding ribosomal proteins and rRNA subunits (dark gray boxes), and tRNAs (blue boxes) are transcribed in the same, clockwise direction. Genes that overlap other models are offset. The red tick (around four o’clock) indicates the single transcription start site. Distances are marked in kilobases (kb) inside the circle. asRNA transcripts are shown as green boxes. Median read coverage, calculated for 100 bp sliding windows, is shown as a histogram (purple bars) inside of the gene track. The values were log2 transformed for scale, and the plot ranges from 0 to 15. Although rRNAs (**) were among the most abundant transcripts, these molecules were targeted for depletion, so this read density likely does not reflect the true abundances. (B) A heatmap of mtRNA expression reveals declining abundance of most transcripts, and a spike in asRNA at 14 hr, during development. Rows each represent a gene/transcript model, sorted by similarity, and columns correspond to sample time points (2 hr intervals), increasing from 0 hr on the left to 24 hr on the right. RNA abundance values are represented as row-wise Z-scores and are color coded as indicated in the scale above the heatmap. asRNAs are marked with a red box and a red tick. asRNA, antisense RNA; mtDNA, mitochondrial DNA; mtRNA, mitochondrial RNA; ORF, open reading frame; rRNA, ribosomal RNA; tRNA, transfer RNA.
Figure 5
Figure 5
Post-transcriptional modifications of tRNAs may compensate for some codon-specificity missing from the genome. (A) We plotted the rank order (1 is the lowest) of tRNA transcript abundance (circles, y-axis) vs. the rank order of the codon frequency in the D. discoideum exome (x-axis). The stop codons were removed, thus the axes scale to 61 rather than 64. The dotted red line represents the y = x line. Twenty codons do not have matching tRNAs in the genome, thus the developmental abundance of the cognate tRNA was 0 (rank = 1; parallel to X-axis), whereas the rest were ranked 21–61. Eight of the unmatched tRNA–codon pairs, which we hypothesized undergo post-transcriptional editing, are shown as larger colored circles identified in the legend. They are annotated with the amino acid specificity, followed by (CODON/anticodon, codon frequency %). (B) Statistical support for the detection of anticodon modifications that mimic four of the eight unmatched tRNAs is shown as −log10(p-value) on the y-axis. The horizontal dotted line corresponds to a p-value = 0.05. The y-axis is discontinuous between values 25 and 80. The cognate tRNA for the codon CUU (tRNA-Leu-AAG) has two alleles encoded in the genome that undergo editing events in their anticodon region (red circles) (C) and (D). Both had a significant modification detected at base 36, the first position of the anticodon. Allele 2 (D) had a second modification at base 28. Modifications are marked by vertical black bars, the height of which indicates the statistical support (y-axis). The positions of the modifications are indicated on the x-axis. The horizontal dotted line corresponds to a p-value of 0.05. tRNA, transfer RNA.

Similar articles

Cited by

References

    1. Adiconis X., Borges-Rivera D., Satija R., DeLuca D. S., Busby M. A., et al. , 2013. Comparative analysis of RNA sequencing methods for degraded or low-input samples. Nat. Methods 10: 623–629. - PMC - PubMed
    1. Andrews, S., 2010 FastQC: a Quality Control Tool for High Throughput Sequence Data. Available at: http://www.bioinformatics.babraham.ac.uk/projects/fastqc. Accessed: June 7, 2016.
    1. Aspegren A., Hinas A., Larsson P., Larsson A., Söderbom F., 2004. Novel non-coding RNAs in Dictyostelium discoideum and their expression during development. Nucleic Acids Res. 32: 4646–4656. - PMC - PubMed
    1. Avesson L., Schumacher H. T., Fechter P., Romby P., Hellman U., et al. , 2011. Abundant class of non-coding RNA regulates development in the social amoeba Dictyostelium discoideum. RNA Biol. 8: 1094–1104. - PubMed
    1. Avesson L., Reimegård J., Wagner E. G. H., Söderbom F., 2012. MicroRNAs in Amoebozoa: deep sequencing of the small RNA population in the social amoeba Dictyostelium discoideum reveals developmentally regulated microRNAs. RNA 18: 1771–1782. - PMC - PubMed

Publication types