. 2016 Dec;9(12):e003923.
doi: 10.1161/CIRCEP.116.003923.

Scn2b Deletion in Mice Results in Ventricular and Atrial Arrhythmias

Affiliations

Scn2b Deletion in Mice Results in Ventricular and Atrial Arrhythmias

Yangyang Bao et al. Circ Arrhythm Electrophysiol. 2016 Dec.

Abstract

Background: Mutations in SCN2B, encoding voltage-gated sodium channel β2-subunits, are associated with human cardiac arrhythmias, including atrial fibrillation and Brugada syndrome. Because of this, we propose that β2-subunits play critical roles in the establishment or maintenance of normal cardiac electric activity in vivo.

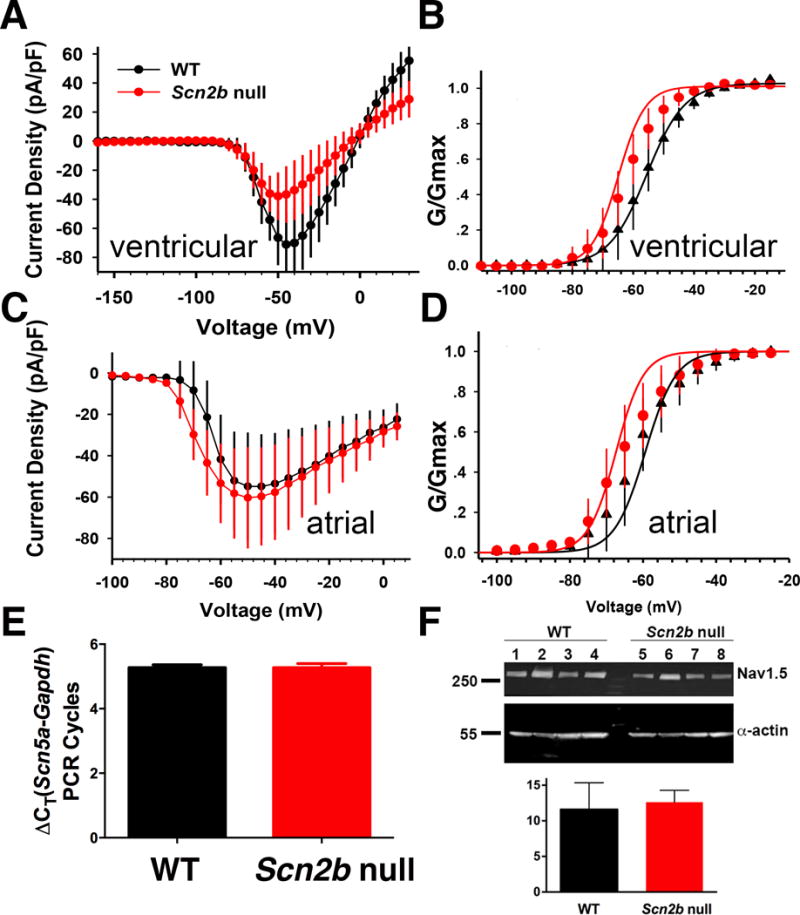
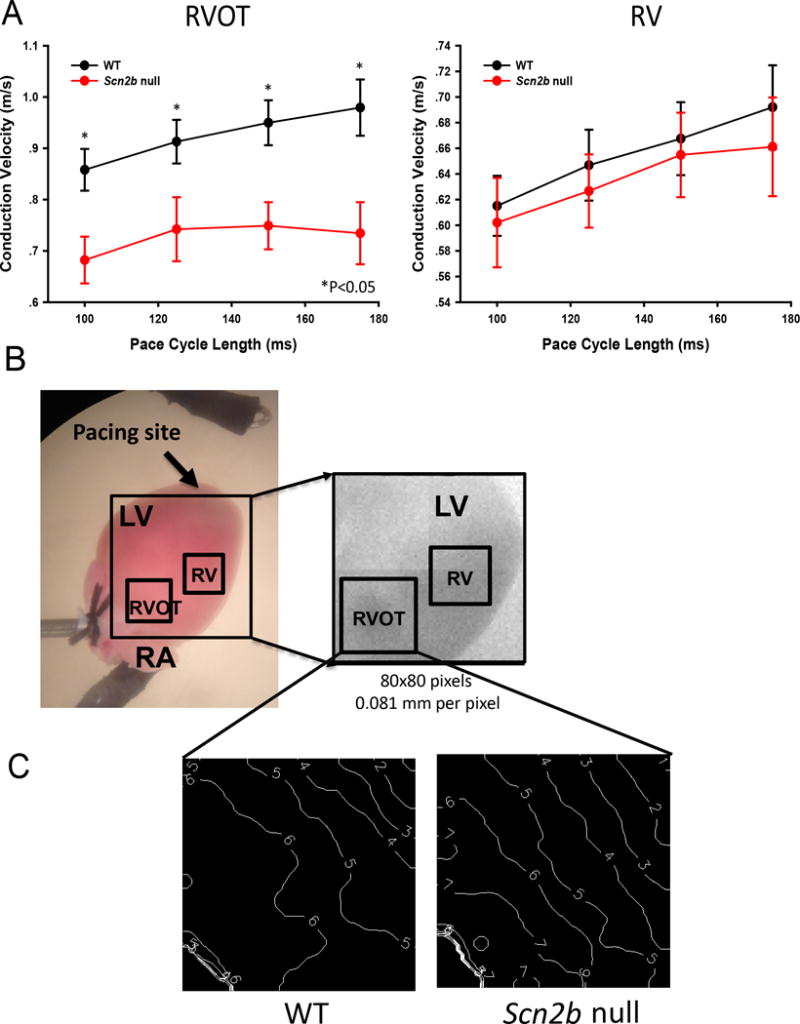
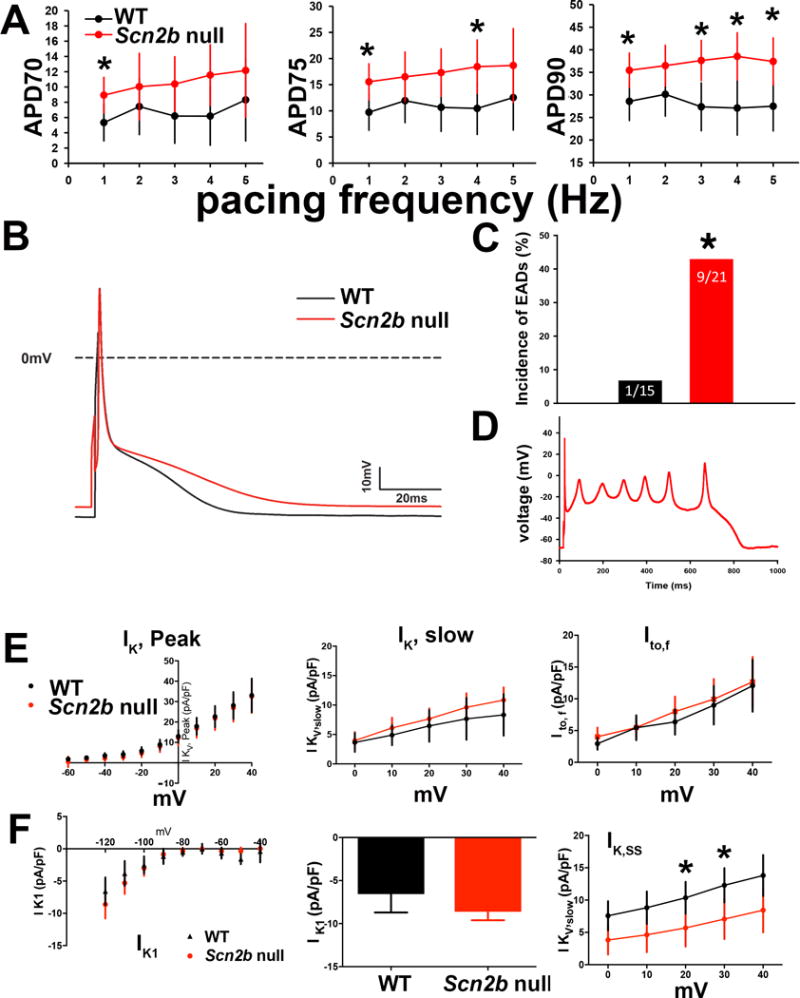
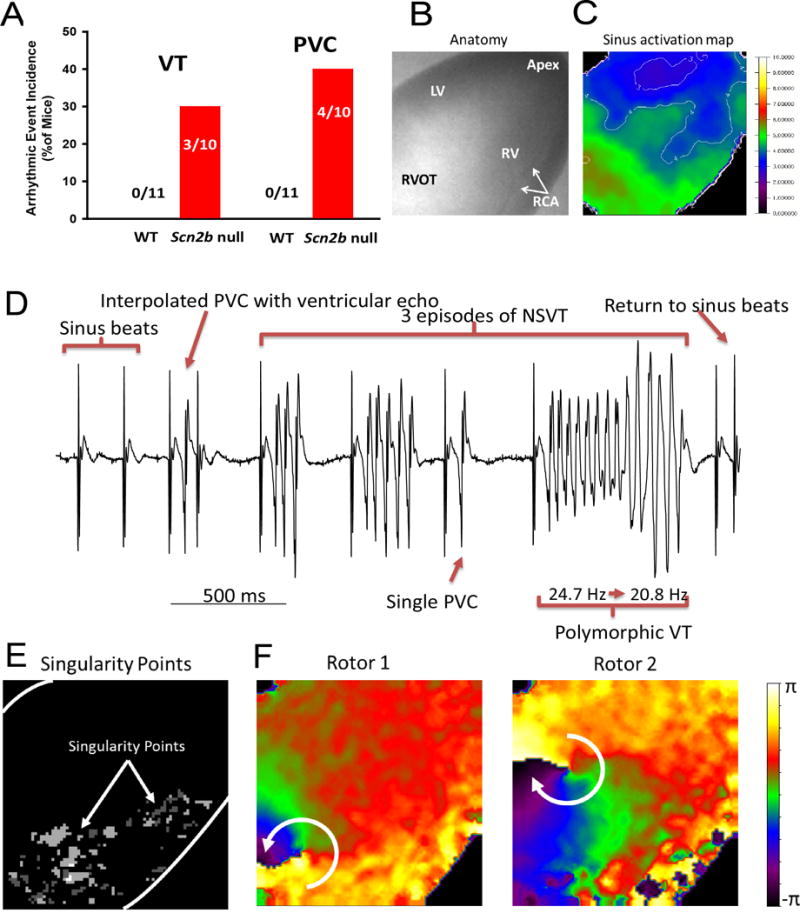
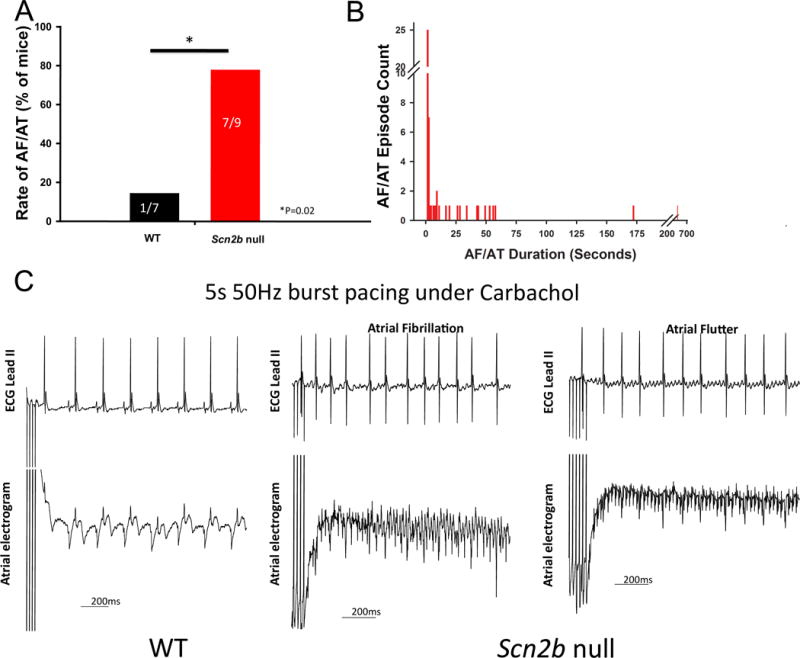
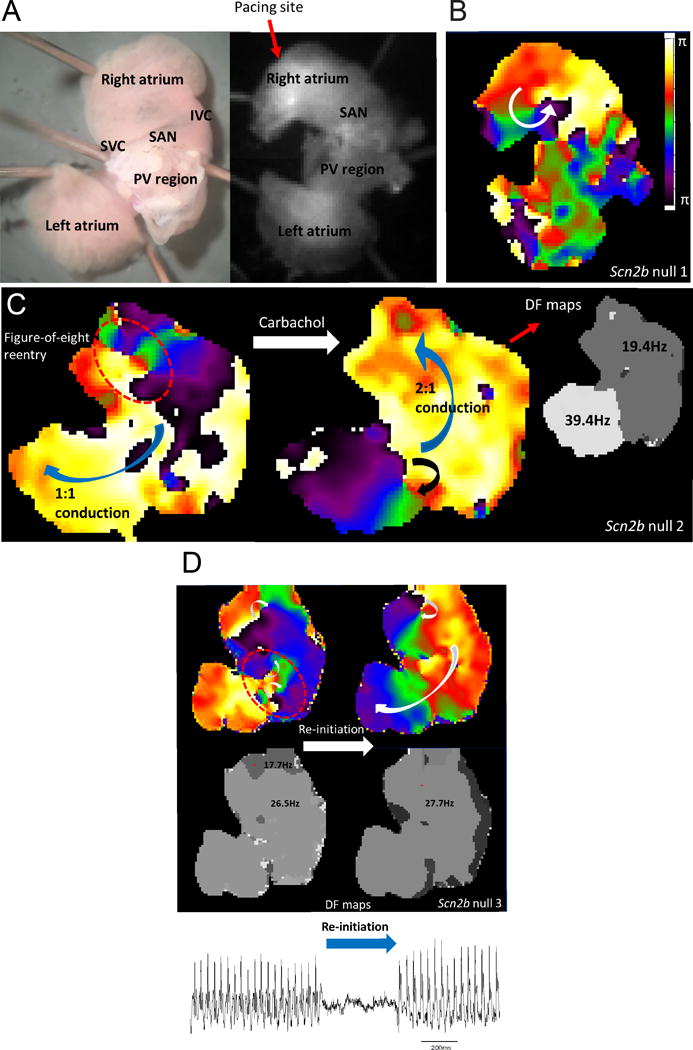
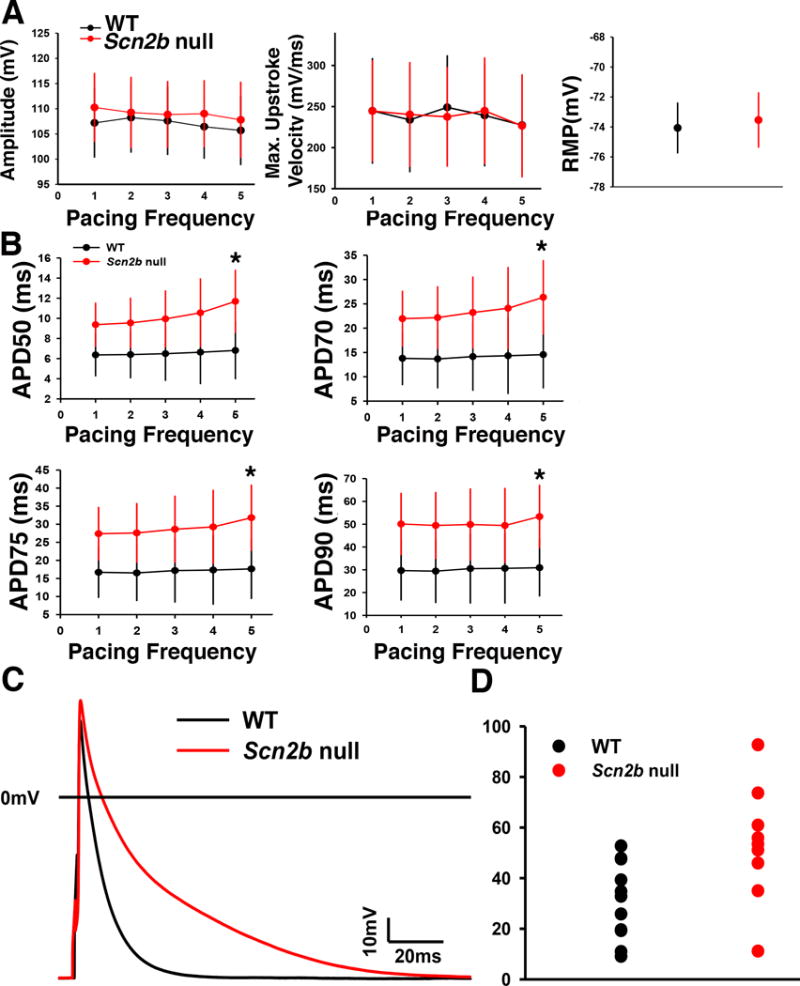
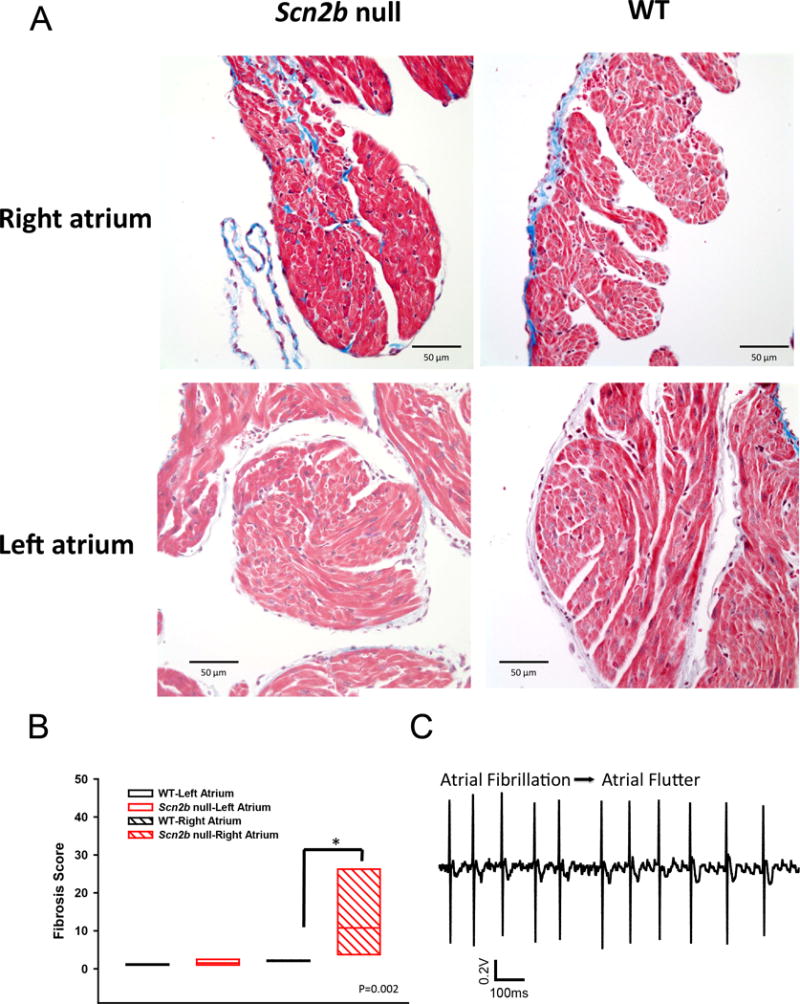
Methods and results: To understand the pathophysiological roles of β2 in the heart, we investigated the cardiac phenotype of Scn2b null mice. We observed reduced sodium and potassium current densities in ventricular myocytes, as well as conduction slowing in the right ventricular outflow tract region. Functional reentry, resulting from the interplay between slowed conduction, prolonged repolarization, and increased incidence of premature ventricular complexes, was found to underlie the mechanism of spontaneous polymorphic ventricular tachycardia. Scn5a transcript levels were similar in Scn2b null and wild-type ventricles, as were levels of Nav1.5 protein, suggesting that similar to the previous work in neurons, the major function of β2-subunits in the ventricle is to chaperone voltage-gated sodium channel α-subunits to the plasma membrane. Interestingly, Scn2b deletion resulted in region-specific effects in the heart. Scn2b null atria had normal levels of sodium current density compared with wild type. Scn2b null hearts were more susceptible to atrial fibrillation, had increased levels of fibrosis, and higher repolarization dispersion than wild-type littermates.

Conclusions: Genetic deletion of Scn2b in mice results in ventricular and atrial arrhythmias, consistent with reported SCN2B mutations in human patients.

Keywords: action potentials; atrial fibrillation; fibrosis; potassium channels; sodium channels.


Figures

Figure 1
Figure 1
INa in ventricular and atrial cardiomyocytes. A. Null ventricular myocytes have decreased INa density over a voltage range from −50 mV to −20 mV (*P<0.05, null: n=12, N=6; WT: n=9, N=6, MRE analysis,) with no differences in cell capacitance between genotypes (Scn2b null vs WT: 115.9±13.3, n=9, N=6, vs 85.85±11.8, n=12, N=6; P=0.136, MRE analysis). B. Scn2b deletion had no effect on the voltage-dependence of activation (p=0.065, null: n=12 N=6; WT: n=9, N=6, MRE analysis) but decreased the slope factor κ (p=0.005, null: n=12, N=6; WT: n=9 N=6, Mixed Effect Regression analysis,). C. No change in atrial INa density between genotypes (P=0.07 to 0.92 over a voltage range from −100mV to 5mV, null: n=15, N=3; WT: n=12, N=3, MRE analysis). D. Scn2b deletion had no effect on the voltage-dependence of activation (P=0.15) or slope factor κ (P=0.56) (null: n=15, N=3; WT: n=12, N=3, MRE analysis). E. qRT-PCR shows no difference in levels of Scn5a transcript between null and WT ventricle relative to GAPDH controls (null: N=6, WT: N=6, P=0.98, Student’s T-test). F. Western blotting shows no difference in Nav1.5 protein levels between null and WT ventricle (upper panel). α-actin was used as a loading control for quantification (lower panel). (WT: N=4; Null: N=4, P=0.63, Student’s T-test). n: number of cells tested. N: number of animals tested.
Figure 2
Figure 2
Conduction velocity is decreased in the null RVOT. A. Conduction velocity is decreased in the RVOT but not RV free wall (null: N=9; WT: N=11) paced at cycle lengths (CL) of 100ms P=0.011; CL=125ms, P=0.032; CL=150ms *P=0.015; CL=175ms P=0.012; Student’s T-test or Mann-Whitney Rank Sum Test where applicable. B. Langendorff heart prep during optical mapping. Box: region of measurement. C. Representative activation maps from null and WT at 150 ms CL. White lines: isochrone lines. Numbers indicate time in ms. Isochrone lines show conduction slowing in the null RVOT. N: number of animals tested.
Figure 3
Figure 3
AP and IK in single RVOT myocytes. A. Late phase APD values (APD70–90) were prolonged in nulls (WT: n=10–14, N=8; Null: n=12–16, N=5; *P=0.01–0.04, as indicated, MRE analysis). WT: black. Null: red. B. Representative AP traces. WT: black. Null: red. The final phase of the null AP is prolonged compared to WT. C. Null myocytes exhibited a higher incidence of early afterdepolarizations (EADs) than WT (P=0.024, Fisher’s exact test). D. Representative null EAD trace paced at 4Hz. E. Null myocytes have reduced IK, SS density. Upper panels: I-V curves for IK, peak, IK, slow, Ito, and IK, SS measured in RVOT myocytes Lower panels: Peak current at +40 mV for IK, peak (WT: 33.35 (24.46,42.24) pA/pF, n=13, N=5; null: 32.43 (22.98,41.88) pA/pF, n=10, N=6; P=0.88), IK, slow at +40 mV (WT: 7.96 (4.15,11.77), n=13, N=5; null: 10.81 (6.98,14.64) pA/pF, n=10, N=6; P=0.28), Ito at +40 mV (WT: 12.18 (8,16.36), n=13, N=5; null: 12.35 (7.8,16.9) pA/pF, n=10, N=6; P=0.95), and IK,ss at +20 mV (WT: 10.60 (7.47,13.73), n=13, N=5; null: 5.70 (2.50,8.91) pA/pF, n=10, N=6; P=0.04), at +30 mV (WT: 12.54 (8.91,16.17), n=13, N=5; null: 7.02 (3.41,10.64) pA/pF, n=10, N=6; P=0.04), and at +40 mV (WT: 14.13 (9.77,18.49), n=13, N=5; null: 8.32 (4.02,12.62) pA/pF, n=10, N=6; P=0.07) WT: black. Null: red. F. Scn2b null myocytes have normal IK1 density. Upper panel: No differences in inward rectifying current (IK1) between null (red) and WT (black) RVOT myocytes. Lower panel: Bar graph of IK1 at −120 mV (WT: −6.47(−9.35,−3.58), n=11, N=5; null: −8.24(−10.89,−5.59) pA/pF, n=12, N=6; P=0.35). Results in E and F are reported as mean (95% confidence interval), with significance determined using MRE analysis.
Figure 4
Figure 4
Arrhythmic events captured in Scn2b null hearts by optical mapping. A. Incidence of PVC and VT in WT (0 of 11) vs. null (4 of 10 and 3 of 10, respectively) (P=0.02 and P=0.09, respectively, Fisher’s Exact Test). B. Anatomical view of the heart during optical mapping. LV: left ventricle, RV: right ventricle, RVOT: right ventricular outflow tract, RCA: right coronary artery. C. Activation map of a sinus beat. Normal epicardial activation during the sinus beat had two breakthroughs on the LV and RV free wall close to the apex and then the excitation wave front propagated towards the base of the heart. White lines: isochrone lines in ms. D. Volume-conducted ECG (bipolar mode, frontal plane) showed 3 episodes of polymorphic NSVT and PVC. Each episode of VT was triggered by a PVC, sharing the same morphology as a single independent PVC, indicating a focal source of the triggering ectopic beat. The polymorphic VT had a frequency transition from 24.7 Hz to 20.8 Hz. E. Singularity point map showing that the location of the rotors (white dots) remained in the RVOT during most of the recording period. F. Phase map snapshots of two rotors during VT. Rotors are dynamic, spin in multiple directions, and meander to other regions, giving rise to the polymorphic appearance of ECG.
Figure 5
Figure 5
Scn2b null atria are more susceptible to AF. AF was defined as episodes of >1 sec either before or after carbachol administration. Animals that had at least one AF episode that lasted >1 s were considered to be inducible. A. Null mice (7 of 9) were more susceptible to atrial arrhythmia than WT (1 of 7) (P=0.02, Fisher’s exact test, one tailed). B. Distribution of the durations of all AF episodes recorded in nulls. The majority of episodes recorded in WT were <1 s (not shown). C. Representative surface ECG and atrial electrogram from each group. Under 5-s 50 Hz burst pacing with carbachol administration, AF/AT could be induced in nulls but not in WT. During AF, the atrial electrogram was more disorganized. Numbers on the bars indicate number of animals tested.
Figure 6
Figure 6
Complex and dynamic rotors underlie the mechanism of AF in Scn2b null atria. A. Anatomical view from posterior of the atrial preparation under microscope (left) and camera (right). SVC: superior vena cava, SAN: sino-atrial node, IVC: inferior vena cava, PV: pulmonary veins. Pacing was at the edge of the RA appendage. B. Pacing-induced AF was driven by a single rotor in the RA. C. Induced AF was driven by two counter-rotating rotors (figure-of-eight re-entry) with 1:1 conduction to the left side. After carbachol perfusion, AF was driven by a single rotor located in the LA PV region with 2:1 conduction to the right side, resulting in twice the dominant frequency in left compared to the right. D. AF was driven by three different rotors spinning at 17.7 Hz and 26.5 Hz in RA and LA, respectively (upper left and lower left rotors, respectively). After its termination, the AF was spontaneously re-initiated by the wavebreak occurring in the RA (upper right and lower right). The resultant single rotor then drove the entire episode at 27.7 Hz in the RA with 1:1 conduction to the left. A volume conducted bipolar atrium electrogram showed two corresponding episodes of AF (bottom atrial ECG trace).
Figure 7
Figure 7
AP recordings from right atrial myocytes. A. No differences between genotypes in AP amplitude, AP maximum upstroke velocity, or resting membrane potential. WT: black. Null: red. B. APD50–90 was prolonged in the nulls at a pacing frequency of 5 Hz (*P<0.05, MRE analysis,). C. Representative superimposed AP traces from null and WT myocytes. D. Distribution of the APD90 data paced at 5 Hz from atrial myocytes. APD lengthening in atrial myocytes is heterogeneous, resulting in a dispersed distribution of the data set (Null: n=13, N=4; WT: n=12, N=5, Student’s T test). WT: black. Null: red. Blue: mean. n: number of cells tested. N: number of animals tested.
Figure 8
Figure 8
Increased fibrosis in Scn2b null right atrium. A. Masson’s trichrome staining shows increased fibrosis (blue) in null RA but not LA compared to WT. B. Quantification of fibrosis (P=0.002, Mann-Whitney Rank Sum Test). N=6 per genotype. C. Transition of atrial fibrillation to atrial flutter in null atrium. Increased levels of fibrosis are proposed to provide anchoring points for rotors underlying the transition.

Similar articles

Cited by

References

    1. Catterall WA. Voltage-gated sodium channels at 60: Structure, function and pathophysiology. J Physiol. 2012;590:2577–2589. - PMC - PubMed
    1. O’Malley HA, Isom LL. Sodium channel beta subunits: Emerging targets in channelopathies. Annu Rev Physiol. 2015;77:481–504. - PMC - PubMed
    1. Brackenbury WJ, Isom LL. Na channel beta subunits: Overachievers of the ion channel family. Front Pharmacol. 2011;2:53. - PMC - PubMed
    1. Bao Y, Isom LL. Nav1.5 and regulatory β subunits in cardiac sodium channelopathies. Card Electrophysiol Clin. 2014;6:679–694.
    1. Riuro H, Beltran-Alvarez P, Tarradas A, Selga E, Campuzano O, Verges M, Pagans S, Iglesias A, Brugada J, Brugada P, Vazquez FM, Perez GJ, Scornik FS, Brugada R. A missense mutation in the sodium channel beta2 subunit reveals scn2b as a new candidate gene for brugada syndrome. Hum Mutat. 2013;34:961–966. - PubMed

Publication types

MeSH terms

Substances