. 2017 May;206(1):315-332.
doi: 10.1534/genetics.116.190611. Epub 2016 Dec 7.

Population Genomics of Daphnia pulex

Affiliations

Population Genomics of Daphnia pulex

Michael Lynch et al. Genetics. 2017 May.

Abstract

Using data from 83 isolates from a single population, the population genomics of the microcrustacean Daphnia pulex are described and compared to current knowledge for the only other well-studied invertebrate, Drosophila melanogaster These two species are quite similar with respect to effective population sizes and mutation rates, although some features of recombination appear to be different, with linkage disequilibrium being elevated at short ([Formula: see text] bp) distances in D. melanogaster and at long distances in D. pulex The study population adheres closely to the expectations under Hardy-Weinberg equilibrium, and reflects a past population history of no more than a twofold range of variation in effective population size. Fourfold redundant silent sites and a restricted region of intronic sites appear to evolve in a nearly neutral fashion, providing a powerful tool for population genetic analyses. Amino acid replacement sites are predominantly under strong purifying selection, as are a large fraction of sites in UTRs and intergenic regions, but the majority of SNPs at such sites that rise to frequencies [Formula: see text] appear to evolve in a nearly neutral fashion. All forms of genomic sites (including replacement sites within codons, and intergenic and UTR regions) appear to be experiencing an [Formula: see text] higher level of selection scaled to the power of drift in D. melanogaster, but this may in part be a consequence of recent demographic changes. These results establish D. pulex as an excellent system for future work on the evolutionary genomics of natural populations.

Keywords: Daphnia; genetic variation; linkage disequilibrium; population genomics; population size.


Figures

Figure 1
Figure 1
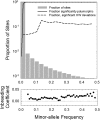
Top panel: Summary of the polymorphism and Hardy–Weinberg (HW) statistics, with fractions of sites with different minor allele frequency (MAF) estimates given as the bar graph. Bottom panel: The average inbreeding coefficient, Fis, as a function of the MAF. The dotted line is the expected value (0.0) under random mating.
Figure 2
Figure 2
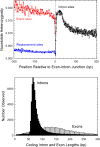
Top panel: Position-specific nucleotide diversities (π) averaged over all coding region introns and exons, with position 1 denoting the first (5ʹ-end) or final (3ʹ-end) site within an intron, i.e., the measurement scale is reflected at both ends of the intron to demonstrate the similar patterns at the 5ʹ- (closed points) and 3ʹ- (open points) ends. Only internal introns and exons (coding, but devoid of translation initiation and termination sites) are included. In the analyses for each intron/exon, calculations were truncated at the midpoint so that data are nonoverlapping, i.e., for an exon of length x, data from each end were confined to the x/2 adjacent sites. The vertical dotted line denotes the exon–intron junction. Bottom panel: Frequency distributions of sizes of internal coding region introns and exons.
Figure 3
Figure 3
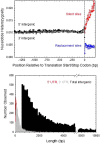
Top panel: Position-specific nucleotide diversities (π) averaged over all intergenic regions, here defined as the span between translation initiation and termination codons, regardless of orientation, and for the adjacent first and final coding exons, with position 1 (vertical dashed line) denoting the first position in the initiation codon or final position in the termination codon, i.e., the measurement scale is reflected at both ends of the coding region to demonstrate the similar patterns at the 5ʹ- (closed points) and 3ʹ- (open points) ends of the gene. The horizontal dotted line simply denotes the position where π=0.01 for reference. Bottom panel: Frequency distributions of lengths of total intergenic regions (black, and confined to regions >500 bp beyond translation, initiation, and termination codons) and the portions known to be transcribed into UTRs. Much of the 5ʹ-UTR distribution is hidden from view, but the overall distribution is very similar to that for 3ʹ-UTRs.
Figure 4
Figure 4
Observed frequencies of sites segregating 1, 2, 3, and 4 nucleotides, contrasted with the expectations from a model assuming independent mutations and correcting for parallel mutation (dashed line and open points; see File S1). The dotted line is the uncorrected Poisson distribution.
Figure 5
Figure 5
(A) Site frequency spectra for various classes of sites in window sizes of 0.01. The dashed line is the regression fit for the neutral expectation, Equation 1b, yielding 4kNeu=0.000186. The intron analyses are confined to those not flanked by exons containing translation initiation or termination sites; UTR analyses are confined to exonic DNA. (B) Plots of the elements of the site frequency spectra for various classes of sites vs. those for neutral sites (taken from the previous panel). The diagonal dashed lines have slopes equal to 1.0, which is the expected behavior under neutrality. MAF denotes minor allele frequency. (C) Fitted distributions for the ratios of site frequency spectra for selected vs. neutral sites. Data points are from 12 comparisons, with sample sizes (numbers of individuals with adequate coverage) from 75 to 80, and silent-site and intron-site data as comparators; fitted parameters are in Table 2. (D) Fitted gamma distributions of scaled fitness effects (Sm) for the four types of selected sites, also using parameters given in Table 2.
Figure 6
Figure 6
Historical changes in the effective population size from the present (left) to the past (right) derived from the frequency spectrum for neutral sites (black and red). Separate results are given for estimates derived from silent sites and restricted intron sites. The cumulative harmonic-mean population sizes are obtained directly from Equation 3, and the interval-specific estimates are those required to account for the cumulative harmonic means. The horizontal dotted line denotes the average estimate of Ne derived from the standing levels of heterozygosity for these sites. The lower blue plot denotes population-size estimates derived from the estimated homozygosity-tract length distribution using the method of Li and Durbin (2011), whereas the upper blue curve is derived by the method of Liu and Fu (2015). Assuming five generations per year, 200,000 generations implies 40,000 years.
Figure 7
Figure 7
Comparisons of the expected site frequency spectra for deleterious mutations (scaled to the expected site frequency spectrum for neutral sites) with various values of S=4Nas (denoted in the key) in the ancestral population, with the alternative demographic scenarios outlined in the text. Solid lines denote the results under a stable Ne, and dashed lines denote those under a scenario of a twofold decline over the past 250,000 generations.
Figure 8
Figure 8
Distribution of the neutrality index (NI) for the 6965 genes for which the ratio is defined, with the vertical dashed line denoting the neutral expectation of 1.0, and the red dots denoting the fraction of genes within categories for which the estimate of NI deviates from 1.0 by two or more SEs.
Figure 9
Figure 9
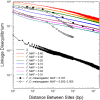
Measures of population-level (r2) and individual-level (Δ) estimates of linkage disequilibrium using the full set of genomic data (partitioned into various ranges of minor allele frequencies [MAFs] in the case of r2). For Δ, data are plotted for 10 individuals, although the differences are generally smaller than the widths of the points. The upper dashed line denotes the pattern for r2 for SNPs with MAF >0.167 on chromosome arms 2L, 2R, and 3L, obtained from Figure 9 in Langley et al. (2012); the lower dashed line denotes the average pattern for the full set of SNPs obtained from both arms of chromosomes 2 and 3 from a set of 200 inbred lines (with results from two different minimal cutoffs for the MAF plotted; Huang et al. 2014; data provided by W. Huang).
Figure 10
Figure 10
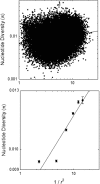
Relationship between average heterozygosity per nucleotide site (π) and a transformed measure of the average scaled measure of linkage disequilibrium, with each data point in the upper plot being based on results for nonoverlapping 3 kb windows across the genome. For clarity, the lower panel is based on the averages of measures within bins in the upper panel.

References

    1. Ackerman M. S., Johri P., Spitze K., Xu S., Doak T., et al. 2016. Estimating seven coefficients of pairwise relatedness using population genemoc data. Genetics (in press): @@@. - PMC - PubMed
    1. Andolfatto P., 2005. Adaptive evolution of non-coding DNA in Drosophila. Nature 437: 1149–1152. - PubMed
    1. Ayala F. J. (Editor), 1976. Molecular Evolution, Sinauer Associates, Inc., Sunderland, MA.
    1. Begun D. J., Aquadro C. F., 1992. Levels of naturally occurring DNA polymorphism correlate with recombination rates in D. melanogaster. Nature 356: 519–520. - PubMed
    1. Benger E., Sella G., 2013. Modeling the effect of changing selective pressures on polymorphism and divergence. Theor. Popul. Biol. 85: 73–85. - PMC - PubMed

Publication types